May 23, 2006 - Multi-level free-form deformation for shape optimization .... search space through degree elevation (using the properties of Bézier curves). ..... engine-pylon-body junction for an aircraft, for example, the box should be like in Fig ...
Free-form-deformation parameterization for multilevel 3D shape optimization in aerodynamics Michele Andreoli, Janka Ales, Jean-Antoine Desideri
To cite this version: Michele Andreoli, Janka Ales, Jean-Antoine Desideri. Free-form-deformation parameterization for multilevel 3D shape optimization in aerodynamics. [Research Report] RR-5019, INRIA. 2003.
HAL Id: inria-00071565 https://hal.inria.fr/inria-00071565 Submitted on 23 May 2006
HAL is a multi-disciplinary open access archive for the deposit and dissemination of scientific research documents, whether they are published or not. The documents may come from teaching and research institutions in France or abroad, or from public or private research centers.
L’archive ouverte pluridisciplinaire HAL, est destin´ee au d´epˆot et `a la diffusion de documents scientifiques de niveau recherche, publi´es ou non, ´emanant des ´etablissements d’enseignement et de recherche fran¸cais ou ´etrangers, des laboratoires publics ou priv´es.
INSTITUT NATIONAL DE RECHERCHE EN INFORMATIQUE ET EN AUTOMATIQUE
Free-form-deformation parameterization for multilevel 3D shape optimization in aerodynamics Michele Andreoli — Aleˇs Janka — Jean-Antoine D´esid´eri
No 5019 Novembre 2003 ` THEME 4
ISSN 0249-6399
apport de recherche
Free-form-deformation parameterization for multilevel 3D shape optimization in aerodynamics Michele Andreoli
∗
, Aleˇs Janka
†
, Jean-Antoine D´esid´eri
‡
Th`eme 4 — Simulation et optimisation de syst`emes complexes Projet Opale Rapport de recherche no 5019 — Novembre 2003 — 85 pages
Abstract: A versatile parameterization technique is developed for 3D shape optimization in aerodynamics. Special attention is paid to construct a hierarchical parameterization by progressive enrichment of the parametric space. After a brief review of possible approaches, the free-form deformation framework is elected for a 3D tensorial B´ezier parameterization. The classical degree-elevation algorithm applicable to B´ezier curves is still valid for tensor products, and its application yields a hierarchy of embedded parameterizations. A drag-reduction optimization of a 3D wing in transonic regime is carried out by applying the Nelder-Mead simplex algorithm and a genetic algorithm. The new parameterization including degree-elevation is validated by numerical experimentation and its performance assessed. Key-words: shape optimization, Aerodynamics, simplex method, genetic algorithm, B´ezier curves, multi-level parameterization, free-form deformation
∗ † ‡
Facolt´ a di Ingegneria Aerospaziale, Universit´ a di Pisa, Italy INRIA Sophia Antipolis, projet OPALE INRIA Sophia Antipolis, projet OPALE
Unit´e de recherche INRIA Sophia Antipolis 2004, route des Lucioles, BP 93, 06902 Sophia Antipolis Cedex (France) T´el´ephone : +33 4 92 38 77 77 — T´el´ecopie : +33 4 92 38 77 65
Une param´ etrisation 3D de type “free-form” pour l’optimisation multi-niveau en a´ erodynamique R´ esum´ e : On d´eveloppe une technique versatile de param´etrisation pour l’optimisation de forme 3D en a´erodynamique. On s’attache `a construire une param´etrisation hi´erarchique par enrichissement progressif de l’espace des param`etres. Apr`es un bref expos´e des approches possibles, on opte pour la formulation “free-form deformation” par le biais d’une param´etrisation de B´ezier 3D par produit tensoriel. La hi´erarchie des param´etrisations emboˆıt´ees s’appuie sur l’algorithme classique d’´el´evation du degr´e des param´etrisations de B´ezier, encore applicable aux produits tensoriels. On traite un probl`eme 3D de minimisation de la traˆın´ee d’une voilure d’avion en r´egime transsonique par l’algorithme du simplex de Nelder-Mead et un algorithme g´enetique. On valide la m´ethode par exp´erimentation num´erique et on ´evalue le gain en efficacit´e r´ealis´e par la strat´egie d’enrichissement. Mots-cl´ es : optimisation de forme, a´erodynamique, m´ethode du simplex, algorithme g´en´etique, courbes de B´ezier, param´etrisation multi-niveau, free-form deformation
3
Multi-level free-form deformation for shape optimization
Contents 1 Introduction
5
2 Shape Optimization in Aerodynamics 2.1 Flow Solver . . . . . . . . . . . . . . . . . Discretization in space . . . . . . . Boundary conditions . . . . . . . . Time integration . . . . . . . . . . Flow solver setup for optimization 3 Parameterization 3.1 Shape Representation . . . . . . . 3.2 B´ezier Curves . . . . . . . . . . . . 3.2.1 Polynomial Curves . . . . . 3.2.2 The de Casteljau Algorithm 3.2.3 Properties of B´ezier Curves 3.2.4 B´ezier patches and volumes 3.3 Mesh Deformation . . . . . . . . . 3.3.1 Linear and torsional springs Experiments . . . . . . . . 3.3.2 Transpiration Condition . . 3.3.3 Conclusion . . . . . . . . .
. . . . . . . . . . . . . . for . . . . . .
. . . . .
. . . . .
. . . . .
. . . . .
. . . . .
. . . . .
. . . . .
. . . . .
. . . . .
. . . . .
. . . . .
. . . . .
6 7 7 10 11 12
. . . . . . . . . . . . . . . . . . . . . . . . . . . . . . . . . . . . . . . . . . . . . . . . . . . . . . . . . . . . . . . . . . . . . . . . . . . . . . . . . . . . unstructured meshes . . . . . . . . . . . . . . . . . . . . . . . . . . . . . . . . . . . .
. . . . . . . . . . .
. . . . . . . . . . .
. . . . . . . . . . .
. . . . . . . . . . .
. . . . . . . . . . .
. . . . . . . . . . .
. . . . . . . . . . .
. . . . . . . . . . .
. . . . . . . . . . .
. . . . . . . . . . .
. . . . . . . . . . .
12 13 17 17 18 19 21 22 23 24 25 27
4 Genetic Algorithms 4.1 Coding . . . . . . . . . . . . . . . . . . . . 4.1.1 Binary coding . . . . . . . . . . . . 4.2 Fitness function . . . . . . . . . . . . . . . 4.3 Selection . . . . . . . . . . . . . . . . . . . 4.3.1 Roulette-wheel . . . . . . . . . . . 4.3.2 Tournament . . . . . . . . . . . . . 4.4 Crossover . . . . . . . . . . . . . . . . . . 4.5 Mutation . . . . . . . . . . . . . . . . . . 4.6 Parameters of configuration . . . . . . . . 4.7 Conclusion . . . . . . . . . . . . . . . . . 4.8 Validation of GAs on an analytic function
. . . . .
. . . . .
. . . . .
. . . . .
. . . . .
. . . . .
. . . . .
. . . . .
. . . . .
. . . . . . . . . . .
. . . . . . . . . . .
. . . . . . . . . . .
. . . . . . . . . . .
. . . . . . . . . . .
. . . . . . . . . . .
. . . . . . . . . . .
. . . . . . . . . . .
. . . . . . . . . . .
. . . . . . . . . . .
. . . . . . . . . . .
. . . . . . . . . . .
. . . . . . . . . . .
. . . . . . . . . . .
. . . . . . . . . . .
. . . . . . . . . . .
. . . . . . . . . . .
. . . . . . . . . . .
. . . . . . . . . . .
28 28 29 30 30 31 32 32 32 33 33 34
5 Derivative-Free Optimization Algorithms 5.1 Spendley, Hext and Himsworth simplex method 5.2 Nelder and Mead simplex method . . . . . . . . 5.2.1 Reflection . . . . . . . . . . . . . . . . . 5.2.2 Expansion . . . . . . . . . . . . . . . . . 5.2.3 Contraction . . . . . . . . . . . . . . . . 5.2.4 Reduction . . . . . . . . . . . . . . . . . 5.3 Conclusion . . . . . . . . . . . . . . . . . . . .
. . . . . . .
. . . . . . .
. . . . . . .
. . . . . . .
. . . . . . .
. . . . . . .
. . . . . . .
. . . . . . .
. . . . . . .
. . . . . . .
. . . . . . .
. . . . . . .
. . . . . . .
. . . . . . .
. . . . . . .
. . . . . . .
. . . . . . .
. . . . . . .
35 36 36 37 37 38 39 39
6 Numerical Experiments 6.1 Geometry of the test-case wing . . . . . . . . . . . . . . . . . . . . . . . . . . . 6.2 Computational Mesh . . . . . . . . . . . . . . . . . . . . . . . . . . . . . . . . .
39 40 42
RR no 5019
. . . . . . . . . . .
. . . . . . . . . . .
4
Andreoli & Janka & D´esid´eri
Simplex method 6.3 Simplex method for coarse parameterization (degree 6-1-1) . . . . 6.3.1 Simplex size . . . . . . . . . . . . . . . . . . . . . . . . . . . 6.3.2 Non linear flow residual . . . . . . . . . . . . . . . . . . . . 6.4 Simplex method for rich parameterization (degree 9-1-1) . . . . . . 6.4.1 Simplex size . . . . . . . . . . . . . . . . . . . . . . . . . . . 6.4.2 Non liner flow residual . . . . . . . . . . . . . . . . . . . . . 6.5 Simplex method with degree elevation . . . . . . . . . . . . . . . . 6.5.1 Testcase 1: degree elevation for small simplex. . . . . . . . 6.5.2 Testcase 2: degree elevation of best vs. all simplex vertices. 6.6 Parameterization enriching vs. finest parameterization only. . . . . 6.6.1 Large simplex . . . . . . . . . . . . . . . . . . . . . . . . . . 6.7 Summary and conclusions for simplex experiments . . . . . . . . .
. . . . . . . . . . . .
. . . . . . . . . . . .
. . . . . . . . . . . .
. . . . . . . . . . . .
. . . . . . . . . . . .
. . . . . . . . . . . .
. . . . . . . . . . . .
44 46 46 48 52 52 54 57 60 61 64 64 66
Genetic Algorithms 6.8 Set-up parameters for genetic algorithm . . . . 6.9 Genetic Range . . . . . . . . . . . . . . . . . . 6.10 Genetic algorithm with degree Elevation . . . . 6.10.1 Non linear flow residual . . . . . . . . . 6.11 Degree elevation vs. fine parameterization only 6.12 Summary and conclusions for GAs experiments
. . . . . .
. . . . . .
. . . . . .
. . . . . .
. . . . . .
. . . . . .
. . . . . .
71 71 71 75 76 77 81
7 Conclusions and perspectives
. . . . . .
. . . . . .
. . . . . .
. . . . . .
. . . . . .
. . . . . .
. . . . . .
. . . . . .
. . . . . .
. . . . . .
. . . . . .
82
INRIA
Multi-level free-form deformation for shape optimization
1
5
Introduction
Optimal Shape Design has been developed over the years, from the abstract field of calculus of variations to applications in structural mechanics and is becoming now a valuable tool for the design optimization in aeronautics, turbomachinery and automobile industry. Recent major improvements in CFD methods and optimization techniques were beneficial to 3D aircraft shape optimization, reducing significantly the time cycle for aircraft design through fully automated shape optimization. However, in order to be successfully employed at designing modern civil transport and business jets with more complex configurations, it is necessary to investigate new criteria and robust optimizers. An essential issue in optimal shape design is the choice of parameterization for the shape. A survey of different shape parameterization techniques is proposed for example in Samareh [43]. The ultimate interest of a parametrization is to describe the shape or the shape modifications with a reduced set of parameters, which would still permit to satisfy a large set of industrial constraints, coming from geometry (thickness, volume, twist) or aerodynamics (lift, drag, or momentum). Still, such a set of parameters might be quite large, especially in 3D. Unfortunately, too rich parametrizations cause problems in the convergence of the optimization process, due to its stiffness and due to non-optimality of most of the optimization algorithms with respect to number of shape parameters. To overcome the stiffness of the optimization process, our idea, inspired by nested iterations for numerical resolution of PDEs, is to proceed by successive enriching/coarsening of parameterizations using a multilevel approach [27]. The goal is to unlock the stiffness of the system through the use of a coarse parametrization with only a few parameters. Knowing what are the advantages and limits of each particular parametrization choice [43], in this paper we are presenting a kind of parametrization, based on Free Form Deformation [44], which allows us to parameterize complex shapes in 3D (wings or complete aircrafts) and allowings the implementation of a multilevel-approach. The proposed parameterization is then used in an optimization process to solve a 3D wing drag-reduction problem in transonic flow regime. The main objectives of the presented work are: • to review different parametrization techniques and develop a parametrization using FreeForm Deformation with B´ezier tensor-product (B´ezier volume) for complex 3D shapes; • to apply the parametrization to a 3D wing transonic optimization problem with one fixed flow regime; • to validate the parametrization using Derivative-Free Optimization algorithms (NelderMead simplex method and Genetic Algorithms); • to apply a multilevel approach in the optimization process: progressive enriching of the search space through degree elevation (using the properties of B´ezier curves). In view of the objectives above, the paper is structured in the following way. Chapter 2 introduces the general problem of optimal design in Aerodynamics and its mathematical description. It also contains a general description about drag force in Aerodynamics and about the flow solver. In a transonic regime, the presence of a shock wave has to be well detected. Different flow solver results are shown, comparing their quality and their CPU-cost. Chapter 3 contains the description of the new parametrization technique. Free Form Deformation, with B´ezier tensorial 3D parametrization (B´ezier volume) is proposed to describe only the shape deformation, and not the shape itself. A review of B´ezier curves, surfaces and volumes follows. Then, we discuss various mesh-deformation techniques, with particular interest
RR no 5019
6
Andreoli & Janka & D´esid´eri
in linear/torsional springs and in simulating boundary deformation by transpiration boundary conditions. Chapter 4 describes Genetic Algorithms. A summary of properties and characteristics of these algorithms is presented with a validation of the algorithm on a minimization problem with an analytical function. Chapter 5 contains an introduction on Derivative-Free Optimization Algorithms and in particular concerns the simplex methods. Description of different simplex methods is given with a special attention to the Nelder-Mead simplex method. Chapter 6 presents the results obtained in the optimization. We present the wing geometry and the 3D unstructured mesh created to simulate the flow-field around it. Using our parametrization, Nelder-Mead simplex method and Genetic Algorithms have been applied to solve the optimization problem. Different tests are done to see the influence of parameters like: degree of B´ezier parametrization, simplex diameter, resolution of the flow, coding of parameters for the genetic algorithm. Ultimately, we discuss about the use of the multilevel approach. The last Chapter concludes the work and presents the future perspectives.
2
Shape Optimization in Aerodynamics
The general problem of optimization is a computational problem in which the object is to find the best of all possible solutions; more formally, to find a solution in the feasible region which has the minimum (or maximum) value of the objective function subject to some constraints. Three components describe such a problem: control (design) parameters xc , the minimized objective (cost) functional J(xc ), depending explicitly or implicitly (through a solution W (xc ) of some physical state problem) on the values of design parameters, and the constraints. A general shape optimization problem can be expressed as a minimization problem over xc in the form J(xc , W (xc ), ∇W (xc )) → min E(xc , W (xc ), ∇W (xc )) = 0 g1 (xc ) ≤ 0 g2 (W (xc )) ≤ 0 where E represents the state equations, W are state variables of the underlying physical problem, and g1 , g2 are the geometrical and the state constraints, respectively. For shape-optimization in aerodynamics, the design parameters usually specify aerodynamic bodies. The cost functional depends usually on the solution of a flow problem around these bodies. The geometrical constraints are usually imposed of thickness, volume or other geometrical quantities of the aerodynamic shape. Aerodynamic constraints are usually expressed in terms of the lift coefficient CL , drag coefficient CD or momentum coefficient CM . The evaluation of the objective (cost) function J needs a solution W (xc ) of a flow problem, obtained by resolution of a system of PDEs. Different levels of approximations are possible in modelling the flow physics: potential flow, inviscid flow (Euler), viscous flow (Navier-Stokes), mean-time averaged turbulent flow (Reynolds-averaged Navier-Stokes - RANS), direct numerical simulation (DNS), large-eddy simulations (LES). The computational cost and the need for computer resources grow rapidly with the complexity of the model, considering the fact that a typical optimization requires to evaluate cost-functional for hundreds or thousands different shapes xc .
INRIA
7
Multi-level free-form deformation for shape optimization
Various optimization techniques are possible to minimize the objective function: deterministic or stochastic, gradient-based or gradient-free methods. The deterministic methods, or gradient-based methods, are based on the gradient of the cost function. Through the knowledge of gradient, the minimization direction is found. Such problem of optimal design can be treated within the mathematical theory of control of systems described by partial differential equations. The stochastic methods choose solutions by a random process. The most known are the evolutionary algorithms and the genetic algorithms. They both mimic the process of natural evolution but they are different in the structure. The gradient-free methods work without the knowledge of cost-function derivatives. The most known are the direct-search optimization algorithms: pattern search methods, simplex methods and methods with adaptive sets of search directions.
2.1
Flow Solver
In our optimization we have restricted ourselves to inviscid flows in 3D modelled by the Euler equations. The equations can be written in a conservative form: � �T ∂W ~ ~ · F(W ~ , E)T ~ = ∂ , ∂ , ∂ +∇ )=0 , W = (ρ, ρU , ∇ (1) ∂t ∂x ∂y ∂z ~ where F(W ) = (F1 (W ), F2 (W ), F3 (W ))T is the vector of the convective fluxes whose components are given by:
F1 (W ) =
ρu ρu2 + p ρuv ρuw u(E + p)
,
F2 (W ) =
ρv ρuv ρv 2 + p ρvw v(E + p)
,
F3 (W ) =
ρw ρuw ρvw ρw2 + p w(E + p)
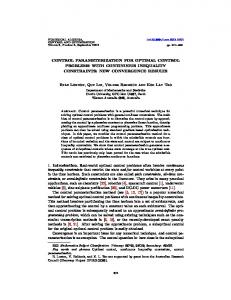
~ = (u, v, w)T is the velocity vector, E is the total In the expression (1), ρ is the density, U energy per unit of volume and p denotes the pressure. The pressure is deduced from the other variables using the state equation for a perfect gas 1 ~ 2 p = (γp − 1)(E − ρkU k ) 2 where γp is the ratio of specific heats (γp = 1.4 for the air). Discretization in space The flow domain Ω is assumed to be a polygonal bounded region of R2 . It is discretized by a triangulation Th , where h is the maximal length of the edges of Th . A vertex of the mesh is denoted by si , and the set of neighboring vertices by N (si ). We associate to each vertex Si a control surface (or cell) denoted by Ci , which is constructed as the union of local contributions from the set of triangles sharing si . The contribution of a given triangle is obtained by joining its barycenter G to the midpoints I of the edges adjacent to si (see Fig. 1). The boundary of Ci is denoted by ∂Ci and the unitary normal vector exterior to ∂Ci by ~vi = (vix , viy ). The union of all these cells constitutes a discretization of Ω often qualified as dual to Th :
RR no 5019
8
Andreoli & Janka & D´esid´eri
Figure 1: Barycentric control cell Ci on a 2D triangular mesh (left), half-cell in 3D (right)
Ωh =
Nv [
Ci ,
i=1
where Nv is the number of vertices of Th . The spatial discretization method combines the following elements: • a finite volume formulation together with upwind scheme for the discretization of the convective fluxes, • extension to second order accuracy is obtained by using the MUSCL (Monotonic Upwind Schemes for Conservative Laws) introduced by van Leer [49] and extended to unstructured triangular meshes by Fezoui and Stoufflet [8]. Integrating Eq. (1) over Ci and using Gauss theorem results in : Z Z X Z ∂W F~ (W ) · ~vi dσ d~x + ∂Cij Ci ∂t j∈N (i) Z Z F~ (W ) · ~ni dσ = 0, F~ (W ) · ~ni dσ + +
(2)
∂Ci ∩Γ∞
∂Ci ∩Γw
where ∂Cij = ∂Ci ∩ ∂Cj . A first order finite volume approximation of the first term of (2) can be written as: X Win+1 − Win + ∆t φF (Win , Wjn , ~vij ) = 0 (3) j∈N (i)
where φF denotes a numerical flux function such that: Z F~ (W ) · ~vi dσ , φF (Wi , Wj , ~vij ) ≈
~vij =
∂Cij
Z
~vi dσ
(4)
∂Cij
The numerical flux (4) yields a conservative scheme if for any edge [si , sj ] the following condition is verified: φF (Wi , Wj , ~vij ) = −φF (Wj , Wi , ~vji ).
(5)
INRIA
Multi-level free-form deformation for shape optimization
9
Upwinding is introduced in the calculation of (3) by using the approximate Riemann solver of Roe [42] which gives: F~ (Wi ) + F~ (Wj ) (Wj − Wi ) · ~vij − | AR (Wi , Wj , ~vij ) | , (6) 2 2 � � ∂F (Wi , Wj , ~vij ) is the so-called matrix of Roe that verifies the where AR (Wi , Wj , ~vij ) = ∂W R following property: φF (Wi , Wj , ~vij ) =
AR (Wi , Wj , ~vij )(Wj − Wi ) = F (Wj , ~vij ) − F (Wi , ~vij )
(7)
F (W, ~vij ) = F~ (W ) · ~vij
(8)
with:
The numerical flux (6) can thus be reformulated as: φF (Wi , Wj , ~vij ) = F (Wj , ~vij ) − A+ vij )(Wj − Wi ) R (Wi , Wj , ~
(9)
φF (Wi , Wj , ~vij ) = F (Wj , ~vij ) + A− vij )(Wj − Wi ) R (Wi , Wj , ~
(10)
or as :
˜) with AR (Wi , Wj , ~vij ) = A~vij (W ˜ = W ρ˜ = u ˜ = v ˜ = ˜ H =
where H = that:
γp (γ−1)ρ
+
u2 +v 2 2
˜ ) given by: with the Roe average state (W ˜ T (˜ ρ, ρ˜u ˜, ρ˜v˜, E) √ √ √ √ ( ρ1 ρ1 + ρ2 ρ2 )/( ρ1 + ρ2 ) √ √ √ √ ( ρ1 u1 + ρ2 u2 )/( ρ1 + ρ2 ) √ √ √ √ ( ρ1 v1 + ρ2 v2 )/( ρ1 + ρ2 ) √ √ √ √ ( ρ1 H1 + ρ2 H2 )/( ρ1 + ρ2 )
(11)
is the total enthalpy per unit volume. On the other hand, we have ˜ ) = T (W ˜ )Λ± (W ˜ )T −1 (W ˜) A± (W
(12)
� �T ~ · ~v − c, U ~ · ~v , U ~ · ~v , U ~ · ~v + c , Λ= U
(13)
with:
where c =
q γ ρp denotes the speed of sound. The MUSCL technique [49] for the extension to
a second order approximation of (4) relies on a linear interpolation of the state vector Wij and Wji at the interface (Iij ) between cells Ci and Cj : ~W ˜ )i · si s~j ˜ ji = W ˜j − 1 (∇ ~W ˜ )j · si s~j , ˜ ij = W ˜ i + 1 (∇ W , W (14) 2 2 � �T ˜ = ρ, U ~,p where W (see Fig 2). The interpolation is done using the physical variables instead of the conservative variables. Then, the interpolated states (14) are used as arguments to the numerical flux function (3).
RR no 5019
10
Andreoli & Janka & D´esid´eri
Figure 2: Interpolated physical states Wij and Wji between cells Ci and Cj . ~W ˜ )i are obtained from a weighted average of the P1 Galerkin (centered) The nodal gradients (∇ gradients computed on each triangle of the finite element support of si : Z Z ~W ˜ |T d~x ∇ 3 X area(T ) X 1 C i ~W ˜ )i = ~ Tk ˜ )k ∇φ Z Z (∇ = (15) (W area(Ci ) 3 T ∈Ci k=1,k∈T d~x Ci
where φTk (x, y, z) is the P1 basis function defined at the vertex Sk and associated with the triangle T. The construction given by Eq.(14)-(15) results in a half-upwind scheme which is second order accurate but can present spurious oscillations in the solution, expressing a loss of monotony. A classical way to remedy this problem is to make a compromise between the first order and the second order schemes through the use of a slope limitation procedure. Boundary conditions The terms 3 and 4 in the second line of Eq. (2) are associated with the boundary conditions of the problem. These are now taken into account in the weak formulation. The following situations are considered: ~ · ~n = 0. This condition is introduced in • solid wall. We impose on Γw the slip condition U the corresponding term of Eq.(2) which results in : 0 Z n ˜ ix (16) F~ (W ) · ~ni dσ = pi · area(∂Ci ) n ˜ iy ∂Ci ∩Γw 0 • far-field boundary. On Γ∞ , we make use of a uniform flow state vector, i.e. we assume that the flow at infinity is uniform (this assumption is valid for external flows): ~ ∞ = (u∞ , v∞ )T ρ∞ = 1 , U
with
~ ∞ k= 1 , p∞ = kU
1 2 γM∞
(17)
where M∞ is the far-field Mach number. Here, an upwind−downwind flux decomposition is used between the external information (W∞ ) and the state vector Wi associated to a boundary vertex si ∈ Γ∞ . More precisely, the corresponding boundary integral of the second term of Eq.(2) is evaluated through a non-reflexive version of the Steger and
INRIA
11
Multi-level free-form deformation for shape optimization
Warming flux decomposition: Z F~ (W ) · ~ni dσ = A+ (Wi , ~ni∞ ) · Wi + A− (Wi , ~ni∞ ) · W∞ .
(18)
∂Ci ∩Γ∞
Time integration Assuming W (~x, t) constant on each cell Ci (in other words a mass lumping technique is applied to the temporal term in Eq.(2)) we obtain the following set of semi-discrete equations: area(Ci )
dWin + Ψ(Win ) = 0 , dt
i = 1, · · · , Nv ,
(19)
where Win = W (~xi , tn ) , tn = n∆tn and: Ψ(Win ) =
X
j∈N (i)
φF (Wij , Wji , ~vij ) +
Z
F~ (W ) · ~ni dσ.
(20)
∂Ci ∩Γ
Explicit time integration procedures for time integration of (19) are subject to a stability condition expressed in terms of a CFL (Courant-Friedrichs-Lewy) number. An efficient time advancing strategy can be obtained by means of a implicit linearized formulation such as the one described in Fezoui and Stoufflet [8] and briefly outlined here. First, the implicit variant of Eq. (19) writes as: area(Ci ) δWin+1 + Ψ(Win+1 ) = 0 , ∆tn
i = 1, · · · , Nv
(21)
where δWin+1 = Win+1 − Win . Then, applying a first order linearization to the nodal flux Ψ(Win+1 ) yields the Newton-like formulation : � � area(Ci ) ∂Ψ(W n ) + δW n+1 = −Ψ(Win ) (22) ∆tn ∂W ∂Ψ(W n ) by an approximate ∂W n Jacobian matrix J(W ) resulting from the analytical differentiation of the first order flux (6) with respect to the cell-averaged states Wi : � � area(Ci ) n + J(W ) ∂W n+1 = −Ψ(Win ). (23) P (W n )∂W n+1 = ∆tn
In practice, we replace the exact Jacobian of the second order flux
The resulting Euler implicit time integration scheme is in fact a modified Newton (see Fezoui and Stoufflet [8] for details). As a consequence, one cannot ensure that this formulation will yield a quadratically converging method for time steps tending to infinity. The matrix P (W n ) is sparse and has the suitable properties (diagonal dominance (ie. M-matrix) in the scalar case) allowing the use of a relaxation procedure (Jacobi or Gauss-Seidel) in order to solve the linear system of Eq.(22). Moreover, an efficient way to get second order accurate steady solutions while keeping the interesting properties of the first order upwind matrix is to use the second order elementary convective fluxes based on Eq.(14)-(15) in the right-hand side of Eq. (22). The above implicit time integration technique is well suited to steady flow calculations; for unsteady flow computation, this first order time accurate scheme is generally unacceptably dissipative.
RR no 5019
12
Andreoli & Janka & D´esid´eri
Flow solver setup for optimization For resolution of the Euler problem, we have chosen an implicit scheme with Roe Flux approximation combined with MUSCL and van Albada limiters [48]. For approximative resolution of the linear system at each time-step we use a few relaxation of Gauss-Seidel method. The stopping criteria is based on l2 norm of the numerical flux in Energy equation. By an l2 norm of energy residual we mean a Euclidean norm over the degrees of freedom in the right-hand side of the linear system, corresponding to discretization of total energy E. We will call it the non-linear flow residual.
3
Parameterization
One of the crucial points in the correct definition of a shape optimization problem is the choice of the parameterization technique describing the optimal shape. Such a parameterization should be: - versatile: possibility to describe quite a broad spectrum of potentially complex 3D shapes with geometrical constraints, - concise: it should use as few parameters as possible, because the number of design parameters heavily affect the CPU cost of the optimization process. In this respect, we could use an a-priori approximate knowledge of the expected shape of the searched optimum (or its regularity). Moreover, in addition of the two crucial properties above, we search for parameterizations in which one can introduce the notion of: • parameterization hierarchy, • self-adaptivity. A survey of shape parameterization techniques is proposed in Samareh [43]. The most used approches are as the following. • Discrete Approach: it is based on using the coordinates of the boundary points as design variables (see Fig. 3(a)). This approach is easy to implement. However, it is too much connected to the solution mesh and does not enable adaptive-mesh flow evaluations. Due to the eccessive refinement of the parametrization, comparable to the resolution of the mesh, it is difficult to maintain a smooth geometry of the optimized shape. For a model with a large number of grid points, the number of design variables often becames very large, which leads to hight cost and a difficult (stiff) optimization problem to solve. It is easy to parameterize complex 3D objects, but there are some problems with definition of normals to a discrete surface (see Fig. 3(b)). Hierarchical parameterization using this approach might be done for example by agglomeration [27]. • Polynomial and Spline Approaches: the shape is described by a polynomial curve in a very compact form with a small set of design variables . For example, with a B´ezier curve, the control points are used as design variables (see Fig. 4). Despite recent progress, it is still difficult to parameterize and construct complex, three-dimensional models based only on polynomial and spline representations. Complex shape requires a large number of control points. The smoothness of the shape deformation is assured. Moreover, with B´ezier parameterization, the property of degree elevation (Section 3.2.3) might be employed to construct a hierarchical parametrization.
INRIA
Multi-level free-form deformation for shape optimization
13
• CAD-based Approach: most solid modelling CAD systems use either a boundary representation (B-Rep) or a constructive solid geometry method to represent a physical, solid object. Based on a complete mathematical definition of a solid, it is possible to create a complete geometry. These system use Boolean operations such as intersection and union of simple features (e.g. holes, slots, cuts, protrusion, fillets, chamfers, etc.). Existing Feature-based solid modelling (FBSM) CAD tools are not capable of calculating sensitivity derivatives analytically. After reconstructing the shape geometry, usually a new mesh must be generated. • Analytical Approach: the formulation is based on adding shape functions (analytical functions) linearly to the baseline shape. All participating coefficients are initially set to zero, so the first computation gives the baseline geometry. The shape functions are smooth functions based on previous airfoil design. This method is very good for wing parameterization, but not simple to generalize for complex geometries. • Free Form Deformation (FFD) Approach: FFD is one of the techniques of deforming computer-generated objects, which comes from Computer Graphics [44]. The FFD approach operates on the whole space regardless of the representation of the deformed objects embedded in the space. Instead of manipulating the object directly, FFD deforms a lattice that was built around the object . The lattice is a space, in the shape of a cube or an arbitrary volume [1], which wraps around the object. This lattice is basically a composite of B´ezier tensor patches in 3D called a B´ezier volume, but it is also possible to use B-spline or NURBS ([5], [22]). When we move the control points of the lattice, the lattice is deformed. At the same time, the object inside the lattice is deformed (see Fig. 5).
(a) RAE2822 designed by a set of points
(b) 3D wing designed by a set of points and its normals
Figure 3: Discrete Approach
3.1
Shape Representation
In this work, the free-form deformation (FFD) method, with B´ezier volume (the next section is a review about B´ezier curves and its properties), has been applied.
RR no 5019
14
Andreoli & Janka & D´esid´eri
Figure 4: Polynomial approach
Before After Figure 5: FFD Approach One of the inconveniences of standard B´ezier curves/patches is that they describe only smooth objects, and for a non-smooth object they need a very high order curves/patches (with danger of oscillation) or several curves/patches joined by some continuity condition C 0 , C 1 . Using several glued patches puts an obstacle to the degree elevation process, which works only for one patch. A better idea is to describe through B´ezier parameterization just the deformation and not the shape itself. We can write for any mesh node q: xq = xq init +
n m X l X X
Bil (sq )Bjm (tq )Bkn (uq )δpijk
i=0 j=0 k=0
In this way, even if the shape is not smooth, we will look for a smooth deformation (see Fig. 6). For B´ ezier delta f ormulation, control points lose its meaning of position, the only input determining the parameterization is the assignment of B´ezier parameters tq = (sq , tq , uq ) for every node q of the mesh. The choice of tq can modify the shape of the control box around the object. Suppose, for example, that we should search for an optimal wing whose form is obtained only by a linear interpolation of root and tip sections (no double curvature), and keeping fixed the leading edge and the trailing edge. If we choose for tq the node values of the mesh, the box will be like the one shown in Fig. 7, and the displacement of the control points at the tip section will not allow us to respect these constraints. For this reason, a new set of (sq , tq , uq ) coordinates might be calculated, through a scale factor between root and tip sections, which give us a box like the
INRIA
15
Multi-level free-form deformation for shape optimization
B´ezier inconveniences
B´ezier delta formulation
Figure 6: B´ezier parameterization one shown in Fig. 8 following tightly a given planform.
Figure 7: General box around the wing
Figure 8: Box of B´ezier control points around the wing The choice of B´ezier volume for FFD is done because of the degree elevation property (see Section 3.2.3). It will allow us to construct a hierarchy of embedded B´ezier parameterizations
RR no 5019
16
Andreoli & Janka & D´esid´eri
and a hierarchy of rigorously-nested optimization search spaces. The choice of degree of the tensorial B´ezier representation in the three directions is up to the design engineers. In Chapter 6 we will show testcases with different degree but the way how we move the control points remains the same for different degree. For example, if we look at a B´ezier representation of order 6 (x direction), 1 (y direction), 1 (z direction) the box around the wing is like in Fig. 9. The four corners of the box are fixed, to keep fixed the leading and the trailing edge, and the resting control points can move only in y direction (see Fig. 10). Moreover, for the range of displacement of control points it is possible to use an arbitrary interval (for example 10% of root thickness or more). The choice of this range, as we will see in Chapter 6, has a direct implication for the results of the optimization when using genetic algorithms.
Figure 9: Example of B´ezier representation, degree 6-1-1
Figure 10: Root control point authorized displacements
INRIA
Multi-level free-form deformation for shape optimization
17
We remark here that our parameterization is not limited to wings. In an optimization of engine-pylon-body junction for an aircraft, for example, the box should be like in Fig. 11.
Figure 11: Free-form deformation for an engine-pylon-body optimization
3.2
B´ ezier Curves
The B´ezier curve representation is used most frequently in computer graphics and geometric modelling. The curve is defined geometrically, which means that the parameters have a geometric meaning - they are just points in three-dimensional space. This parmetrization was developed by two competing European engineers in the 1960s to attempt drawing automotive components. Two engineers responsable for their development were Pierre B´ezier who worked for Renault and Paul de Casteljau who worked for Citro¨en. The curve was named after Pierre B´ezier, even though de Casteljau first used the curve. B´ezier was the first to publish and therefore the idea bears his name. Later, the curve was developed in the 1970s for CAD/CAM operations. 3.2.1
Polynomial Curves
A two-dimensional (three-dimensional, d-dimensional) polynomial curve is a parameterized curve t 7→ P (t): Pn (t) =
n X
ai · ti = an tn + · · · + a1 t + a0
with an , an−1 , · · · , a1 , a0 ∈ R2 (R3 , Rd )
i=0
The set of all d-dimensional polynomial curves of degree n is denoted by Pnd . The standard basis for Pn is the monomial basis 1, t, t2 , · · · , tn .
RR no 5019
18
Andreoli & Janka & D´esid´eri
Another possible basis for Pn , used in the B´ezier curves, is the basis of Bernstein polynomials. The polynomial �n� Bin (t) = ti (1 − t)n−i , i = 0, · · · , n i is called the ith Bernstein polynomial of degree n. Properties of the binomial coefficients are: � n! • definition: ni = i!(n−i)! � � � � n+1 n • recursive definition: ni = 1, = n+1 i+1 i+1 i • Pascal triangle: recursion
�
n+1 i+1
�
=
�
n i+1
�
+
n i
�
and symmetry
n i
�
=
�
n n−i
�
Properties of Bernstein polynomials are: 1.
Pn
2.
Pn
n n n i=0 Bi (t) = (t + (1 − t)) (Binomial Theorem: (a + b) =
n i=0 Bi (t)
n � � X n
k=0
k
ak bn−k )
= 1 (partition of 1)
3. Bin (t) ≥ 0 , t ∈ [0, 1] (positivity) n−1 4. Bin (t) = t · Bi−1 (t) + (1 − t) · Bin−1 (t) (recursion) n 5. Bin (t) = Bn−i (1 − t) (symmetry)
6. Bin (t) has a maximum in [0, 1] at t =
i n
A polynomial curve Pn (t) =
n � � X n i=0
i
(1 − t)n−i ti pi
is called a B´ezier curve of degree n. The points pi are called control points or B´ezier points, the polygon formed by the control points is called the control polygon. 3.2.2
The de Casteljau Algorithm
� For the evaluation of the points of the curve Pn (t), we avoid calculating ni because it is not numerically stable. Instead, we use a method for evaluating B´ezier curves by the de Casteljau algorithm. Given: control points p0 , · · · , pn of a Bezier curve and t ∈ R , set � r = 1, · · · , n r−1 pri (t) = (1 − t) pr−1 (t) + t p (t) i i+1 i = 0, · · · , n − r p0i (t) = pi . then: pn0 (t) is the point with parameter value t on the B´ezier curve Pn .
INRIA
Multi-level free-form deformation for shape optimization
19
The polygon P formed by p0 , · · · , pn is called the B´ ezier polygon or control polygon of the curve Pn . Figure 12 illustrates the cubic case. The point p30 is obtained from repeated linear interpolation. The cubic case n = 3 is shown for t = 1/4.
Figure 12: The de Casteljau algorithm
3.2.3
Properties of B´ ezier Curves
The de Casteljau algorithm allows us to infer several important properties of B´ezier curves. Affine invariance. B´ezier curves are invariant under affine maps, which means that the following two procedures yield the same result: (1) first, compute the point at given t and then apply an affine map to it; (2) first, apply an affine map to the control polygon and then evaluate the mapped polygon at parameter value t. Affine invariance is a direct consequence of the de Casteljau algorithm beacuse the algorithm is composed of a sequence of linear interpolations (or, equivalently, of a sequence of affine maps). Convex hull property. For t ∈ [0, 1] , Pn (t) lies in the convex hull (see Fig. 13) of the control polygon. This follows since every intermediate pri is obtained as a convex barycentric combination of previous pr−1 . j Endpoint interpolation. The B´ezier curve passes through the points p0 and pn . We have Pn (0) = p0 and Pn (1) = pn . Symmetry. It does not matter if the B´ezier points are labeled p0 , p1 , · · · , pn or pn , pn−1 , · · · , p0 . The curves that correspond to the two different orderings look the same. Written as formula: n X j=0
RR no 5019
pj Bjn (t) =
n X j=0
pn−j Bjn (1 − t)
20
Andreoli & Janka & D´esid´eri
Figure 13: Convex hull: a polygon and its convex hull, shown shaded It follows from the symmetry of Bernstein polynomials. Derivatives. The derivative of a B´ezier curve is another B´ezier curve, obtained by differencing the original control polygon. Written as a formula: n−r X n! dr P (t) = ∆r pj Bjn−r (t). n dtr (n − r)! j=0
where ∆r pj ∆pj
= ∆r−1 pj+1 − ∆r−1 pj = pj+1 − pj
is the iterated forward difference operator. In particular, the arc begins at p0 (and terminates at pn ), admits p0 p1 (resp. pn−1 pn ) as tangent at t = 0 (resp. t = 1); similarly, the curvature can be controlled by p2 at the origin, and by pn−2 at the endpoint. Integrals. The integral of a B´ezier curve is another B´ezier curve. Degree elevation. Degree elevation increase the degree of a curve without changing the shape of the curve. Given a B´ezier curve of degree n, based on n + 1 control points pk (k = 0, 1, · · · , n), the new set of n + 2 control points p′ k (k = 0, 1, · · · , n + 1) given by p′ 0 p′ k p′ n+1
= p0 , k k pk−1 + (1 − )pk , = n+1 n+1 = pn ,
1 ≤ k ≤ n,
defines the same geometrical curve, now viewed as a B´ezier curve of degree n + 1 (see Fig. 14).
INRIA
21
Multi-level free-form deformation for shape optimization
A B´ezier curve admits infinitely many representations of different degrees. Repeating the degree elevation process will produce convex control polygon with larger and larger number of points, and, at the limit, the control polygon will converge to the curve. By degree elevation, the distribution of the B´ezier parameters t over the curve does not change, i.e. Pn (t) = Pn+1 (t).
B´ezier degree 6 curve
B´ezier degree 7 curve
Figure 14: Degree elevation
3.2.4
B´ ezier patches and volumes
The B´ezier patch is the surface extension of the B´ezier curve. A way to build a surface is to sweep a curve through space such that its control points move along some curves. The control points of these control curves describe the surface (see Fig. 15). The surface representation by these control points has properties analogous to those of a univariate curve representation. Similarly, one can build multidimensional volumes by sweeping a surface or volume through space such that its control points move along curves. Whereas a B´ezier curve of degree n is a function of one variable (B´ezier parameter) and takes a sequence of (n + 1) control points, the patch is a function of two variables with an array of control points. The patch is constructed from an (n + 1) × (m + 1) array of control points {pi,j : 0 ≤ i ≤ n , 0 ≤ j ≤ m} , and the resulting surface, which is now parameterized by two variables, is given by the equation P(s, t) =
n m X X
Bim (s)Bjn (t)pi,j .
i=0 j=0
Similarly, a B´ezier volume can be defined as follows: P(s, t, u) =
l X m X n X i=0 j=0 k=0
RR no 5019
Bil (s)Bjm (t)Bkn (u)pi,j,k
,
22
Andreoli & Janka & D´esid´eri
with a cube of (l + 1) × (m + 1) × (n + 1) control points.
Figure 15: B´ezier surface of degree (3,3) and its B´ezier control net
3.3
Mesh Deformation
During the shape-optimization process, parts of the mesh boundary are being changed (displaced and deformed), and the 3D computational mesh must follow the deformed surface. Therefore, we have to develop a robust algorithm, which would move the computational mesh for the largest skin-deformations possible, and would give an acceptable volumic mesh for the CFD calculations. The mesh moving techniques have to be of a reasonable CPU complexity, because the mesh update has to take place, theoretically, each time a new shape is explored. In the literature [32], one might choose from: - explicit deformation: we prescribe the deformation to apply to each mesh node (Marocco [31]), knowing the shape skin deformation; the deformation for a node is proportional to its distance to the shape. We can write, for an internal node i : X (δxm )i = 1 wk αki δ x ˜i αi k∈Γ w δx ˜m = δx ˜ on Γw where δxm is the sought variation of the mesh nodes, wk is a weight for the contribution of each of the nodes k of the shape which depends on the lenght of the Xneighboring 1 wk αki is a with β a positive arbitrary parameter, α = segments, αki = |˜xk −˜ i β xi | k∈Γw
normalization parameter and Γw is the moving shape with a prescribed displacement δx ˜m . This algorithm is quite robust but expansive. The complexity is proportional to the number of the shape nodes times the number of mesh nodes.
INRIA
23
Multi-level free-form deformation for shape optimization
- elliptic smoothing: we can solve the following (I − η△)δxm = δx ˜ = δx ˜ =
elliptic system: δx ˜ δx ˜ 0
on in
Γw D,
where δxm is the mesh variation, η the viscosity coefficient in the mesh deformation process, taken proportional to local element size, Γw is the moving shape with displacement δx ˜m and D internal nodes of the mesh. This algorithm is quite cheap but not very robust, and it does not keep the conformity of the element for fine meshes.
- linear and torsional springs : the existing fluid grid can be seen as a continuous or discrete pseudo-structural system with fictious mass, damping and stiffness properties (Farhat [6]-[7]). A quasi-static version of the equation of the dynamic equilibrium for the system can be written as: � Kq = 0 on Γm , q = q where K is the stiffness matrix, q is the displacement vector and q denotes the prescribed or somehow determined displacement vector on the moving boundary Γm . - transpiration conditions: for small shape deformations, without moving the mesh, we can represent the shape modification by deriving more complex boundary conditions called transpiration conditions. With known structural displacements and velocities, a simple modification to the nodal boundary conditions on existing grid is capable of altering the displacements and velocities used in the flow solver for the new shape. No modifications are made to the existing grid except for a slight boundary condition modification to nodes on a deformable surface. In our work, we have focused on implementation and use of linear/torsional springs and transpiration condition. 3.3.1
Linear and torsional springs for unstructured meshes
Linear and torsional springs method is a common way to modify a mesh around moving boundaries (Farhat et al. [6]-[7]). As already said, the existing fluid grid can be seen as a continuous or discrete pseudostructural system with fictitious mass, damping and stiffness properties. The system can be described using the equations of dynamic equilibrium. Most work on dynamic meshes has focused on the quasi-static version of this equation, which can be written in this way: Kq = 0 q = q ¯
on Γm ,
(24) (25)
where K is the stiffness matrix, q is the displacement vector and q ¯ denotes the prescribed or somehow determined displacement vector on the moving boundary Γm . The collection of the edges of the mesh can be assimilated with a network of linear springs. However, it has been shown in [6] that linear springs (even for a 2D mesh) are not sufficient to prevent elements collapsing to inadmissible computational mesh. Therefore, one introduces, complementary to linear springs, a system of torsional springs, between each 2 edges leading from the same node (see Fig. 16 - 2D case).
RR no 5019
24
Andreoli & Janka & D´esid´eri
The linear stiffness coefficient of the spring between the generic nodes i and j is chosen to be inversely proportional to the lenght lij of the supporting edge kij =
1 lij
,
and the torsional stiffness coefficient is given by Ciijk =
1 2
sin
θiijk
=
2 2 lij lik 4A2ijk
.
While the linear spring prevents the vertex collision along the edge (ij), the torsional spring controls the angle at vertex i and consequently the area of the triangle. After a rigorous kinematics analysis [6], it is possible to superpose the effect of the linear and torsional springs to get a global stiffness matrix K. If we apply a deformation to the mesh boundaries, the new mesh is the position of equilibrium of the new pseudo-structural system. The displacement of the nodes is the solution of the linear system (24). This method, originally devised for 2D only [6], has been generalized for 3D [7] in the following way. Let T pqrs denote a tetrahedron (as in Fig. 16 - 3D case). To prevent the collision of vertex s with face pqr, we propose to insert a triangle τ sjq inside the tetrahedron T pqrs . The best anti-collision effect might be attained if the triangle τ sjq is in a plane perpendicular to the face pqr (see Fig. 16). Indeed, if the tetrahedron volume tends to zero due to the vertex s colliding with the face pqr, the area of sjq tends to zero. Hence, controlling the area of τ sjq by torsional springs prevents vertex s from penetrating face pqr. The transfer of the elastic forces that are associated with torsional springs from the triangle τ sjq to the tetrahedron T pqrs is discussed in [7].
2D case 3D case Figure 16: Torsional springs elements
Experiments This method, for the 2D case, is robust for general unstructured meshes and for quite large deformations (see Fig. 17). Some results of the 3D case can be seen in Fig. 18 19, form our experience the 3D variant is much less robust than the 3D one.
INRIA
25
Multi-level free-form deformation for shape optimization
The springs method uses a linearized pseudo-elasticity model, therefore only small deformation are treated. In terms of CPU time, the torsional spring method is quite expensive. In the 3D, case for example, after the computation of the local stiffness matrix for one tetrahedron, we have to iterate for all the tetrahedra in the mesh and, at the end, to solve a linear system.
Multibody airfoil
Multibody airfoil with flap deflection
Flap mesh before deflection
Flap mesh after deflection
Figure 17: Example of 2D springs method for unstructured meshes 3.3.2
Transpiration Condition
Transpiration can trace its origins to 1950’s in [25]. This paper describes the method of equivalent sources for modeling the influence of the boundary layer on the inviscid flow outside them. Rather than thicknening an actual airfoil, the boundary layer effect could be accounted for by an equivalent surface distribution of sources. Simplicity, speed and accuracy are the greatest advantages of the transpiration concept. The idea is simple. With known structural displacements and velocities, a simple modification to the nodal boundary conditions on the existing grid is capable of altering the displacements and velocities used in the flow solver. No modifications are made to the existing grid except for a slight boundary condition modification to nodes on a deformable surface. When we have a deformation of the surface, we have also a change in orientation of the normal (see Fig. 20(a)). Transpiration assumes that there is no significant stretching or volumetric change within the element so that the area of each element remains constant. Assuming that a normal has an x,y and z components, a change in orientation is accomplished by changing the velocity boundary condition on the affected nodes. This change in boundary conditions comes in the form of an additional fluid velocity outside the existing surface elements (see Fig. 20(b)).
RR no 5019
26
Andreoli & Janka & D´esid´eri
Figure 18: Cube and Deformed Cube Let us denote by shell the shape to be emulated by transpiration and by ~nshell the normal of the shell. The slip boundary term of the flux Ψ(W ) is defined as follows: 0 p(W )nx Ψ(W )slipboundary = qW + p(W )ny p(W )nz p(W )q with: ~ · (~n − ~nshell ), q=V ~ is the velocity of the fluid. In summary, each surface element that has undergone a where V change in orientation acts as a source sheet. The strenght of the source is determined by the extent of the simulated deflection. This approximation has proved accurate enough for rather large perturbations of the boundary and very robust. Its accuracy has been effectively demonstrated over time through work done in [9], [41]. With the transpiration method, there is no mapping from one coordinate system to another, no relative nodal displacements, no elementary volume changes, no changes of the computational domain, no need to iteratively solve for a new nodal boundary conditions, etc. In an environment where speed, without sacrified accuracy, is of primary concern, transpiration method has shown itself as a viable tool.
INRIA
Multi-level free-form deformation for shape optimization
27
Figure 19: Section Z=0.5
(a) Slight surface Element rotation
(b) Transpiration concept
Figure 20: Transpiration 3.3.3
Conclusion
Without considering the transpiration method where we are not moving the mesh, none of the methods guarantee the conformity of the elements when the deformation is important.
RR no 5019
28
Andreoli & Janka & D´esid´eri
In the present work, inspired by the approach used by N. Marco and A. Dervieux [27] and by Young et al. [14] and by the results obtained, we have chosen to represent the shape modification by applying a transpiration condition.
4
Genetic Algorithms
In The Origin of Species [3], Charles Darwin stated the theory of natural evolution. Over many generations, biological organisms evolve according to the principles of natural selection like “survival of the fittest” to reach some remarkable forms of accomplishment. In nature, individuals in a population have to compete with each other for vital resources. Because of such selection, poorly performing individuals have less chance to survive, and the most adapted, or ”fit” individuals produce a relatively larger number of offsprings. After a few generations, species evolve spontaneously to become more and more adapted to their environment. In 1975, Holland developed this idea in Adaptation in natural and artificial system. By describing how to apply the principles of natural evolution to optimization problems, he laid down the first Genetic Algorithm. Holland’s theory has been further developed and now Genetic Algorithms (GAs) emerge as a powerful adaptive method to solve search and optimization problems. Some results can be seen in [28, 29, 30]. In Genetic Algorithms, we use the term individual to denote one configuration of the optimal shape. The feasibility of the shape is judged by a fitness function, reflecting the minimized cost functional and penalizing geometrically unfeasible individuals. The shape parameters of one individual are encoded in the individual’s chromosome. The Genetic Algorithm operates simultaneously on an entire population of individuals (shapes), the initial population being generated either randomly or as a set of feasible individuals using an a-priori engineering guess. The core of the Genetic Algorithm consists in selection, crossover and mutation operators, whose role is to mimic natural empiric laws of survival of the fittest (selection), their procreations (crossover) and occasional mutations. The generation operators are usually not deterministic, they implement their operators in the probabilistic sense, with a given probability distribution. The crossover is performed with a crossover probability pcross (or crossover rate); two selected individuals (parents) exchange parts of their chromosome to create two offsprings. This operator tends to enable the evolutionary process to move towards ”promising” regions of the search space. The mutation operator is introduced to prevent premature convergence to local optima by randomly sampling new points in the search space. It is carried out by flipping bits at random, with some (small) probability pmut . Genetic algorithms are stochastic iterative processes that are not guaranteed to converge. They have a great potential to explore the whole search space and identify multiple local maxima and to converge to the global optimum while a ”point to point” method will generally stall in a local optimum only. They are found more robust in the case of non differentiable, multi-modal or non convex functions, and are particularly interesting for search of a trade-off optimum with respect to several criteria (Pareto front, Nash game).
4.1
Coding
To apply Genetic Algorithms to a specific problem, we must first define an appropriate representation for the solution. We must find a way to encode any solution of the problem into a chromosome of a certain structure. This structure shared by all the chromosomes is called the genetic representation. Solutions might be encoded into a string of bits of a given length. The advantage of bit-string chromosomes is their versatility and simplicity. Historically, GAs have
INRIA
Multi-level free-form deformation for shape optimization
29
1. Initial population (random or heuristically) 2. Coding (binary, character-based, real-valued, etc.) 3. Evaluation of population (fitness function) 4. Selection (Roulette-wheel or Tournament) 5. Crossover (Uniform or N-point) 6. Mutation 7. Update (new generation → go to step 3) Table 1: Genetic Algorithms always tried to be a universal solver, able to deal with a wider range of problems. So, binary coding was seen as a standard representation that can fit almost all kinds of search space. Indeed, a string of bits can encode integers, real numbers, sets or whatever is appropriate for the optimized problem. Moreover, the genetic operators over the binary chromosomes are quite simple. Mutation and recombination of bit strings can be done with very simple and universal operators. However, bit strings are often not really appropriate for particular problems. A problem-specific representation, where integer genes represent integer parameters, real genes represent real parameters, character strings represent sets, and so on, can be customized in a way that gives more sense and coherence to the algorithm. 4.1.1
Binary coding
Let us focus on binary coding of real parameters in the chromosome. It can be viewed as a fixed-point representation of real-parameters. For every real parameter xi , we give a range of variation and a coding-precision. The bit-lenght of the part of the binary chromosome reserved for encoding xi , xi ∈ [liinf , lisup ], with at least the given precision ǫi is then calculated as the smallest integer nbiti such that 2nbiti − 1 ≥
(lisup − liinf ) . ǫi
The chromosome is the set of all the genes describing the variables of one individual, the total number of bit for one individual is then nbit =
n X
nbiti .
i=1
The decoding of the chromosome is done by the formula: xi = liinf +
nbit lisup − liinf Xi ibit −1 2 Ch(ibit ) , 2nbiti − 1 i =1 bit
RR no 5019
30
Andreoli & Janka & D´esid´eri
where Ch(ibit ) is the binary value (0 or 1) of the gene ibit associated with the variable xi . For example, for a chromosome with two real parameters - parameter 1: l1inf = 1.1, l1sup = 3.1, ǫ = 1 → nbit1 = 2, - parameter 2: l1inf = −8.0, l1sup = −1.0, ǫ = 1 → nbit2 = 3, the lenght of the cromosome is nbit = 5. Inversely, if we have, for example, the chromosome [11011], the decoded real value parameters x1 and x2 are as follows: x1 x2
4.2
= 1 + 32 (20 · 1 + 21 · 1) = 3.0 = −8 + 77 (20 · 0 + 21 · 1 + 22 · 1) = −2.0
Fitness function
Once the genetic representation has been defined, the next step is to associate to each solution (chromosome) a value corresponding to the fitness function. There is generally no problem in determining the fitness function. Particular attention should be taken due to the fact the selection is done according to the fitness of individuals. In the case of multicriteria optimisation, the fitness function is definitely more difficult to determine. There is often a dilemma as how to determine if one solution is better than another. The trouble comes more from the definition of a ’better’ solution rather than from how to implement a GA to resolve it. For more advanced problems, it may be useful to consider something like Pareto optimality or other ideas from multicriteria optimisation theory. The constrains in Genetic Algorithms are introduced mostly by penalization and usually the feasibility region is rapidly detected by Genetic Algorithm process. The penalty method allows constraints to be violated, depending on the magnitude of the violation. However, a penalty that is proportional to the degree of infeasibility is incurred which degrades the objective function. If the penalty is large enough, highly infeasible individuals will rarely be selected for reproduction, and the GA will concentrate on feasible or nearly-feasible solutions. In the case of wing optimization if we are interested only in drag reduction but we want to keep lift, one possible fitness function, with a penalty on lift-preservation, is
J=
� � CL CD , + 104 · max 0, 0.999 − CD0 CL0
where the subscript 0 is refering to the original wing. In this case, 0.1% or more loss in lift will increase the fitness function by more than 10, while lift increasing is not penalized at all.
4.3
Selection
The selection operator is designed to implement the law of the survavil of the fittest. Like everywhere in the genetic algorithm, two aspect are to be considered: the convergence of the genetic algorithm towards some solution and the variety (diversity) of the genetic material influencing the exploratory potential for new solutions. Usually, these two aspects act in contradiction. Following this remark, the design of a good selection operator must introduce an algorithm which would handicap bad individuals but would not spoil the variety of the genetic material by choosing systematically only the best individuals to be parents for a new generation.
INRIA
31
Multi-level free-form deformation for shape optimization
individual 1 2 3 4
fitness value 169 576 64 361 shoot 1 2 3 4
result 35.4 87.9 56.7 12.7
probability 0.144 0.492 0.055 0.309
percentage 14.4% 49.2% 5.5% 30.9%
selection 2 4 2 1
Table 2: Example of the roulette-wheel selection Typically we can distinguish two types of selection schemes, proportionate selection and ordinal-based selection. Proportionate-based selection picks out individuals based upon their fitness values relative to the fitness of the other individuals in the population. Ordinal based selection schemes select individuals not upon their raw fitness, but upon their relative ordering (ranking) within the population. 4.3.1
Roulette-wheel
Roulette-wheel selection is the classic and popular fitness-proportionate selection. It simply assigns to each solution a sector of a roulette wheel whose size (the angle it subtends) is proportional to the appropriate fitness measure (usually a scaled fitness of some sort). Then it chooses a random position on the wheel (and the solution to which that position was assigned, as if spinning the wheel). In order to create a new population of parents, the weighted roulettewheel is spun n times, where n is the population size (see Table 2 and Fig. 21).
Figure 21: Roulette-wheel selection
RR no 5019
32
4.3.2
Andreoli & Janka & D´esid´eri
Tournament
T ournament selection is an ordinal-based scheme, robust and relatively simple. Many variations exist, but the basic mechanism is to pick k members of the population at random and then select one of them in some very simple manner that depends on fitness. Choosing the best members of the tournament produces a relatively strong selection pressure. So, generally the best is chosen with the probability p, if it fails to be chosen, the second best is chosen with the probability p, and so on until the final solution is chosen. The selection pressure can be adjusted by changing k and p. Clearly tournament selection as described is unaffected by the absolute fitness values, and in effect depends only on the rank of any solution in the population.
4.4
Crossover
It is the process of taking two parent solutions and producing from them a child. There are many different reproducing operators. The most common is an N-point crossover. The N-point crossover takes two chromosomes, aligns them and divides them by N cuts into N+1 segments. A child is produced by choosing alternatively a segment from one or the other parent. Two different children can be produced depending if the first segment is taken from the mother or from the father. An example of 1-point crossover is shown in Fig. 22. Uniform crossover is quite different from the N-point crossover. Each gene (bit) in the offspring is created by copying the corresponding gene from one or the other parent, chosen according to a randomly generated binary crossover mask of the same length as the chromosomes. Where there is a 1 in the crossover mask, the gene is copied from the first parent, and where there is a 0 in the mask the gene is copied from the second parent (see Fig. 23). A new crossover mask is randomly generated for each pair of parents. Offsprings therefore contain a mixture of genes from each parent.
Figure 22: 1-point crossover
4.5
Mutation
Mutation is a simple operator consisting of random changes in the value of genes in a chromosome. Mutation has traditionally been considered as a simple search operator. If crossover is supposed to exploit the current solutions to find better ones, mutation is supposed to help for the exploration of the whole search space. Mutation is often seen as a background operator to maintain genetic diversity in the population. There are many different forms of mutation for
INRIA
Multi-level free-form deformation for shape optimization
33
Figure 23: Uniform crossover the different kinds of chromosome coding schemes. For binary coding, a simple mutation can consist in inverting the value of each gene with a small probability.
4.6
Parameters of configuration
Let us summarize what kind of information one should input to Genetic Algorithms: - coding: range of variation [min,max] and coding-precision ǫ - choice of genetic operators selection, crossover, mutation - probabilities for stochastic genetic operators - population size and stopping condition In Chapter 6 we will use the following notations for Genetic Algorithms tests: popsize: the size of the population maxgen: maximum number of generations pcross: percentage of crossover pmutat: percentage of mutation selecttype: type of selection (tournament or roulette-wheel) crosstype: type of crossover (N-point, uniform,etc.)
4.7
Conclusion
Since about fifteen years ago, Genetic Algorithms have been introduced in aerodynamics shape design problems (see [19],[37], [40],[35]). The main concern related to the use of genetic algorithms is the computational effort needed for the accurate evaluation of a configuration that might lead to unacceptable computer time if compared with more classical algorithms. Eventhough, they can be effectively parallelized, the CPU cost related to evaluation of the whole population is quite high. A review of the basic structure of a Genetic Algorithm is: 1. inizialize randomly a population of individuals 2. evaluate the individuals following their fitness (cost functional) value 3. apply genetic operators (selection, crossover and mutation) to the population 4. re-run from point 2 until the convergence is reached.
RR no 5019
34
4.8
Andreoli & Janka & D´esid´eri
Validation of GAs on an analytic function
Let us consider in this section a global minimization problem of an analytical objective function F, known as the Rastrigin function: F (~x) = A · n +
n X
x2i − A · cos(ω · xi )
i=1
A = 10 ; ω = 2 · π ; xi ∈ [−5.12, 5.12] The Rastrigin Function is a typical example of non-linear multimodal function. This function was first proposed by Rastrigin as a 2-dimensional function [47] and has been generalized by M¨ uhlenbein et al. in [33] to Rn . This function is a fairly difficult problem due to its large search space and its large number of local minima. The surface of the function is determined by the external variables A and ω, which control the amplitude and frequency modulation, respectively. The optimum solution of the problem is the vector ~x = (0, · · · , 0) with the function value F (~x) = 0.
Figure 24: Rastrigin Function Let us validate our genetic algorithm in this type of problem. The common parameters for our Genetic Algorithm are:
INRIA
Multi-level free-form deformation for shape optimization
35
- maxgen: 300 - pcross: 0.85 - pmutat: 0.005 - selecttype: roulette-wheel - crosstype: 2-points In Fig. 25 we can see the convergence history choosing an hight popsize value (100).
Figure 25: Convergence history (popsize = 100) Genetic Algorithms are able to find the optimum solution in few generations and we can see in Fig. 25 that there is also an agglomeration of individuals in the local minima values. We see from Fig. 25, that we have roughly attained the global minimum F (~x) = 0 after 150 generations, the next 150 generations were need to improve the precisions of our guess. Also, we remark that the genetic algorithm was able to identify more than one converged state corresponding to local minima (the clusters of fitness values). We shall note for our future CPU-complexity considerations that minimum has been achieved after 300 × 100 function evaluations. Most of the optimization algorithms are not able to find global minimum. Genetic lgorithms are more powerful in this respect, although they are quite time-consuming.
5
Derivative-Free Optimization Algorithms
A class of optimization algorithms working without the knowledge of cost-function derivatives is called the derivative − f ree optimization algorithms. One of the representives of such algorithms are the direct search methods [39], [23]. Among the direct search methods we count, for example, • pattern search methods , • simplex methods ,
RR no 5019
36
Andreoli & Janka & D´esid´eri
Figure 26: Original simplex, reflection and the resulting simplex • methods with adaptive sets of search direction. Although these methods have been developed heuristically and no proof of convergence have been derived for them, in practice they have generally proved to be robust, fast and reliable. While they do not assure finding global minimum, they only rarely fail to locate at least a local minimum of the cost-function. In our work, we have focused on implementation and use of a simplex method. The simplex methods are characterized by the simple device that they use to guide the search for minimum - a non-degenerate simplex in Rn . A simplex is a set of n + 1 points in Rn and a non-degenerate simplex is one for which the set of edges adjacent to any vertex forms a basis for the space. For the minimization of a function of n variables, the search depends on the comparison of function-values in n + 1 vertices of the simplex.
5.1
Spendley, Hext and Himsworth simplex method
The basic idea of simplex search, due to Spendley, Hext and Himsworth [45], is the attempt to reflect bad simplex vertices through a hyper-plane specified by the resting vertices. Importantly, this operation of evolving towards parameter-values with low cost-function value does not degenerate the simplex (see Fig. 26). Starting from this consideration, we can see how this method works. After the identification of the worst vertex in the simplex (the one with the least desirable cost value), there is a reflection of this worst through the centroid of the opposite face. If the reflected vertex is still the worst vertex, then we choose the ”next worst” vertex and we repeat the process. When the method is near to the minimum, there is a circling sequence of simplices. For example, in Fig. 27, after five reflections the search is back where it started, without replacing xi , which means that xi is in the neighborhood of a minimum point. When this situation has been detected, the authors suggested two alternatives: either reduce the lenghts of the edges adjacent to the minimum vertex and resume the search, or resort to a higher-order method to obtain faster local convergence [23].
5.2
Nelder and Mead simplex method
The modification of the simplex algorithm of Spendley proposed by Nelder and Mead [34] has additional moves designed to accelerate the search. They have proposed to supplement the basic reflection move with additional options to deform the simplex in a way that they suggested would better adapt to the features of the objective function. For this purpose, they added expansion and contraction moves.
INRIA
37
Multi-level free-form deformation for shape optimization
Figure 27: Behaviour near a minimum 5.2.1
Reflection
At the generic iteration k, the reflection of the vertex xkj ∈ Rn is denoted by xkr (see Fig. 28) and its coordintes are defined by the relation xkr = (1 + α)¯ xk − αxkj
,
where α is a positive constant, called the ref lection coefficient, generally fixed to 1, and x ¯k is the centroid of the points. After this, there are some possibilities: • xkr is the best among the other points ⇒ expansion move , • xkr is still the worst value ⇒ contraction move , • otherwise xkr is taken like a new value of xkj and a new iteration is done.
Figure 28: Reflection move
5.2.2
Expansion
If the reflection has produced a new best value, we expand xkr to xke (see Fig. 29) by the relation xke = γxkr + (1 − γ)¯ xk , where γ is called expansion coefficient; it is greater than 1 and usually it is the ratio of the distance xke x ¯k to xkr x ¯k . After this step, the possibilities are:
RR no 5019
38
Andreoli & Janka & D´esid´eri
• xke is better than xkr ⇒ xke is taken as new value for the next iteration , • xke is worst than xkr ⇒ xkr is taken as new value for the next iteration .
Figure 29: Expansion move
5.2.3
Contraction
If the reflection has always produced the worst cost-function value, the choice is to replace xkr with a new vertex position xkc using the relation xkc = βxkr + (1 − β)¯ xk , xkc
=
βxkj
k
+ (1 − β)¯ x ,
if
f (xkr ) < f (xkj )
(Fig. 30)
if
f (xkr )
(Fig. 31)
>
f (xkj )
If xkc is a better value, it is replacing the vertex xkj in the next iteration. In the other case, the simplex is not good for the topology of the problem and a reduction move is necessary.
Figure 30: Contraction move, if f (xkr ) < f (xkj )
Figure 31: Contraction move, if f (xkr ) > f (xkj )
INRIA
Multi-level free-form deformation for shape optimization
5.2.4
39
Reduction
All the points are replaced by xk+1 = i
xki + xkm , 2
where xkm is the best value. There are two possibilities: • f (xkr ) > f (xkj ) ⇒ the reduction is applied (see Fig. 32), • f (xkr ) < f (xkj ) ⇒ xkr replaces xkj (reflection) and then the reduction is applied (see Fig. 33).
Figure 32: Reduction move, if f (xkr ) > f (xkj )
Figure 33: Reduction move, if f (xkr ) < f (xkj )
5.3
Conclusion
The Nelder-Mead simplex algorithm is enjoying an enduring popularity. Of all the direct search methods, it is the one most often found in numerical software packages. However, this algorithm is not yet accepted by the mathematic community for lack of convergence demonstrations. Recently it has been proved [21] that the algorithm converges towards a stationary point in R1 .
6
Numerical Experiments
This chapter describes some results obtained with the optimization code. In particular, we consider optimization by genetic algorithms and by simplex method. At first, we are comparing the two approaches with respect to both the ability to find the globally best shape within the prescribed search-space, and their speed and CPU cost. Also, we conduct some comparative
RR no 5019
40
Andreoli & Janka & D´esid´eri
studies of different set-ups of parameters of the respective methods. Most important is, nevertherless, the comparison of optimizations using the B´ezier degree elevation idea in order to speedup the convergence. In all tests, we are optimizing a 3D wing in transonic regime. In the following two sections we will describe our test-case, its geometry, discretization mesh, cost functional and imposed aerodynamic and geometric constraints.
6.1
Geometry of the test-case wing
The wing is a swept back wing. Starting from a given planform sketch in Fig. 34 (courtesy of Piaggio Aero Industries), we have chosen for our test-planform the dimensions shown in Fig. 35. The main chord at the root is 2911 mm, the sweet angle is 19.7◦ in the leading edge and 6.4◦ in the trailing edge, while the span lenght is 7540 mm. The root chord is 1057 mm. To construct the 3D geometry, we have used a B´ezier representation of a NACA0012 airfoil (see Fig. 39), which is a polynomial profile, with two B´ezier curves of order 8 (extrado and intrado). The 3D wing is composed by 20 slices of NACA0012 profile placed equidistantly and scaled at different span-lenghts (see Fig. 40). The free-stream state regime is: Mach number Angle of flow incidence
0.83 2◦
In all the tests, the minimized cost function (fitness) is: � � CD CL J= , + 104 · max 0, 0.999 − CD0 CL0 The 0 subscript is refering to the original wing. With this cost function, 0.1% or more loss in lift will increase the fitness function by more than 10, while lift-increasing is not penalized at all. In Fig. 36 we can see the pressure and the Mach fields of the original wing. These results are obtained using the flow solver of Chapter 2.1, with a stopping criterion ǫ = 10−6 on non linear flow residual. In the following figures, we plot the adimensional pressure computed as p∗ =
p ~ ∞ k2 ρ∞ kU
,
~ ∞ the velocity at infinity. where p is the local pressure, ρ∞ the density and U The Mach field is shown only for supersonic values of velocity. In a transonic optimization problem, we are interested to see if this region is reduced or not during the process. As we can see in Fig. 36, in a transonic regime, there is a shock wave over the extrado of the wing. In front of the shock wave, the fluid particles are in a supersonic regime, and behind in a subsonic one. The intensity of the wave is strictly correlated with the size of supersonic-regime zones but, at the same time, also with the intensity of the drag. It means that the shock wave and, in particular, the drag are reduced if we reduce the supersonic zones. In all the results, we will take for comparison the CL and CD values of the original wing that we have obtained with a non linear flow residual 10−6 . We can see in Table 3 the difference in CL and CD between a well converged flow-solution (non linear flow residual 10−6 ) and weakly converged flow solution (non linear flow residual 10−3 ).
INRIA
Multi-level free-form deformation for shape optimization
Figure 34: Geometry of the wing (courtesy of Piaggio Aero Industries)
Figure 35: Planform Geometry
CL CD
10−3 0.3192006583 0.0263540181
10−6 0.3192007875 0.0263532471
Table 3: influence of non linear flow residual on the original solution
RR no 5019
41
42
Andreoli & Janka & D´esid´eri
Pressure field
Mach field Figure 36: Original wing
As seen in Chapter 3, the 3D B´ezier tensorial parameterization allows us to choose its degree in three directions x-y-z. Throughout this presentation, x-direction is placed along the chord, y-direction is thicknesswise and z-direction spanwise. One of the geometric constraints we are to apply is the so-called no-double curvature requirement. This constraint coming from the manufacturing process translates into restricting all possible optimal wing shapes to those whose shape can be obtained by a linear interpolation of the root and tip sections along the spanwise direction. Hence, to satisfy this option, we choose a particula parametric box following the wing planform and set the degree of parameterization in z-direction to 1. We choose degree 1 also in the y direction (thickness). With these choices, we are moving only the control points along the x direction. As already said in Chapter 3, we fix the four corners of the control box (see Fig. 38). This choice, and the degree 1 in y direction, allows us to keep fixed the leading and the trailing edge and the planform area. Throught this study, we compare parameterizations of degree 6, 7, 8, 9 along the x-direction (chord-wise), ie with 7, 8, 9, and 10 control points along the x-direction. Let us refer to different degree parameterizations by i-j-k, where i denotes the degree in x-direction, ie in our study i=6,7,8,9, j is the degree in y-direction and k in z-direction, i.e. for us j=k=1. In Fig. 37 there is an example of parameterization of degree 6-1-1 (x-y-z direction).
6.2
Computational Mesh
Usually, grid generation methods may be classified into three categories, depending on the choice of topology and the type of elements used to construct the grid,: 1. unstructured grids; 2. structured grids; 3. hybrid grids.
INRIA
Multi-level free-form deformation for shape optimization
43
Figure 37: B´ezier representation of degree 6-1-1
Figure 38: Root control point authorized displacements These categories describe the layout of the physical cell and the neighbour relationship between cells in a given grid. U nstructured grids are typically formed by simplices such as tetrahedra; these grids can be generated in most complex domains and mesh refinement can be done without difficulties. This grid is usually refined in sensible flow areas and coarsened in unimportant zones. Structured grids are usually formed by hexahedra (eight nodes and six quadrilateral faces). Their rigid structure may favour the computation (for the spatial derivatives) and diminish the computational errors due to the discretization. They tend to propagate the refinements inside the mesh. To limit the fine grid propagation a multi-block grid is necessary. A multi-block grid is a collection of structured grids that togheter fill the domain. Hybrid grids takes advantage of both unstructured and structured methods by applying structured meshes near to the body and unstructured meshes in the outer boundaries.
RR no 5019
44
Andreoli & Janka & D´esid´eri
Classical structured grid generation is well documented by Thompson in [46], for unstructured see George [10], [11]. As seen in section 2.1, our flow solver is based on unstructured grids. For the flow regime parameters, we need a 3D adapted mesh for transonic flow with a shock solved with Euler solver. For future developments, we prefer to have not only the 3D external mesh for the CFD calculations, but also a second, auxiliary interior mesh, needed for applying geometric constraints on wing volume, wing-box position, or relative change in local thickness. Considering a high CPU complexity of an optimization process, where several hundreds or thousands of flow-evaluations will be necessary, we are searching for the smallest mesh possible giving us still acceptable results. With these consideration, and eager to test 2D and 3D mesh deformation techniques, we have created our mesh in this way: • creation of a 2D transonic mesh of a RAE2822 airfoil (see Fig. 41): this is an adapted mesh for transonic flow solved with a 2D Euler solver at the same regime (M = 0.83, α = 2◦ ); the number of nodes of the 2D mesh is 1004; the shock position is refined; • substitution of a RAE airfoil in 2D with a NACA0012 airfoil using torsional springs method of Section 3.3.1 (see Fig. 42); • generation of 20 slices of 2D NACA mesh along the span direction on a rectangular planform (see Fig. 43); • generation of 11 slices of the tip section mesh from tip to far-field; • creation of elements (tetrahedra) between the slices (20+11) applying a scale factor between root and tip section. The resulting mesh is shown in Fig. 44. The number of nodes is 31124 and the number of elements is 173445. The supposed emplacement of the transonic shock is refined.
Figure 39: NACA0012 and its control points
Simplex method Let us take the simplex method of Nelder-Mead as in Chapter 5 and perform several tests for our test-case with different degrees of parameterization and different settings.
INRIA
45
Multi-level free-form deformation for shape optimization
Figure 40: 3D wing
Global mesh
RAE2822 airfoil
Figure 41: 2D transonic mesh (also in the interior of the profile) First of all, we will take degree 6-1-1 parameterization (ie. the coarsest) and test the quality of solutions and convergence speeds of the simplex method with respect to the simplex diameter (size) of the initial simplex. We shall remember that simplex method finds local minimum only. Secondly, we study the possibility of saving up to 50% of CPU time by poorer resolution of the flow problem and its effects on the quality of the solution. The two kind of tests as above are then repeated for the finest parameterization of degree 9-1-1.
RR no 5019
46
Andreoli & Janka & D´esid´eri
Figure 42: NACA 0012 mesh (also in the interior of the profile)
Root section
Tip section
Figure 43: Example of 2 slices (root and tip section) After this validation phase, we will finally study the influence of the degree-elevation strategy on the speed of convergence.
6.3 6.3.1
Simplex method for coarse parameterization (degree 6-1-1) Simplex size
Simplex method being one of the methods of descent, it tends to converge to local minima only. Nevertheless, unlike a gradient-based method, the descent is tested only in discretes values of parameters - the simplex vertices. Therefore, by choosing a big simplex at initialization, it might happen that the simplex during its reflection iterations will be able to skip local minima. Let us test this idea numerically: starting from the same initial solution, we will compare convergence and quality of solution when using a small simplex (simplex diameter ǫ = 10−1 ) or a large simplex (ǫ = 10+2 ). The definition of the 2 test-cases is summarized in Tab. 4. In Figs. 45 - 46 and in Tab. 5 we can see the convergence history and the fitness results. In the convergence history plots, we show the fitness of all n + 1 simplex vertices at each iteration (evolutions) of the simplex, n is the number of design parameters. At the same time, we give the minimum envelope of the fitness on the right of the convergence plot. Usually, between 2
INRIA
Multi-level free-form deformation for shape optimization
47
Figure 44: 3D mesh: wing and far-field boundaries (above), detail of the wing and symmetry plane (below).
RR no 5019
48
Andreoli & Janka & D´esid´eri
Testcase A Testcase B
degree 6-1-1 6-1-1
res 10−6 10−6
ǫ 10−1 10+2
Table 4: Testcases A and B parameters iterations of the simplex method, we need just one evaluation of fitness. In Fig. 46, however, we can observe a particular behaviour of the method around the 40th iteration : a massive resizing (shrinking)of the simplex, in the reduction move. In Fig. 47 we can see the Mach field for the two solutions and the comparison in the root and tip sections. The results of this test drives us to say that the choice of the simplex diameter ǫ in the method is very important. The differences in the solution quality and in the convergence speed are great. It seems, that starting with larger simplices is advantageous. One may explain this observation by the fact, that our cost-function has multiple local minima and that bigger simplex diameter of initial simplex gives the possibility to skip some of the local minima.
Figure 45: Convergence history (testcase A) - small simplex
Original Testcase A Testcase B
CL 0.3192007875 0.3189389963 0.3188854856
CD 0.0263532471 0.0191390335 0.0129805887
Fitness 1 0.726249536 0.492561266
Variation -27.4% -50.8%
Table 5: Testcases A and B results (large vs. small simplex)
6.3.2
Non linear flow residual
We have remarked in the precedent experience, that for one optimization test one needs about 300-400 cost function evaluations, ie. calculate 300-400 times the flow problem. The relative CPU time is several days. One natural question is whether or not we can save time by, for
INRIA
49
Multi-level free-form deformation for shape optimization
Figure 46: Convergence history (testcase B) - large simplex example, simply changing our non linear flow residual, and resolving just roughly the flow problem. Let us compare two optimizations using large initial simplex and resolving the flow problem either only very weakly, or almost completely. The CPU time difference between the two is almost 75%. The parameters of the test-case are shown in Tab. 6. Testcase C Testcase D
degree 6-1-1 6-1-1
ǫ 10+2 10+2
res 10−3 10−6
Table 6: Testcases C and D parameters In Fig. 48 and in Tab. 8 we can see the convergence history and the fitness results. The values for the original wing are taken from the solution with non linear flow residual 10−6 . In Fig. 49 we can see the computational time in hours. We notice, that the CPU-cost is rather different for the two cases. The attained solutions have similar fitness - the difference in fitness is only 0.1%. The solutions in terms of the optimal shapes are qualitatively similar, but not the same, see Fig. 50. Let us repeat our experiment for small initial simplex ǫ = 10−1 . The test-case definition is in Tab. 7. Testcase E Testcase F
degree 6-1-1 6-1-1
ǫ 10−1 10−1
res 10−3 10−6
Table 7: Testcases E and F parameters From the results that we can see in Tab. 9 and in the Fig. 52, we observe that in this case the differences in fitness (2.8%) and in the wing section are more important. It follows, probably, from the fact that the simplex size ǫ is small, hence the difference of simplex vertices in terms of shape is small, and just an approximative solution of the flow is not able to recognize it.
RR no 5019
50
Andreoli & Janka & D´esid´eri
Mach field testcase A
Mach field testcase B
Root section
Tip section Figure 47: Testcases A and B
It seems, at this point, that saving time by just an approximative flow resolution might be viable. However, as we will see later, experiments for parameterizations 9-1-1 show that this way is quite dangerous, due to the diminished aptitude of the approximative solver to distinguish small variations of shape.
Original Testcase C Testcase D
CL 0.3192007875 0.3190279479 0.3188854856
CD 0.0263532471 0.0130044710 0.0129805887
Fitness 1 0.493453061 0.492561266
Variation -50.7% -50.8%
Table 8: Testcases C and D results
INRIA
51
Multi-level free-form deformation for shape optimization
Figure 48: Convergence history (testcases C and D): precise vs. rough flow resolution for large simplex.
Figure 49: Computational time (testcases C and D)
Original Testcase E Testcase F
CL 0.3192007875 0.3269697856 0.3189389963
CD 0.0263532471 0.0198700887 0.0191390335
Fitness 1 0.753968091 0.726249536
Variation -24.6% -27.4%
Table 9: Testcases E and F results: precise vs. rough flow resolution for small simplex.
RR no 5019
52
Andreoli & Janka & D´esid´eri
Mach field testcase C
Mach field testcase D
Root section
Tip section Figure 50: Testcases C and D
6.4
Simplex method for rich parameterization (degree 9-1-1)
Let us now refine our parameterization and use degree 9 in chord direction (9-1-1). We will repeat the tests concerning the influence of the initial simplex size and rough resolution of flow problems for the richer parameterization. We follow two aimes: first, we want to check our conclusion from Section 6.3 and second, we will compare the behaviour of the optimization with richer parameterization to the coarser one. 6.4.1
Simplex size
As in the experiments for coarse parameterization, let us have two test-cases with the same starting point, one using small initial simplex (ǫ = 10−1 ), the other using large initial simplex (ǫ = 10+2 ). The parameters are given in Tab. 10. In Fig. 53 - 54 and in Tab. 11 we show the convergence history and the fitness results. The
INRIA
53
Multi-level free-form deformation for shape optimization
Figure 51: Convergence history (testcases E and F)
Mach field testcase E
Mach field testcase F
Root section
Tip section Figure 52: Testcases E and F
quality of the solutions is like in the testcases A and B corresponding for coarse parameterization (see Fig. 45 - 46) but we note here that the number of iterations for the degree 9-1-1, fine
RR no 5019
54
Andreoli & Janka & D´esid´eri
Testcase G Testcase H
degree 9-1-1 9-1-1
res 10−6 10−6
ǫ 10−1 10+2
Table 10: Testcases G and H parameters parameterization, is double. The two-time slower convergence in this test-case hints the stiffness of the optimization problem with respect to the number of prameters increasing. In Fig. 55 there are the comparisons between the Mach field and the root and tip sections. In this case, like for degree 6-1-1, we can say that the choice of the initial simplex size ǫ is important for the result. Like for coarse parameterization, the difference of best fitnesses of optimal shapes given by the two simplex algorithms is rather substantial - about 30% of the original drag. This time, however, for the large simplex we did not have to use simplex shrinking which would result in a massive resizing and reevaluation of the whole simplex, like it has been noticed in Fig. 46 (40th iteration).
Figure 53: Convergence history (testcase G) - small simplex
Original Testcase G Testcase H
CL 0.3192007875 0.3261269982 0.3190795710
CD 0.0263532471 0.0187096749 0.0130757173
Fitness 1 0.709957104 0.496170934
Variation -29.01% -50.4%
Table 11: Testcases G and H results: small vs. large initial simplex
6.4.2
Non liner flow residual
Let us, also in this case, test the influence of non-exact solution of the flow problem at the convergence and quality of the results. First, take large initial simplex. The specifications of the testcases is in Tab. 12.
INRIA
55
Multi-level free-form deformation for shape optimization
Figure 54: Convergence history (testcase H) - large simplex
Testcase I Testcase L
degree 9-1-1 9-1-1
ǫ 10+2 10+2
res 10−3 10−6
Table 12: Testcases I and L parameters Fig. 56 and Tab. 14 show the convergence history and the fitness results. It seems, that in both cases, the simplex algorithm was able to attain similar fitness. We can see the difference in computational time in Fig. 57. By using the inexact solver of the flow problem we have gained 50% of the CPU time. In Fig. 58 we plot the Mach field and the root and tip sections for the two testcases. From all the results obtained so far by lowering the non linear flow residual, it seems that if we are interested only in a qualitative solution and we want to save time, we can solve our optimization with an inferior flow residual. This statement is not always true, however. A counter-example follows by using small initial simplex, see specification in Tab. 13.
Testcase M Testcase N
degree 9-1-1 9-1-1
ǫ 10−1 10−1
res 10−3 10−6
Table 13: Testcases M and N parameters We can see in Fig. 59 - 60 that the two solutions in this case are very different. In particular, the testcase M shows a very small gain in fitness (see Tab. 15). It seems that by reducing the precision of the flow solver we have lowered the threshold with which the flow solver is capable to distinguish two slightly different shapes. This, together with the fact that we start with a small simplex, ie. precisely with very small shape variations to choose from, results in a complete stagnation of the convergence. However, if the threshold sensitivity of the flow solver matches the simplex size, the optimization with an approximate flow solver tends to give qualitatively good results two times more rapidely than with the precise flow resolution.
RR no 5019
56
Andreoli & Janka & D´esid´eri
Mach field testcase G
Mach field testcase H
Root section
Tip section
Figure 55: Testcases G and H: small vs. large initial simplex
Original Testcase I Testcase L
CL 0.3192007875 0.3194382263 0.3190795710
CD 0.0263532471 0.0133210986 0.0130757173
Fitness 1 0.505467458 0.496170934
Variation -49.5% -50.4%
Table 14: Testcases I and L results: precise vs. rough flow resolution for large simplex.
INRIA
57
Multi-level free-form deformation for shape optimization
Figure 56: Convergence history (testcases I and L): precise vs. rough flow resolution for large simplex.
Figure 57: Computational time (testcases I and L)
Original Testcase M Testcase N
CL 0.3192007875 0.3188905806 0.3261269982
CD 0.0263532471 0.0261525242 0.0187096749
Fitness 1 0.992354335 0.709957104
Variation -0.8% -29.01%
Table 15: Testcases M and N results: precise vs. rough flow resolution for small simplex.
6.5
Simplex method with degree elevation
After some preliminary tests with the simplex method, we have noticed that the optimization problem converges almost two times less rapidly for parameterization of degree 9-1-1 than with the parameterization 6-1-1.
RR no 5019
58
Andreoli & Janka & D´esid´eri
Mach field testcase I
Mach field testcase L
Root section
Tip section
Figure 58: Testcases I and L: precise vs. rough flow resolution for large simplex. Now, we are about to testign the following idea: by successive enriching of the parametric space, we could start with a low-degree parameterization to speedup the convergence, but during the optimization process, we could switch to higher-degrees of parameterizations until the target refinement is attained. The key in the successive refinement process is not to lose information gained in the precedent steps. Therefore, we use the degree-elevation property of B´ezier parameterization , which assures that shapes are represented exactly by the parameterization enriching. To respect our constraints on planform preserving and no-double curvature, we are applying, in 4 steps, the degree elevation just in x-direction (chordwise), obtaining successively degrees 6-1-1, 7-1-1, 8-1-1 and 9-1-1, which is our target space. In the following two Scetions, we are making some numerical tests and comparisons of such an hierarchical optimization with a degree 9-1-1 only optimization. Also, we try to gain some experience on how the simplex vertices should be treated during the degree-elevation. Indeed, as we pass from a coarse parameterization with parameters from Rn1 to a richer parameterization with parameters from Rn2 , n2 > n1 , our n1 + 1-simplex should
INRIA
59
Multi-level free-form deformation for shape optimization
Figure 59: Convergence history (testcases M and N): precise vs. rough flow resolution for small simplex.
Mach field testcase M
Mach field testcase N
Root section
Tip section
Figure 60: Testcases M and N: precise vs. rough flow resolution for small simplex.
RR no 5019
60
Andreoli & Janka & D´esid´eri
be mapped to a n2 + 1-simplex with more vertices. Two issues need to be treated: we do not want to loose information already gained in the optimization process and we need to assure the non-degenerescence of the new simplex in order to better explore all Rn2 . In this respect, we are going to try two strategies for degree elevation of a simplex: either just the best individual will be elevated and then a new simplex will be created by an ǫ-perturbation of this individual, or the whole simplex will be elevated and just the complementary vertices will be obtained by perturbation.
6-1-1
7-1-1
8-1-1
9-1-1 Figure 61: Degree elevation
6.5.1
Testcase 1: degree elevation for small simplex.
First of all, let us try the degree elevation strategy for a small simplex. Let us start with 250 simplex iteration for the coarse parameterization (degree 6-1-1). Then, we elevate the best individual/vertex and set up a new simplex of size ǫ (simplex diameter) by perturbation of the best individual using parameterization of degree 7-1-1. After another 250 simplex iterations we elevate the degree to 8-1-1 and, still after another 250 iterations, we finish with degree 9-1-1. Let us compare convergence histories, convergence speed and quality of the solution for two tests with a different flow solver precision (non-linear flow residual). The test-case parameters are displayed in Tab. 16, the symbol 6 → 9 means that parameterization has been progressively enriched from 6-1-1 to 9-1-1 by one degree at a time.
1A 1B
degree 6→9 6→9
ǫ 10−1 10−1
res 10−3 10−6
Table 16: Testcase 1
INRIA
61
Multi-level free-form deformation for shape optimization
In Fig.62 we can see the convergence history and the CPU-time for these two cases. We see, that the experiment with the more precise solver has found by about 7% better solution. The differences in CL , CD and fitness can be seen in Tab. 17. Root and tip sections and the Mach field distributions are shown in Fig. 63. By using just an approximative flow solver, we have saved almost 50% of the CPU-time and the obtained solution is qualitatively similar to the one obtained by a precise solver.
Original 1A 1B
CL 0.3192007875 0.3582733176 0.3191661183
CD 0.0263532471 0.0178659400 0.0160547968
Fitness 1 0.677920912 0.609215129
Variation -32.2% -39.1%
Table 17: Testcase 1
All individuals
Computational time
Figure 62: Degree elevation convergence history: small simplex precise vs. rough flow solver.
6.5.2
Testcase 2: degree elevation of best vs. all simplex vertices.
As we have remarked in the introduction of this section, the key question with degree elevation is how to keep already gained information and, at the same time, do not degenerate the search into only a subspace of the new parameterization. Here, we design a test-case which should reveal the influences on the choice of the degree-elevation strategy: taking the simplex method with large initial simplex (ǫ = 10+2) and degree 6-1-1 parameterization, we do 250 simplex iterations and then elevate to 7-1-1. For one optimization we elevate only the best vertex/individual and re-create a new simplex by perturbations with ǫ = 10+2 around the best individual (test 2A). For the other optimization we elevate all simplex vertices and complement them with the perturbations (ǫ = 10+2) around the best individual (test 2B). Then we perform, for both algorithms, another 250 iterations of simplex method and repeat the degree elevation to get degree 8-1-1. We repeat this process until the final 250 iterations are in degree 9-1-1 parametric space, see Fig. 64. The test-case parameter are summarized in Tab. 18. In Tab. 19 and in Fig. 65 we can see that the two solutions are very similar in fitness but not in the shape.
RR no 5019
62
Andreoli & Janka & D´esid´eri
Mach field testcase 1A
Mach field testcase 1B
Root section
Tip section Figure 63: Testcases 1 (A and B) degree 6→9 6→9
2A 2B
ǫ 10+2 10+2
res 10−6 10−6
Table 18: Testcase 2 It seems that the choice for the elevation is not very important in the convergence speed
Original 2A 2B
CL 0.3192007875 0.3188849846 0.3194768778
CD 0.0263532471 0.0125971202 0.0125152769
Fitness 1 0.478010097 0.474904470
Variation -52.2% -52.5%
Table 19: Testcase 2 and in the quality of the solution, measured by the fitness. The optimum shapes however, are different, see Fig. 65.
INRIA
63
Multi-level free-form deformation for shape optimization
Figure 64: Convergence history (testcase 2)
Mach field testcase 2A
Mach field testcase 2B
Root section
Tip section
Figure 65: Testcases 2 (A and B): degree elevation, best vs. all.
RR no 5019
64
6.6
Andreoli & Janka & D´esid´eri
Parameterization enriching vs. finest parameterization only.
In the elevation process, we successively enrich the parametric space starting from a coarse parameterization going towards the finest one. Hence, the reults could be compared to an optimization process using the finest parameterization only (fixed degree). It is interesting to see if we are able to improve the quality of the solution or we are able to have the same fitness with less iterations (in less CPU-time). We remember here that, in general, if we have the same fitness from two tests, the shape of the wing can be different. Let us compare the already presented test-cases from a different prospective. The test-case G and 1B, for small simplex, are of interest, we recapitulate their parameters in Tab. 20. G 1B
degree 9-1-1 6→9
ǫ 10−1 10−1
res 10−6 10−6
Table 20: Testcases G vs. 1B A comparison of the results can be seen in Tab. 21. The convergence is shown in Fig. 66. Original Testcase G Testcase 1B
CL 0.3192006583 0.3261269982 0.3191661183
CD 0.0263540181 0.0187096749 0.0160547968
Fitness 1 0.709957104 0.609215129
Variation -29.01% -39.1%
Table 21: Testcase G vs. 1B results We observe that the elevation process works well in this case. We have attained optimal shape of better quality (lower fitness) and the speed of convergence is faster. In Fig. 67 we can see also that the two solutions are qualitatively very similar.
Figure 66: Convergence history: degree elevation vs. one finest parameterization, small simplex
6.6.1
Large simplex
Another interesting comparison is between the testcase 2 of Section 6.5.2 and the testcase L, for large initial simplex. Their parameters are recapitulated in Tab. 22. Here we are comparing
INRIA
65
Multi-level free-form deformation for shape optimization
Mach field testcase G
Mach field testcase 1B
Root section
Tip section
Figure 67: Degree elevation vs. finest parameterization: small simplex. a degree-elevation testcase 2 with a test-case L using just degree 9-1-1 parameterization during the whole optimization.
L 2A 2B
degree 9-1-1 6→9 6→9
ǫ 10+2 10+2 10+2
res 10−6 10−6 10−6
Table 22: Testcases L vs. 2 The results can be seen in Tab. 23 and in Figs. 68 - 69. Also for this test, the speed of convergence is higher with the elevation process. The quality of the solution is slightly better with the elevation test. The results tend to confirm our perception about the stiffness of the optimization process. It seems, that the more parameters we have, the better quality of the optimal shape we can attain, but also the slower of the convergence of the optimization process. Our degree-elevation seems to work more rapidly, because of its superior convergence speed at the beginning of the optimization where it operates only in coarse parametric space.
RR no 5019
66
Andreoli & Janka & D´esid´eri
Original L 2A 2B
CL 0.3192007875 0.3190795710 0.3188849846 0.3194768778
CD 0.0263532471 0.0130757173 0.0125971202 0.0125152769
Fitness 1 0.496170934 0.478010097 0.474904470
Variation -50.4% -52.2% -52.5%
Table 23: Testcase L vs. 2 results
Figure 68: Convergence history: degree elevation vs. finest parameterization, large simplex
6.7
Summary and conclusions for simplex experiments
Let us recapitulate the set-up parameters and results for all the tests performed in this Section, see Tab. 24. We have seen during all the tests, that the choice of the initial simplex size ǫ seems to be crucial. We suppose that the larger simplices have the potential to overcome local minima, as described in Section 6.3.1. However, more tests for different cost functionals (with for example volume-preserving constraints) should be performed to support our hypothesis. The non linear flow residual results drive us to say that if we are interested only in a qualitative solution, we can save up to 50% CPU-time using just a weak resolution of the flow problem. The residual is strictly correlated with the parameterization degree and the size of the simplex. A small control point displacement for high-degree parameterization creates a perturbation that only an accurate flow solution can recognize/distinguish. The choice of the degree, as we can see by comparing Figs. 45-46 and Figs. 53-54, has an influence on the number of iterations. Higher degree results in more parameters to optimize. We remark that even if the fitness from two different tests is almost the same, it does not mean that the shape of the two wings is the same. This should follow from a uniqueness result for the optima, which is not disponible. In Figs. 70-71 there are the differences between the original wing and the best one obtained with simplex method (test-case 2B). On the left column we have the pressure isolines plot for three different sections (root, mid-section and tip) in spanwise direction and on the right column the Cp distribution.
INRIA
67
Multi-level free-form deformation for shape optimization
Mach field testcase L
Mach field testcase 2A
Mach field testcase 2B
Root section
Tip section
Figure 69: Degree elevation vs. finest parameterization: large simplex.
RR no 5019
68
Andreoli & Janka & D´esid´eri
Testcase Orig A B C D E F G H I L M N 1A 1B 2A 2B
degree 6-1-1 6-1-1 6-1-1 6-1-1 6-1-1 6-1-1 9-1-1 9-1-1 9-1-1 9-1-1 9-1-1 9-1-1 6→9 6→9 6→9 6→9
res 10−6 10−6 10−6 10−3 10−6 10−3 10−6 10−6 10−6 10−3 10−6 10−3 10−6 10−3 10−6 10−6 10−6
ǫ 10−1 10+2 10+2 10+2 10−1 10−1 10−1 10+2 10+2 10+2 10−1 10−1 10−1 10−1 10+2 10+2
CL 0.3192007875 0.3189389963 0.3188854856 0.3190279479 0.3188854856 0.3269697856 0.3189389963 0.3261269982 0.3190795710 0.3194382263 0.3190795710 0.3188905806 0.3261269982 0.3582733176 0.3191661183 0.3188849846 0.3194768778
CD 0.0263532471 0.0191390335 0.0129805887 0.0130044710 0.0129805887 0.0198700887 0.0191390335 0.0187096749 0.0130757173 0.0133210986 0.0130757173 0.0261525242 0.0187096749 0.0178659400 0.0160547968 0.0125971202 0.0125152769
Variation -27.4% -50.8% -50.7% -50.8% -24.6% -27.4% -29.01% -50.4% -49.5% -50.4% -0.8% -29.01% -32.2% -39.1% -52.2% -52.5%
Table 24: Summary results
INRIA
Multi-level free-form deformation for shape optimization
Figure 70: Original Wing
RR no 5019
69
Andreoli & Janka & D´esid´eri
70
Figure 71: Optimized Wing
INRIA
Multi-level free-form deformation for shape optimization
71
Genetic Algorithms Genetic Algorithms are very robust optimization algorithms. They are very well suited for problems in which the initialization is not intuitive, the minimized cost function may present several local minima. Moreover, they give as a result not only one, but a whole class of potential candidates for optimal shape and they permit to take into account several different minimization criteria. As seen in Chapter 4, they are different from classical optimization procedures (e.g. gradient methods or simplex methods) in many ways: • they work with a coding of the parameter set and not the parameters themselves • they work simultaneously with a class/population of individuals/shapes • they use probabilistic rules (the genetic operators are applied with probabilities) • they do not work with only one shape and some information about local behaviour of the fitness around this shape (gradient information or descent direction), they use the information of all the population to make global choice of optimum.
6.8
Set-up parameters for genetic algorithm
As seen in Section 4.6, in the set-up for genetic algorithms there are a lot of parameters to specify. In all our tests we will work everytime with these parameters and options: - popsize : 40 - pcross : 0.85 - pmutat : 5 · 10−3 - selecttype : roulette - crosstype : 2-point crossover The maximal number of generations maxgen is not fixed and it depends from the test that we choose to run. The genetic algorithms being extremely costly, the presented test-cases are stopped well before a good convergence has been achieved. Unlike the simplex method, where we search the parameters in a space of real numbers, with our genetic algorithm with binary coding, we use a fix-point representation of doubles in some interval, called further Genetic Range, with some precision. Of course, the more precise our coding is, or the larger Genetic Range, the more bits are needed for the encoding of the chromosome.
6.9
Genetic Range
We will show in this paragraph two different choices of the range. It is obvious, that the global optimum might not be within the genetic range. Hence, the a-priori choice of the genetic range is important. Let us compare two optimizations which differ only in the range, while the length of the binary chromosome is about the same, • Testcase GA1: see Table 25; • Testcase GA2: see Table 26.
RR no 5019
72
Andreoli & Janka & D´esid´eri
The common parameters for the two test-cases are: • parameterization degree: 6-1-1 • maximum number of GA generations: maxgen=100 • flow solver precision: 10−3 In the two Tables 25 - 26 the control points are numbered according to our convention i-j-k in x, y and z-directions and the displacements in y-direction (minimum and maximum) are in millimeters [mm]. As already said, we move the control points only in y-direction. We can see in Figs. 72 - 73 the convergence history of the genetic algorithm. On the x-axis we plot the number of generations. Each of the dots on the plot correspond to one shape evaluated in the Euler solver, whose fitness is given on the y-axis. In Table 27 and in Fig. 74 we can see the best results and shapes obtained with the two choices. The two results are quite different. Also, we can see in Fig. 73 that after 100 generations, the convergence is still not stagnating, as it is in Fig. 72. Therefore, it is probable that the best solution is not the one shown in Fig. 74.
Figure 72: Convergence history (Testcase GA1)
Figure 73: Convergence history (Testcase GA2)
INRIA
73
Multi-level free-form deformation for shape optimization
Control points (i,j,k) 000 100 200 300 400 500 600 010 110 210 310 410 510 610 001 101 201 301 401 501 601 011 111 211 311 411 511 611
min (dY) 0 -25.6 -25.6 -25.6 -25.6 -25.6 0 0 -25.6 -25.6 -25.6 -25.6 -25.6 0 0 -25.6 -25.6 -25.6 -25.6 -25.6 0 0 -25.6 -25.6 -25.6 -25.6 -25.6 0
max (dY) 0 25.6 25.6 25.6 25.6 25.6 0 0 25.6 25.6 25.6 25.6 25.6 0 0 25.6 25.6 25.6 25.6 25.6 0 0 25.6 25.6 25.6 25.6 25.6 0
accuracy (dY) 0.1 0.1 0.1 0.1 0.1 0.1 0.1 0.1 0.1 0.1 0.1 0.1 0.1 0.1 0.1 0.1 0.1 0.1 0.1 0.1 0.1 0.1 0.1 0.1 0.1 0.1 0.1 0.1
Table 25: Testcase GA1: 6-1-1 control points displacement limits and precision in y-direction
RR no 5019
74
Andreoli & Janka & D´esid´eri
Control points (i,j,k) 000 100 200 300 400 500 600 010 110 210 310 410 510 610 001 101 201 301 401 501 601 011 111 211 311 411 511 611
min (dY) 0 -15.6 -25.6 -25.6 -25.6 -25.6 0 0 55.6 -25.6 -15.6 -15.6 -25.6 0 0 -25.6 -25.6 -25.6 -25.6 -45.6 0 0 -75.6 -25.6 -25.6 5.6 -15.6 0
max (dY) 0 35.6 25.6 25.6 25.6 25.6 0 0 105.6 25.6 35.6 35.6 25.6 0 0 25.6 25.6 25.6 25.6 5.6 0 0 -25.6 25.6 25.6 55.6 35.6 0
accuracy (dY) 0.1 0.1 0.1 0.1 0.1 0.1 0.1 0.1 0.1 0.1 0.1 0.1 0.1 0.1 0.1 0.1 0.1 0.1 0.1 0.1 0.1 0.1 0.1 0.1 0.1 0.1 0.1 0.1
Table 26: Testcase GA2: 6-1-1 control points displacement limits and precision in y-direction
INRIA
75
Multi-level free-form deformation for shape optimization
Original Testcase GA1 Testcase GA2
CL 0.3192006583 0.3190283345 0.3218896909
CD 0.0263540181 0.0204432070 0.0226687454
Fitness 1 0.775714988 0.860162770
Variation -22.5% -14.0%
Table 27: Testcase GA1 and GA2 results
Mach field testcase GA1
Mach field testcase GA2
Root section
Tip section
Figure 74: Testcases GA1 and GA2: different Genetic Range
6.10
Genetic algorithm with degree Elevation
It is interesting to see how the degree elevation process works with the genetic algorithms. In this test we will apply the elevation only for the best individual, while the rest of generation is re-set by random perturbation. The parameters that we choose for this test-case (GA3) are: • degree : 6-1-1 → 9-1-1
RR no 5019
76
Andreoli & Janka & D´esid´eri
• number of generations with one fixed degree: 50 • flow solver precision: 10−3 The Genetic Range is the same of the testcase GA1 and can be seen in Tab. 25. The results are shown in Figs. 75 - 76 and in the Tab. 28. In the left plot of Fig. 75 we see how the fitness of all individuals has been affected by the
Figure 75: Convergence history (Testcase GA3)
Original Testcase GA3
CL 0.3192006583 0.3191186977
CD 0.0263540181 0.0193579220
Fitness 1 0.734533986
Variation -26.5%
Table 28: Testcase GA3 results degree elevation process after each 50 generations. The peeks in fitness correspond to the randomly perturbed individuals after the elevation. Nevertheless, we see that the overall mean convergence rate, represented as an envelope of best individuals (Fig. 75 right) is not influenced by the random re-initializations after each elevation. 6.10.1
Non linear flow residual
We want to see if the choice of the non linear flow residual is important for the solution or not. For time reasons, we choose to apply the elevation after 30 generations. The Genetic Range can be seen in Tab. 25. The set-up parameters are summarized in Tab. 29.
Testcase GA4 Testcase GA5
res 10−3 10−6
maxgen 120 120
Table 29: Testcases GA4 and GA5 parameters The results are shown in Figs. 77 - 78 and in the Tab. 30. The tests were done on a 1 CPU machine PC Pentium 4 at 2.2 GHz, the test-case GA4 with areduced precision of the flow solver has taken about 10 days, while the test-case GA5 with a good flow-resolutions took
INRIA
77
Multi-level free-form deformation for shape optimization
Mach field testcase GA3
Tip section
Root section Figure 76: Testcases GA3
26 days. As we are using populations of 40 individuals and as the genetic algorithm offers quite a straightforward parallelization without excessive overheads, we might expect, that on a 40 processor parallel machine the test-cases GA4 and GA5 take about 6 hours and 16 hours, respectively. If we change the non linear flow residual, the two solutions are qualitatively similar. It is the same result that we have seen in the simplex method.
Original Testcase GA4 Testcase GA5
CL 0.3192006583 0.3200005560 0.3230559605
CD 0.0263540181 0.0195637896 0.0194338124
Fitness 1 0.742345601 0.737435213
Variation -25.8% -26.3%
Table 30: Testcase GA4 and GA5 results
6.11
Degree elevation vs. fine parameterization only
Like for the simplex method, let us compare one optimization with successively enriched parameterization by degree elevation with an optimization using only the finest parameterization.
RR no 5019
78
Andreoli & Janka & D´esid´eri
Convergence history
CPU time
Figure 77: Convergence history (testcases GA4 and GA5) and CPU time
Mach field testcase GA4
Root section
Root section
Tip section
Figure 78: Testcases GA4 and GA5
INRIA
79
Multi-level free-form deformation for shape optimization
The parameters set-up is summarized in Tab. 31. The degree elevation is applied every 30 generations. Testcase GA4 Testcase GA6
degree 6→ 9 9-1-1
res 10−3 10−3
maxgen 120 100
Table 31: Testcase GA6 parameters
Figure 79: Convergence history (GA4 and GA6) We can see the convergence history and the results in Fig. 79-80 and in Tab. 32. Original Testcase GA4 Testcase GA6
CL 0.3192006583 0.3200005560 0.3263465147
CD 0.0263540181 0.0195637896 0.0186838363
Fitness 1 0.742345601 0.708955888
Variation -25.8% -29.1%
Table 32: Testcase GA4 and GA5 results A comparison between the degree-elevation strategy and one finest parameterization is difficult to do. While in the first case the speed of convergence is faster, in the second one we are able to find a better solution. One problem should be our choice for the elevation strategy. We have chosen to apply the elevation only for the best individual while the rest of the generation is re-initialized. We can observe what happens choosing a different approach. After some iterations of coarse parameterization we elevate all the individuals for the new degree. A summary of the comparison between the two choices is presented in Tab. 33. The elevation of degree is done every 30 generations. In Fig. 81 and in Tab. 34 we show the convergence history and the fitness results. The different approaches for the elevation strategy have given two diffent results. However, it is still not clear how we can transfer information from one level to another using genetic algorithms. While in one case, test-case GA4, we are losing genetic information but gaining in
RR no 5019
80
Andreoli & Janka & D´esid´eri
Mach field testcase GA4
Mach field testcase GA6
Root section
Tip section
Figure 80: Testcases GA4 and GA6
Testcase GA4 (best) Testcase GA7 (all)
res 10−3 10−3
maxgen 120 120
Table 33: Testcase GA7 parameters
Original Testcase GA4 (best) Testcase GA7 (all)
CL 0.3192006583 0.3200005560 0.3236557100
CD 0.0263540181 0.0195637896 0.0204623210
Fitness 1 0.742345601 0.776441981
Variation -25.8% -22.4%
Table 34: Testcase GA4 and GA7 results search versatility, in the other case, test-case GA7, we are doing the contrary. The results are not giving us a clear indication of the behaviour for a multi-level approach. At the same time, the comparison between the degree-elevation process and the finest parameterization of Fig. 79 is not explanatory.
INRIA
81
Multi-level free-form deformation for shape optimization
Figure 81: Convergence history (GA4 and GA7)
6.12
Summary and conclusions for GAs experiments
Let us recapitulate the set-up parameters and results for all the tests performed in this Section in Tab. 35. Testcase Orig GA1 GA2 GA3 GA4 GA5 GA6 GA7
degree 6-1-1 6-1-1 6→9 6→9 6→9 9-1-1 6→9
res 10−6 10−3 10−3 10−3 10−3 10−6 10−3 10−3
gen’s 100 100 200 120 120 100 120
range Tab. Tab. Tab. Tab. Tab. Tab. Tab.
25 26 25 25 25 25 25
CL 0.3192007875 0.3190283345 0.3218896909 0.3191186977 0.3200005560 0.3230559605 0.3263465147 0.3236557100
CD 0.0263532471 0.0204432070 0.0226687454 0.0193579220 0.0195637896 0.0194338124 0.0186838363 0.0204623210
Variation -22.5% -14.0% -26.5% -25.8% -26.3% -29.1% -22.4%
Table 35: GAs results During all the tests, we have tried to gain some experience with the Genetic Algorithms. The choice of the correct set-up parameters seems fundamental. We have seen, for example with test-cases GA1 and GA2, that a different Genetic Range has an influence not only on the quality of the solution but also in the convergence speed even if the length of the chromosome is about the same. At this time, however, it is not clear how to choose the correct set-up parameters. The convergence speed is strictly correlated with the size of the population in every generations. The genetic algorithm has more chance to find a good optimal solution if its search space is bigger. However, we are also very limited by the CPU-time. At this time, we cannot conclude about the advantages and limits for a multilevel approach using genetic algorithms. More tests should give a better understanding of the degree-elevation process. However, the power of Genetic Algorithm is the possibility to search a trade-off optimum with respect to several criteria by Nash games or Pareto fronts. In all the tests, we have seen
RR no 5019
82
Andreoli & Janka & D´esid´eri
an optimization using a cost function with only one constraint (to keep lift). In Aerodynamics, more constraints can be applied (e.g. volume preserving, thickness, momentum coefficient, lift distribution in span-wise direction, twist and other) and the ability of genetic algorithms to implement a multi-point optimization will become necessary (e.g. subsonic regime, transonic regime, landing, take-off and other). Genetic Algorithms are one of the unique algorithms able to solve multi-objective and multi-point optimization problems (Pareto front, Nash game) in a very trasparent way.
7
Conclusions and perspectives
This work has been intended to give preliminary experiments and bring up some interesting questions about hierarchical parametrizations for 3D aerodynamic bodies. We were particularly interested in testing Bezier parametrization and free-form deformation, and verifying that a multi-level approach improves the convergence rate of optimization algorithms. To this point, we have implemented to an existing Euler solver the parametrization and elevation routines and the whole external loop of generic optimization algorithms, either by simplex method or by genetic algorithm. Thus, we have created a new optimization package capable to deal with fairly general 3D geometries. The code will be used for future developments by the OPALE team, besides other things, in the framework of the Supersonic contract with the French government and in technical collaboration with Piaggio Aero Industries. It appears, based on our experiments with the simplex method, that the multi-level approach in this framework might be of interest, helping to unlock the stiff optimization problem. Our tests with genetic algorithm are not so conclusive. Nevertheless, they bring up some questions about the optimal way of transfer of genetic information at the elevation process. The future work should concentrate on the implementation of a trully multigrid-like hierarchical optimization, with not only successive enriching of parametrization, but also with parametrization coarsening. The idea is to decouple, by the means of the hierarchical parametrization, the high and low frequencies of shape deformation and treat them quasi-separately, the coupling between them being reduced to repeatedly performed degree elevation and degree reduction processes. Also, the high CPU-cost of the genetic algorithm is an obstacle to a successful use of genetic optimization in an engineering design loop. With this respect, we propose as a necessary step, to either hybridize genetic algorithm [36] to speed up its convergence, or to use interpolation techniques [2], reduced model for flow problem [15] or neural networks [18].
INRIA
Multi-level free-form deformation for shape optimization
83
References [1] Coquillart, S. Extended free form deformation: a sculptural tool for 3D geometric modelling, SIGGRAPH 24,4 (1990), pp. 187–196. [2] Berard, Y. and Habbal, A: Algorithmes g´en´etiques perturb´es par le gradient, to appear as INRIA Research Report. [3] Darwin, C. On the origin of species by means of natural selection, London, John Murray, 1859 [1st edn.]. [4] Dolean, V. and Lanteri, S.: A domain decomposition approach to finite volume solutions of the Euler equations on triangular meshes, INRIA Research Report 3751, August 1999. [5] Duvigneau, R.: Contribution `a l’optimisation de forme pour des ´ecoulements `a forts nombres de Reynolds autour de g´eom´etries complexes, Th`ese de Doctorat, Octobre 2002, Ecole Centrale de Nantes. [6] Farhat, C., Degand, C., Koobus, B., Lesoinne, M.: Torsional springs for two-dimensional dynamic unstructured fluid meshes, Comput. Methods Appl. Mech. Engrg. 163 (1998), pp. 231–245. [7] Farhat, C., Degand, C.: A three-dimensional torsional springs analogy method for unstructured dynamic meshes, Computer and Structures 80 (2002) 305–316. [8] Fezoui, L. and Stoufflet, B.: A class of implicit upwind schemes for Euler simulations with unstructured meshes, J. of Comp. Phys., 84 (1989), pp. 174–206. [9] Fisher, CF. and Arena, AS. On the Transpiration Method for Efficient Aeroelastic Analysis Using an Euler Solver, AIAA 96-3436, American Institute of Aeronautics and Astronautics, 1996. [10] George, PL. and Frey, PJ.: Maillages applications aux ´el´ements finis, Hermes,1999. [11] George, PL. and Borouchaki, H.: Triangulation de Delaunay et maillage, Hermes,1997. [12] Hadamard, J.: Leon sur le calcul des variations, Gauthier Villars, 1910. [13] Haug, EJ. and C´ea, J.:Optimization of distributed parameter structures, vol 1 and 2, Sitjhoff and Noordhoff, 1981. [14] Huffman, W.; Melvin, R.; Young, D.; Johnson, J.; Bussoletti, J.; Bieterman, M. and Hilmes, C.: Practical Design and Optimization in Computational Fluid Dynamics, AIAA Paper 93-3111, 1993. [15] Iollo, A.; Lanteri, S.; D´esid´eri, JA.: Stability Properties of POD-Galerkin Approximations for the Compressible Navier-Stokes Equations, INRIA Research Report no. 3589, December 1998. [16] Jameson, A.: Optimal Shape Design for Aerodynamics, in Optimum Design methods for Aerodynamics, AGARD Report 803, J. Periaux, Special Course Director at the VKI, Rhode Saint-Gense, Belgium, 25-29 april 1994. [17] Jameson, A.: Optimum Aerodynamic Design via Boundary Control, AGARD Report 803, VKI Lectures, 1994.
RR no 5019
84
Andreoli & Janka & D´esid´eri
[18] Karakis, M.; D´esid´eri, JA.: Model Reduction and Adaption of Optimum-shape design in aerodynamics by Neural Networks, INRIA research Report no. 4503, July 2002. [19] Kuiper, H.; van der Wees, A.J.; Hendriks, C.F., Labrujere, T.E.: Application of genetic algorithms to the design of airfoil pressure distribution, NLR Technical publication TP95342L for the ECARP European Project. [20] Labrujere, T.: Residual-Correction Type and Related Computational Methods for Aerodynamics, AGARD Report 803, J. Periaux, Special Course Director at the VKI, Rhode Saint-Gense, Belgium, 25-29 april 1994. [21] Lagarias, J.; Reeds, J.; Wright, M.: Convergence properties of the Nelder-Mead algorithm in low dimensions, SIAM Journal on Optimization 9 (1998), pp.112–147. [22] Lamousin, H. and Waggenspack, W.: NURBS-Based Free-Form Deformation, IEEE Computer Graphics and Applications, Vol.14, No.6, 1994, pp. 1–9. [23] Lewis, R.; Torczon, V. and Trosset, M.: Direct search methods: Then and now, ICASE Report, 2000. [24] Lighthill, M.J.: A new method of two-dimensional aerodynamics design, R&M1111, Aeronautical Research Council, 1945. [25] Lighthill, M.J.: On Displacement Thickness, Journal of Fluid Mechanics 4, 1958, pp.383– 392. [26] Lions, J.L.: Optimal control of system governed by PDEs, Springer Verlag, New York, 1971. [27] Marco, N. and Dervieux, A.: Multilevel Parametrization for Aerodynamical Optimization of 3D Shapes, INRIA Research Report no. 2949, July 1996. [28] Marco, N., and D´esid´eri, J.A.: Numerical solution of optimization test-case by Genetic Algorithms, INRIA Research Report no. 3622, February 1999. [29] Marco, N., D´esid´eri, J.A. and Lanteri, S.: Multi-Objective Optimization in CFD by Genetic Algorithms, INRIA Research Report no. 3686, April 1999. [30] Marco, N.; Lanteri, S.: A Two-Level Parallelization Strategy for Genetic Algorithms Applied to Shape Optimum Design, INRIA Research Report no. 3463, July 1998. [31] Marocco, A.: Simulations Num´eriques dans la Fabrication des Circuits `a Semiconducteurs, INRIA Research Report no. 0305. [32] Mohammadi, B.; Pironneau, O.: Applied Shape Optimization for Fluids, Clanderon Press, Oxford, 2001. [33] M¨ uhlenbein, H.; Schomisch, D. and Bord, J.: The Parallel Genetic Algorithm as Function Optimizer, Parallel Computing 17 (1991), pp. 619–632. [34] Nelder, JA., Mead, R.: A simplex method for function minimization, Computer Journal 7 (1965), pp.308–313.
INRIA
Multi-level free-form deformation for shape optimization
85
[35] Obayashi, S.; Oyama, A.: Three dimensional aerodynamic optimization with genetic algorithms Third ECCOMAS Computational Fluid Dynamics Conference and Second ECCOMAS Conference on Numerical Methods in Engineering, volume Computational Fluid Dynamics ’96, John Wiley & Sons, 1996 pp. 420–424. [36] Oulladji, L.; Janka, A.;D´esid´eri, JA.; Dervieux, A.: Optimisation a´erodynamique par algorithmes g´en´etiques hybrides: application `a la r´eduction d’un crit`ere de bang sonique, INRIA Research Report no. 4884, July 2003. [37] P´eriaux, J.; Sefrioui, M.; Stoufflet, B.; Mantel, B.; Laporte, E.: Robust genetic algorithms for optimization problems in aerodynamic design, Genetic algorithms in engineering and computer science, John Wiley & Sons 1995, pp. 397–415. [38] Pironneau, O.: Optimal shape design for elliptic systems, Springer-Verlag, New York, 1984. [39] Powell, M.: Direct search algorithms for optimization calculations, Acta Numerica 7 (1998), pp. 287–336. [40] Quagliarella, D.: Genetic algorithms applications in computational fluid dynamics, Genetic algorithms in engineering and computer science, John Wiley & Sons, 1995 pp. 417–442. [41] Raj, P. and Harris, B.: Using Surface Traspiration with an Euler Method for Cost-effective Aerodynamic Analysis, AIAA 93-3506, American Institute of Aeronautics and Astronautics, 1993. [42] Roe, PL.: Approximate Riemann solvers, parameter vectors and difference scheme, J. of Comp. Phys., 43 (1981), pp.357–371. [43] Samareh, J.: A survey of shape parameterization techniques, CEAS AIAA ICASE NASA Langley International Forum on Aeroelasticity and Structural Dynamics, June 1999. [44] Sederberg, T. and Parry, S.: Free-Form Deformation of Solid Geometric Models, Computer Graphics 20, no. 4 (1986), pp. 151–160. [45] Spendley, W.; Hext, GR.; Himsworth, FR.: Sequential application of simplex designs in optimization and evolutionary operation, Technometrics 4 (1962), pp. 441–461. [46] Thompson, JF., Warsi, ZUA. and Mastin, CW.: Numerical Grid Generation, North Holland 1985, http://www.erc.msstate.edu/publications/gridbook. [47] T¨orn, A. and Zilinskas, A.: Global Optimization, Lecture Notes in Computer Science, no. 350, Springer-Verlag, Berlin, 1989. [48] Toro, EF.: Riemann Solvers and Numerical Methods for Fluid Dynamics, Springer 1997. [49] van Leer, B.: Towards the ultimate conservative differences scheme V : a second-order sequel to Godunov’s method J. of Comp. Phys., 32 (1979), pp. 361–370.
RR no 5019
Unit´e de recherche INRIA Sophia Antipolis 2004, route des Lucioles - BP 93 - 06902 Sophia Antipolis Cedex (France) Unit´e de recherche INRIA Futurs : Parc Club Orsay Universit´e - ZAC des Vignes 4, rue Jacques Monod - 91893 ORSAY Cedex (France) Unit´e de recherche INRIA Lorraine : LORIA, Technopˆole de Nancy-Brabois - Campus scientifique 615, rue du Jardin Botanique - BP 101 - 54602 Villers-l`es-Nancy Cedex (France) Unit´e de recherche INRIA Rennes : IRISA, Campus universitaire de Beaulieu - 35042 Rennes Cedex (France) Unit´e de recherche INRIA Rhˆone-Alpes : 655, avenue de l’Europe - 38334 Montbonnot Saint-Ismier (France) Unit´e de recherche INRIA Rocquencourt : Domaine de Voluceau - Rocquencourt - BP 105 - 78153 Le Chesnay Cedex (France)
´ Editeur INRIA - Domaine de Voluceau - Rocquencourt, BP 105 - 78153 Le Chesnay Cedex (France)
http://www.inria.fr ISSN 0249-6399