It appears certain that informatics will continue to be a major factor in the success of molecular ...... melanoma-reactive CD4+ T cells', Cancer Research. 60(17) ...
From Informatics to Bioinformatics Vladimir B. Bajic
Vladimir Brusic
Jinyan Li
See-Kiong Ng
Limsoon Wong
Laboratories for Information Technology 21 Heng Mui Keng Terrace, Singapore 119613 Email: bajicv, vladimir, jinyan, skng, limsoon @lit.a-star.edu.sg �
Abstract Informatics has helped in launching molecular biology into the genomic era. It appears certain that informatics will continue to be a major factor in the success of molecular biology in the post-genome era. In this paper, we describe advances made in data integration and data mining technologies that are relevant to molecular biology and biomedical sciences. In particular, we discuss some past and present research results on topics such as (a) the taming of autonomous heterogeneous distributed data sources, (b) the prediction of immunogenic peptides, (c) the discovery of gene structure features, (d) the classification of gene expression profiles, and (e) the extraction of protein interaction information from literature.
Keywords: Bioinformatics, data integration, data warehousing, Kleisli, epitope prediction, FIMM, transcription start site recognition, Dragon, gene expression analysis, PCL, protein interaction extraction, PIES. 1 Introduction Modern molecular biology and medical research involves an increasing amount of data, as well as an increasing variety of data. The use of informatics to organize, manage, and analyse these data has consequently become an important element of biology and medical research. Bioinformatics is the fusion of computing, mathematics, and biology to address this need. The effective deployment of bioinformatics requires the user to have a reasonable idea of the questions that he wants answers to. Then for each such question, bioinformatics can be used to first organize the relevant data and then to analyse these data to make predictions or to draw conclusions. In this paper, we consider two major themes in bioinformatics, viz. data management and knowledge discovery. Data management involves tasks such as integration of relevant data from various sources, transformation of the integrated data into more suitable forms for analysis, cleansing of data to avoid errors in analysis, etc. Knowledge discovery involves the construction of databases and the application of statistics and datamining algorithms to extract various information from these databases, such as prediction models for disease diagnosis. Both themes of bioinformatics rely on the effective adoption of techniques developed in computer science and mathematics for biological data. We describe a few of them in subsequent sections, using recent results obtained by us and our colleagues. In the beginning when bioinformatics was first started in Singapore in 1994, we worked on data integration technology; see Section 2. That required only extremely good computing science, but almost no biology. As we acquired slightly more biology background, we began constructing specialized high value-added databases for biologists. We focused then on immunology. We have thus entered the data cleansing and warehouse phase of our development; see Section 3.
Once we had sufficient amount of information in our immunology warehouse, which concentrated on the binding of peptide to MHC molecules, we constructed highly accurate models for predicting epitopes (or immunogenic peptides that bind MHC molecules); see Section 4. This of course required significantly more biology. By the end of that, around 2000, we completed our transition from informatics to bioinformatics. We then launched ourselves into a diversed number of projects dealing with many different aspects of bioinformatics knowledge discovery. Today, we have projects on extracting protein interactions from texts (Section 7), on recognizing gene features from genomic DNA sequences (Section 5), on analysing medical records and gene expression (Section 6), and on the study of toxins and ion channels. In the remaining sections of this paper, we describe some of these past and present results. 2 Data Integration Many questions that a biologist is interested in could not be answered using any single data source. However, some of these queries can be satisfactorily solved by using information from several sources. Unfortunately, this has proved to be quite difficult in practice. In fact, the US Department of Energy published a list of queries that they considered “impossible” to solve in 1993; see www.gdb.org/Dan/DOE/whitepaper/ contents.html. The interesting thing about these queries was that there was a conceptually straightforward answer to each of them using the databases in 1993. What made it “impossible” was that the databases needed were geographically distributed, were running on different computer systems with different capabilities, and had very different formats. An example of the US Department of Energys “impossible queries” is the following:
For each gene on a given cytogenetic band, find its non-human homologs. It required two databases, viz. GDB (Pearson, Matheson, Flescher & Robbins 1992) for information on which gene was on which cytogenetic band and Entrez for information on which gene was a homolog of which other genes. GDB was then located in Baltimore and was a Sybase relational database that supported SQL queries. Entrez (Schuler, Epstein, Ohkawa & Kans 1996) was then located in Bethesda and was to be accessed through an ASN.1 (ISO 1987) interface that supported simple keyword indexing. Kleisli (Wong 2000a) is a broad-scale data integration system that we developed in collaboration with colleagues in University of Pennsylvania. It allows many data sources to be viewed as if they reside within a federated nested relational database system. It automatically handles heterogeneity so that a user can formulate his queries in a way that is independent of the geographic location of the
data sources, independent of whether the data source is a sophisticated relational database system or a dumb flat file, and independent of the access protocols to these data sources. It also has a good query optimizer so that a user can formulate his queries in a clear and succint way without having to worry about whether the queries will run fast. The system is positioned as a mediator system encompassing a nested relational data model, a high-level query language, and a powerful query optimizer. It runs on top of a large number of light-weight wrappers for accessing various data sources. There are also a number of application programming interfaces that allow Kleisli to be accessed in a ODBC- or JDBC-like fashion in various programming languages for a various applications (Wong 2000b). The Kleisli system is highly extensible. It can be used to support several different high-level query languages by replacing its high-level query language module. Currently, Kleisli supports a “comprehension syntax”-based language called CPL (Wong 2000a) and a “nested relationalized” version of SQL called sSQL. The Kleisli system can also be used to support many different types of external data sources by adding new wrappers, which forward Kleisli’s requests to these sources and translate their replies into Kleisli’s exchange format. These wrappers are light weight and new wrappers are generally easy to develop and insert into the Kleisli system. The optimizer of the Kleisli system can also be customized by different rules and strategies (Wong 2000a). Besides the ability to query, assemble, and transform data from remote heterogeneous sources, it is also important to be able to conveniently warehouse the data locally. Kleisli does not have its own native database management system. Instead, Kleisli has the ability to turn many kinds of database systems into an updatable store conforming to its nested relational data model. In particular, Kleisli can use flat relational database management systems such as Sybase, Oracle, MySQL, etc. to be its updatable store. It can even use all of these systems simultaneously. It is also worth noting that Kleisli stores nested relations into flat relational database management systems using an encoding scheme that does not require these nested relations to be fragmented over several tables. The first prototype of Kleisli was constructed in 1994 (Davidson, Overton, Tannen & Wong 1997). That very primitive prototype became the first general query system to solve those “impossible queries” published in 1993 by the US Department of Energy. Figure 1 shows a solution in Kleisli to the example “impossible” query mentioned earlier. Kleisli is licensed to GeneticXchange of Menlo Park and serves as the back bone of their system. For further information, please visit www.geneticxchange.com. 3 Data Warehousing Besides querying data sources on the fly, there is also a great need by biologists and biotechnology companies to create their own customized data warehouses. These warehouses are motivated by the following factors. Execution of queries can be more efficient assuming data reside locally on a powerful database system. Execution of queries can be more reliable assuming data reside locally on a high-availability database system and highavailability network. Execution of queries on a local warehouse avoids unintended “denial of service attacks on the original sources Most importantly, many public sources contain errors. Some of these errors cannot be corrected or detected on the fly. Hence, human effort must be used—perhaps assisted by computers—to perform cleansing. The cleansed data are warehoused to avoid repeating this task.
sybase-add (name: "gdb", ...); create view locus from locus cyto location using gdb; create view eref from object genbank eref using gdb; select accn: g.genbank ref, nonhuman-homologs: H from locus c, eref g, select u from na-get-homolog-summary(g.genbank ref) u where not(u.title like "%Human%") and not(u.title like "%H.sapien%") H where c.chrom num = "22" and g.object id = c.locus id and not (H = ); �
�
Figure 1:
This Kleisli query answers the US Department of Energy query “list non-human homologs of genes on human chromosome 22.” The first three lines connect to GDB and map two tables in GDB to Kleisli. The next few lines extract from these tables the accession numbers of genes on Chromosome 22, use the Entrez function na-get-homolog-summary to obtain their homologs, and filter these homologs for non-human ones. Underlying this simple SQL-like query, Kleisli automatically takes care of the heterogeneity and the geographical distribution of the two underlying sources, as well as to automatically optimize, made concurrent, and co-ordinate the various threads of query execution.
The requirements of a warehouse of biological data are that it should be efficient to query, easy to update, and that it should model data naturally. This last requirement is very important because biological data, such as the GenBank report shown in Figure 2, have very complex nesting structure. Warehousing such data in a radically different form are likely to cause problems later in the effective use of these data. Due to the complex structure of biological data, a relational DBMS such as Sybase is not suitable as a warehouse. The reason is that they force us to fragment our data into many pieces in order to satisfy the 3rd normal form requirement. This fragmentation or normalization process needs a skilled expert to get right. However, the final user is often not the same expert. So when the user wants to ask question on the data, he may face some conceptual overhead to first figure out how the original data got fragmented into the many pieces in the warehouse. The fragmentation may also pose efficiency problems, as a query may cause many joins to be performed to reassemble the fragments into the original data. Kleisli has the capability to turn relational DBMS into nested relational DBMS. It can use flat DBMS such as Sybase, Oracle, MySQL, etc. to be its update-able complex object store. It can in fact use all of these varieties of DBMS simultaneously. This capability makes Kleisli a good system for warehousing complex biological data. Figure 3 provides a simple example where Kleisli is used to warehouse GenPept data which is similar in structure and complexity to the GenBank report from Figure 2. 4 Epitope Prediction Epitopes are immunogenic peptides in viral antigens that bind to MHC molecules. They are the starting point for the design of vaccines, as well as the starting point for the de-immunization of gene therapy vectors. Different epitopes bind to different combination of MHC molecules. Epitopes can be detected by wet experiments. However, the cost of such experiments is high. An example antigen is shown in Figure 4. The task of an epitope prediction system is to reliably identify peptides, from a given antigen protein, that bind a given MHC molecule, using computer. Such peptides can then be validated by wet experiments. Significant cost savings are achieved if the predictions are reliable. We have developed a very detailed warehouse, FIMM, on the binding and non-binding of peptides to differ-
(#uid: 6138971, #title: "Homo sapiens adrenergic ...", #accession: "NM 001619", #organism: "Homo sapiens", #taxon: 9606, #lineage: ["Eukaryota", "Metazoa", ... ], #seq: "CTCGGCCTCGGGCGCGGC...", #feature: (#name: "source", #continuous: true, #position: [ (#accn: "NM 001619", #start: 0, #end: 3602, #negative: false)], #anno: [ (#anno name: "organism", #descr: "Homo sapiens"), ... ]), ... , ...)
TRAP-559AA MNHLGNVKYLVIVFLIFFDLFLVNGRDVQNNIVDEIKYSE EVCNDQVDLYLLMDCSGSIRRHNWVNHAVPLAMKLIQQLN LNDNAIHLYVNVFSNNAKEIIRLHSDASKNKEKALIIIRS LLSTNLPYGRTNLTDALLQVRKHLNDRINRENANQLVVIL TDGIPDSIQDSLKESRKLSDRGVKIAVFGIGQGINVAFNR FLVGCHPSDGKCNLYADSAWENVKNVIGPFMKAVCVEVEK TASCGVWDEWSPCSVTCGKGTRSRKREILHEGCTSEIQEQ CEEERCPPKWEPLDVPDEPEDDQPRPRGDNSSVQKPEENI IDNNPQEPSPNPEEGKDENPNGFDLDENPENPPNPDIPEQ KPNIPEDSEKEVPSDVPKNPEDDREENFDIPKKPENKHDN QNNLPNDKSDRNIPYSPLPPKVLDNERKQSDPQSQDNNGN RHVPNSEDRETRPHGRNNENRSYNRKYNDTPKHPEREEHE KPDNNKKKGESDNKYKIAGGIAGGLALLACAGLAYKFVVP GAATPYAGEPAPFDETLGEEDKDLDEPEQFRLPEENEWN
�
�
Figure 4: Figure 2:
A portion of a record in GenBank, showing the deeply nested structure of the data. oracle-cplobj-add (name: "db", ...); create table GP (uid: "NUMBER", detail: using db; ! Populate table with GenPept reports select uid: x.uid, detail: x into GP from aa-get-seqfeat-general "PTP" as x using db; ! Map GP to that table create view GP from GP using db; ! Run a queryto get title of 131470 select x.detail.title from GP as x where x.uid = 131470;
"LONG")
Figure 3:
A Kleisli query that creates a table in Oracle, fetches and stores GenPept reports on protein tyrosine phosphatases (PTP) from Entrez into it, and queries the table for a specific report. The impedance mismatch between the fact that Oracle’s table can store only flat data and that GenPept reports are deeply nested data is automatically handled by Kleisli using technique based on efficient encoding of structures into a data exchange format.
ent MHC molecules (Schoenbach, Koh, Sheng, Wong & Brusic 2000). From this warehouse of data, we constructed very accurate models—mostly using artificial neural networks—for predicting peptide binding to specific MHC molecules (Honeyman, Brusic, Stone & Harrison 1998, Brusic & Zeleznikow 1999). The system is called PREDICT/PREDMODEL. We compare the prediction performance of PREDICT/PREDMODEL on the antigen in Figure 4 wrt HLAA11 (an example MHC molecule) with that of the popular public epitope prediction system called BIMAS. This antigen is known to have just over 30 epitopes wrt HLAA11. Just 19 epitopes are included among BIMAS top 66 predictions. In contrast, 22 epitopes are included among PREDICT/PREDMODELs top 29 predictions. We have also made predictions for many collaboration partners from WEHI (IDDM) (Honeyman, Brusic & Harrison 1997), Case Western (Malaria parasite), Pittsburg Univ (Melanoma) (Zarour, Storkus, Brusic, Williams, Old & Kirkwood 2000), Kumamoto Univ (HIV) (Schoenbach, Yu & Brusic 2002), etc. 5 Transcription Start Site Recognition A draft human genome sequence have been assembled. We even know the rough position of many of the genes. However, the precise structure such as transcription start sites, transcription factor binding sites, translation initiation sites, splice points, poly(A) signals, etc. of many of these genes are unknown. Fully wet lab-based determi-
An example antigen protein (TRAP). Some known epitopes wrt HLA-A11 are highlighed.
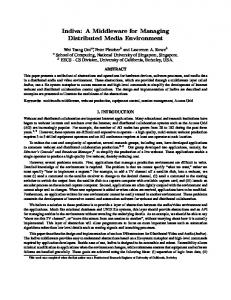
nation of these features is costly and slow. Thus computational analysis tools that can accurately reveal some of these features are necessary. We have developed the Dragon promoter/gene start finding tool, a reliable transcription start site/gene start prediction system (Bajic, Seah, Chong, Zhang, Koh & Brusic 2002, Bajic, Chong, Seah & Brusic 2002, Bajic & Seah 2002). This tool contains two systems, Dragon Promoter Finder (DPF) and Dragon Gene Start Finder (DGSF). The basic idea of the DPF system is shown in Figure 5. It has a number of signal sensors based on pentamer frequencies and uses an artificial neural network to integrate these signals to decide if the current position under consideration is a transcription start site. A refinement of this system uses multiple sets of signal sensors. It decides which set of sensors to use on the basis of the nucleotide composition of the input DNA sequence. DSGF is an enhanced system aimed at gene start recognition. It predicts a region that overlaps with the first exon of the gene. An artifcial neural network combines predictions of the so-called CpG islands with the predictions of transcription start sites and some additional sensor signals to infer if the combination of the CpG island and transcription start sites is characteristic of a gene’s first exon. The results of Dragon are very promising. Figure 6 shows its performance on 1.3MB of benchmark data not seen by Dragon during its training. The vertical axis is the sensitivity level (the ratio of the number of true positives to the number of real positives). The horizontal axis is the precision level (the ratio of the number of true positives to the number of predicted positives). The solid black curve plots the precision of Dragon at each sensitivity level. The grey curve is the performance of the version of Dragon without the refinement that select signal sensors based on nucleotide composition. The various spots are the performance of several popular transcription start site prediction systems—NNPP2.1 (Reese, Harris & Eeckman 1996), PromoterInspector (Scherf, Klingenhoff & Werner 2000), Promoter2.0 (Knudsen 1999)— at the best sensitivity and precision levels that we could obtained for them on the benchmark data. As can be seen, at any level of sensitivity, Dragon produced significantly less false positives than other prediction systems. In fact, at least an order of magnitude less. We are currently making further improvement to Dragon, as well as validating it on the very large DMD gene with our wet lab collaborators at the National University Hospital. Dragon Gene Start Finder results (Bajic & Seah 2002) for human chromosomes 21 and 22 are also shown in Figures 7 and 8. In Figures 9 and 10, we also show the comparison with the other two systems that are top in their class, the First Exon Finder (FirstEF) (Davuluri, Grosse & Zhang 2001) and Eponine (Down & Hubbard 2002). Pre-
Figure 5:
The basic approach of the Dragon Promoter Finder.
Figure 7: The performance of the Dragon Gene Start Finder on human chromosome 21.
Figure 6:
The performance of the Dragon Promoter Finder.
dictions of transcription start sites are counted as correct if they are within 2000 nt from the real gene start. The last column in the tables is the measure of prediction quality introduced in (Bajic & Seah 2002) named ”distance from the ideal predictor” and defined as
�������� ��
� �� ��������������� ������� �"!#��� ��
� is the total number of predictions made by where ���$� &�%')�& *�+ is the sensitivity, while �the�"! predictor, � %'&�%')�& *�& is the (positive value (equiva�.-/��01-predictive ��� being lently, precision), with , and the numbers of true positive, false negative, and false positive predictions respectively. This measure is useful when one has to compare different predictors and the smaller this distance, the better is the predictor’s performance. For other measures useful in comparing predictors see (Bajic 2000). Dragon Gene Start Finder system appears to be currently the most accurate predictor of gene starts. Dragon is licensed to BioBase of Germany and will be integrated into their Transplorer product. 6 Medical Record Analysis Microarrays are now being used to measure the expression level of thousands of genes simultaneously. The gene expression profiles thus obtained may be useful in understanding the interactions of genes under various experimental conditions and the correlation of gene expressions to disease states, provided gene expression analysis can be carried out successfully. We can expect reasonably that gene expression data measured by microarrays or other
Figure 8: The performance of the Dragon Gene Start Finder on human chromosome 22. means will soon be part of a patient’s medical records. We has mainly worked on classification analysis on gene expression data: aims at finding stable differentially expressed genes from two or more groups of samples and using these genes as a means to distinguish (ie. classify) new samples into one of the these groups. Currently most work on gene expression profile classification considers the significance of each gene individually. We want to go beyond that and consider groupings of genes, because it is more reasonable to assume that the disease relevant of genes require coordinated expression of groups of genes, and these groups may vary from patient to patient. The analysis of medical records is aimed mainly at diagnosis, prognosis, and treatment planning. Here we are looking for patterns that are (a) valid: they are also observed in new data with high certainty; (b) novel: they are not obvious to experts and provide new insights; (c) useful: they enable reliable predictions; and (d) understandable: they pose no obstacle in their interpretation. Traditional datamining methods that look for high frequency patterns are not useful on these data. Eg., if you use these methods in the Singapore General Hospital, they will produce totally useless patterns such as “everyone here has black hair and black eyes.” We want to develop a technique that is both highly accurate and highly understandable. There are many methods for analysing medical records (including microarray measurements of gene expression), such as decision tree induction (C4.5, CBA), Bayesian networks (LB, NB, TAN), neural networks, support vec-
Human chromosome 21 Dragon GSF FirstEF Eponine
���������� � ��
87 106 67
36 197 28
394 1236 816
�����
0.5686 0.6928 0.4379
0.7073 0.3498 0.6442
A Sample
T-ALL?
�������
No
Y
205 889 542
T-ALL
E2A-PBX1? Y
No
E2A-PBX1
Figure 9:
TEL-AML1?
Comparison results on human chromosome 21
No
Y TEL-AML1 Human chromosome 22 Dragon GSF FirstEF Eponine
���������� � ��
200 261 148
54 381 59
979 2568 2055
�����
0.59 0.7699 0.4366
0.7874 0.4065 0.7150
BCR-ABL?
�������
No
Y BCR-ABL
452 1634 1297
MLL? No
Y
E
MLL
Hyperdip 50? Figure 10:
Comparison results on human chromosome 22
Hyperdip G 50
tor machines (SVM), etc. Decision trees are easy to understand and are very fast to construct and use. However, they are usually not accurate if the decision boundary is non-linear. Bayesian networks, neural networks, and support vector machines performed better in non-linear situations. However, their resultant models are “black boxes that may not be easy to understand. We have been developing a novel datamining method called PCL (Li & Wong 2002a, Li, Liu, Downing, Yeoh & Wong 2002) for Prediction by Collective Likelihood of emerging patterns. This method focuses on (a) fast techniques for identifying patterns whose frequencies in two classes differ by a large ratio (Dong & Li 1999), which are the so-called emerging patterns; and on (b) combining these patterns to make decision. Note that a pattern is still emerging if its frequencies are as low as 1% in one class and 0.1% in another class, because the ratio indicates a 10 times difference. Basically, the PCL classifier has two phases. Given (instances of class ) and two training datasets (instances of class ) and a test sample , PCL first discovers two groups of most general emerging patterns from and . Denote the most general emerging patterns of as, � � , � , ����� , � � in descending order of frequency. Denote the most general emerging patterns as � � , � , ����� , � � , in descending order of of frequency. Suppose the test sample contains these most general emerging patterns of : � ��� , � � � , ����� , # � " " " � �� , ! ! ����� !%$'&(! , and these most general emerging patterns of : � � � , � �%� , ����� , � �%) , * �+" * " *-, * " ����� & . The next step is to calculate two scores . .0/ for predicting .0/ * the class label of . Suppose we use ( ! and ) top-ranked most general emerging patterns of and . Then we define the score of in the class as
&
+
& +
&
0
� & � +
� &
,
� �& � �+
� & � +
�
+
�
&
&
1-2�354�6
� + ,
& , � &
� +
+
� &
� +
� +
,
+
� , - & � �89 7 � +
�
+
:�; �
,
< �4 65=5>?6-@A2CB � � < 4�65=5>?6-@A2CB �
�, - & �
�
� �&D � � :& �
�, - + � &
and the score in the class is similarly in terms FE defined 1-2�354�6 of � �%D and � : . If 1-2�354�6 , then is predicted as the class of . Otherwise it is predicted as the class of . We use the size of and to break tie. The PCL classifier has proved to be a good tool for analysing gene expression data. Its first application is the classification of heterogeneous acute lymphoblastic leukemia (ALL) samples (Li et al. 2002, Yeoh, Ross, Shurtleff, William, Patel, Mahfouz, Behm, Raimondi,
+
+
&
Y
No OTHERS
Figure 11:
The classification of the ALL subtypes is organized in a tree. Given a new sample, we first check if it is T-ALL. If it is not classified as T-ALL, we proceed to the next level and check if it is a E2A-PBX1. If it is not classified as E2A-PBX1, we proceed to the third level and so on.
Reilling, Patel, Cheng, Campana, Wilkins, Zhou, Li, Liu, Pui, Evans, Naeve, Wong & Downing 2002). The data consist of gene expression profiles of 327 ALL samples, obtained by hybridization on the Affymetrix U95A GeneChip containing probes for 12558 genes. The samples contain all the known ALL subtypes, including TALL, E2A-PBX1, TEL-AML1, MLL, BCR-ABL, and hyperdiploid. Our medical collaborators initially gave us 215 samples as training data for constructing the classification model using PCL. Then a further 112 samples were given at a later stage for blinded testing. There are 28, 18, 52, 9, 14, and 42 training instances and 15, 9, 27, 6, 6, and 22 testing instances respectively for T-ALL, E2A-PBX1, TEL-AML1, BCR-ABL, MLL, and hyperdiploid. There are also 52 training and 27 testing instances of other miscellaneous subtypes. A tree-based classification scheme is used as shown in Figure 11. Due to the large number of genes in the gene expression data, a preliminary gene selection step is necessary. The entropy method (Fayyad & Irani 1993) and the H method (Liu & Sentiono 1995) are used to select up to 20 genes at each level of the tree for use in classification; the rest of the genes are masked out. The number of false predictions on the testing instances at each level of the tree by PCL, as well as those by C4.5, SVM, and NB, is given in Figure 12. The number of false predictions by PCL is considerably less than that made by the other methods. We have also tried using different number of genes and different selection methods and different values of the param. eter in PCL, the number of false predictions by PCL is consistently less than that made by other methods (Liu, Li & Wong 2002). Similar results are also obtained when a parallel classification scheme is used in place of the treestructured scheme (Li et al. 2002). In addition, the top emerging patterns used in the PCL method also serves as high level rules for understanding the differences between the different ALL subtypes. Such rules, under certain situations, can be used for suggesting treatment plans (Li & Wong 2002b).
�
7 Protein Interaction Extraction While scientific databases have been proliferating in these few years, much of the scientific data reported in the lit-
Testing Data
T-ALL vs OTHERS1 E2A-PBX1 vs OTHERS2 TEL-AML1 vs OTHERS3 BCR-ABL vs OTHERS4 MLL vs OTHERS5 Hyperdip G 50 vs OTHERS Total Errors
Error rate of different models C4.5 SVM NB PCL ( ) 0:0 0:0 0:0 0:0 0:0 0:0 0:0 0:0 1:1 1:0 1:0 1:0 2:0 3:0 1:4 2:0 0:1 0:0 0:0 0:0 2:6 0:2 0:2 0:1 13 6 8 4
due to the compounded complexity of linguistic and biological nature:
�
Bio-name recognition. To extract interaction information from the literature, one must first be able to identify the names of the interacting biological entities from the sentences (named entity recognition). In the biomedical domain, there is frequent use of long descriptive compound names, as well as short cryptic acronyms that are often created in an ad hoc manner by the authors. Standard nomenclature is loosely followed, resulting in a plethora of unstructured names and aliases. Name recognition is further complicated by the tendency of scientific authors to use, say, the names of genes as proteins interchangeably, relying on the context or background knowledge for appropriate sense disambiguation;
������
Figure 12: The error counts of various classification methods on the blinded ALL test samples are given in this figure. PCL is shown to make considerably less misclassifications. The OTHERS class contains all those subtypes of ALL below the th level of the tree depicted in Figure 11.
�
�
erature have not been captured in structured databases. For instance, unlike sequence data that were routinely deposited by scientists in online structured databases (e.g. GenBank), useful molecular interaction information are still primarily reported in scientific journals in free-text formats. Such information are critical for post-genome research and knowledge discovery. For example, in microarray data analysis, information on gene function, domains, interactions, and pathways are needed for uncovering the primary gene regulation events that are truly characteristic of a disease citegerhold-tibs99. It is typical in microarray experiments that several hundred genes can be identified together as significant. Some of these genes may appear significant because they were upregulated by secondary gene regulation events. However, on the basis of gene expression analysis such as the one described in the previous section alone, it is not possible to decide which gene is part of the primary cause and which gene is merely a down-stream effect. Only by complex tracing of the underlying signal transduction cascades can we filter out the secondary genes and identify the truly significant ones. This would require protein-protein interaction information, which are usually ”hidden” in the vast body of scientific literature. Because of the importance of protein interaction information in post-genome research, biomedical scientists have expended much effort in creating curated online databases of proteins and their interactions. Many of the key protein databases, such as the SWISS-PROT (Bairoch & Apweiler 2000), the Biomolecular Interaction Database (BIND) (Bader, Donaldson, Wolting, Ouellette, Pawson & Hogue 2001), and the Database of Interacting Proteins (DIP) (Xenarios, Salwinski, Duan, Higney, Kim & Eisenberg 2002) are mostly hand-curated from the scientific literature. This manual approach is clearly not scalable as the sheer volume of biomedical literature— over 11 million abstracts currently exist in Medline and growing rapidly—demands computer automation. For the benefit of speeding up the capture of results reported in research journals into structured databases, sophisticated natural language-based information extraction tools are needed (Hirschman, Park, Tsujii, Wong & Wu 2002). In the ideal situation, a user can post a high-level query requesting for protein interaction information. Then an engine will download many scientific texts, extract precise facts on the interactions of individual proteins, and combine these facts into an interaction pathway for the user, as shown in Figure 13. Extracting protein interactions from scientific literature is a classic information extraction (IE) task: It involves extracting information about genes and proteins (entities) and their interactions (relationships) as reported in the literature into predefined biochemical interaction templates. This turns out to be a difficult task
�
Bio-interaction complexity. There is also much complexity and variety of forms in biological interactions, involving both first-order ”basic” events, which are interactions of the form: and complex secondorder causal events such as: . For example, here is a partial grammar that we used in our system to generate IE templates for protein interaction extraction: B | | | | | S | |
�
:: P phosphorylate P [on A] [at L] P [at L] bind-to P [at L] [to-produce P] P dissociate [to-produce P+] P activate [F activity-of] P P transport P [from C] [to C] ... :: B [is-inhibited-by B+] [provided B+] B [is-regulated-by B+] [provided B+] ...
The nonterminals B and S above represent basic and causal interaction events respectively, while the terminals P stands for a protein molecule, A an amino acid, L a molecular locale (domain or feature), F a function, and C a subcellular location. As the interaction grammar has illustrated, protein interactions often involve multiple agents and numerous steps. Complex IE templates have to be generated in order to properly capture interaction information. Furthermore, because of this inherent structural complexity of biological interactions, sentences in the biomedical literature that describe them tend to be relatively complicated, making extraction by computer additionally difficult. Bio-condition extraction. Bio-molecular interactions are often highly context-sensitive events. As such, supplementary information such as species, cell types, subcellular locations, and the experimental conditions are of great importance to the scientists, making template element filling particularly significant in biomedical information extraction. However, in biomedical literature, such contextual information is either implicit or often referred to outside the interaction sentences, requiring in-depth text analyses such as co-reference resolution and discourse inference for extraction.
Over the last couple of years, we have been developing the PIES, a protein interaction extraction system (Wong 2001, Ng & Wong 1999). The PIES is a rulebased system for analyzing biology research papers written in English. It specializes in recognizing names of proteins and molecules and their interactions. It is one of the first systems capable of this kind of analysis and information extraction. There has also been an increased focus by the bioinformatics community to address this IE need in recent years (Blaschke, Andrade, Ouzounis & Valencia
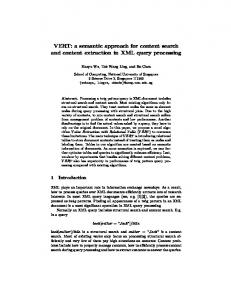
1999, Humphreys, Demetriou & Gaizaukas 2000, Rindflesch, Tanabe, Weinstein & Hunter 2000, Thomas, Milward, Ouzounis, Pulman & Carroll 2000, ?, Ono, Hishigaki, Tanigami & Takagi 2001). Figure 14 shows the output of the system given “Jak1” as the protein whose pathway we are interested in. The PIES downloaded and examined several hundred scientific abstracts that are available online from the main biomedical literature repository MEDLINE. It recognized several hundred interactions involving hundreds of proteins and molecules mentioned in these abstracts as reported by the scientists. To efficiently compile quality protein interaction pathways from scientific literature, we currently adopt a semiautomated approach, with PIES as the automation frontend and human curators to refine the results:
�
�
Bio-name recognition. We use an approach combining hand-constructed name grammars to exploit morphological and other lexical cues to extract protein names by pattern recognition, with a dictionary of protein names to cover those not detected and wrongly detected by the naming rules. The latter can be incrementally compiled by the human curators as our knowledge warehouse grows.
�
Bio-interaction extraction. To encapsulate the inherent complexity of biochemical reactions, we defined a set of bio-molecular interaction grammar rules; parts of it were shown previously. From this grammar, we can generate the various IE templates for extracting information on the various classes of protein interactions. For information detection and retrieval, we currently employ a rule-based approach based on sentence co-occurrence of protein names and interaction function words to retrieve sentences containing interaction information, followed by shallow parsing to manage the variations in the verb forms (Wong 2001, Ng & Wong 1999). The rulebased IE approach is quick in execution and it allows us to easily extend our system to include different kinds of bio-molecular interactions as we expand our knowledge warehouse; Bio-condition extraction. As there is yet a reliable technology to tackle the challenging task of discourse analysis and anaphora processing in the biomedical domain, we currently rely mostly on our human curators to extract additional contextual information from the abstracts retrieved by the bio-interaction extraction module. As our human expertise in this area grows with experience, we can translate it into computer algorithms to automate some portions of this task in future.
The PIES is licensed to Molecular Connections of Bangalore as their MCHIPS system for rapid compilation of quality protein interaction databases for different biological domains. More than 14,000 molecular interactions have been successfully extracted from MEDLINE so far. For further information, please visit www. molecularconnections.com. 8 Conclusion Due to the multi-discplinary nature of bioinformatics, diversed computing technologies and techniques are employed when solving bioinformatics problems. For example, innovative database technologies are used for the data integration and warehousing problems mentioned in Sections 2 and 3; various machine learning techniques are used for the epitope prediction, transcription start site recognition, and gene expression analysis problems from Sections 4, 5, and 6; and natural language processing
Figure 13: A typical workflow for automated pathway discovery using the MEDLINE abstracts. techniques are applied to the protein interaction extraction problem from Section 7. Many bioinformatics problems also require a combination of techniques to be used in conjunction with each other. In fact, for most prediction problems in bioinformatics, the techniques of machine learning, feature generation, and feature selection have to be used in conjunction with each other to achieve good results. In the case of epitope prediction in Section 4, a machine learning technique—artificial neural network—is applied by itself. In contrast, in the case of transcription start site recognition in Section 5, several sensors are developed to generate appropriate signal features before a machine learning algorithm is applied. In the case of gene expression analysis in Section 6, techniques for gene feature selection are applied to reduce the data into more manageable dimensions before machine learning algorithms are applied. There are also problems where both feature generation and feature selection are needed before machine learning algorithms are applied—an example of this can be found in our work on translation initiation site recognition (Zeng, Yap & Wong 2002). Lastly, in this paper, we have also described two basic technologies that were very original and innovative when they were first developed. The first is Kleisli, introduced in 1994. It is the first broad-scale data integration system that employs the nested relational data model, an explicit data exchange format, and a mediator-wrapper architecture. These features greatly facilitated the incorporation of numerous biological data sources and applications into Kleisli. The second is PCL—and the idea of emerging patterns, introduced in 1998—which is a machine learning method quite distinct from traditional machine learning methods. It produces highly human-understandable rules and also achieves very good accuracy. 9 Aknowledgements We are pleased to acknowledge members of our groups who shared the joy and toil from informatics to bioinformatics, and who worked with us to obtain many of the results reviewed in this paper: Louxin Zhang, Allen Chong, Hao Han, Judice Koh, S.P.T. Krishnan, Huiqing Liu, Rekha Pillai, Seng Hong Seah, Soon Heng Tan, Suisheng Tang, Guanglan Zhang, Zhuo Zhang, and numerous students. We thank Suk-Quan Low for assistance in polishing parts the paper.
Blaschke, C., Andrade, M., Ouzounis, C. & Valencia, A. (1999), Automatic extraction of biological information from scientific text: Protein-protein interactions, in ‘Proceedings of 7th International Conference on Intelligent Systems for Molecular Biology’, pp. 60– 67. Brusic, V. & Zeleznikow, J. (1999), ‘Computational binding assays of antigenic peptides’, Letters in Peptide Science 6, 313–324. Davidson, S., Overton, C., Tannen, V. & Wong, L. (1997), ‘BioKleisli: A digital library for biomedical researchers’, International Journal of Digital Libraries 1(1), 36–53. Davuluri, R. V., Grosse, I. & Zhang, M. Q. (2001), ‘Computational identification of promoters and first exons in the human genome’, Nat. Genet. 29(4), 412–417. Dong, G. & Li, J. (1999), Efficient mining of emerging patterns: Discovering trends and differences, in ‘Proceedings of 5th ACM SIGKDD International Conference on Knowledge Discovery & Data Mining’, San Diego, pp. 15–18. Down, T. A. & Hubbard, T. J. (2002), ‘Computational detection and location of transcription start sites in mammalian genomic DNA’, Genome Research 12(3), 458–461. Fayyad, U. & Irani, K. (1993), Multi-interval discretization of continuous-valued attributes for classification learning, in ‘Proceedings of 13th International Joint Conference on Artificial Intelligence’, pp. 1022– 1029.
Figure 14: A picture depicting the protein interactions extracted from Medline abstracts by PIES for the protein JAK1. Every spot in the picture is a protein and every arc is an interaction. The arcs are directed and coloured to show the direction and nature of each interaction, such as “X inhibits Y” and “X activates Y.” References Bader, G., Donaldson, I., Wolting, C., Ouellette, B., Pawson, T. & Hogue, C. (2001), ‘BIND–the biomolecular interaction network database’, Nucleic Acids Research 29(1), 242–245.
Hirschman, L., Park, J. C., Tsujii, J., Wong, L. & Wu, C. H. (2002), ‘Accomplishments and challenges in literature data mining for biology’, Bioinformatics. To appear. Honeyman, M., Brusic, V. & Harrison, L. (1997), ‘Strategies for identifying and predicting islet autoantigen t-cell epitopes in insulin-dependent diabetes (IDDM)’, Annals of Medicine 29, 401–404. Honeyman, M. C., Brusic, V., Stone, N. & Harrison, L. C. (1998), ‘Neural network-based prediction of candidate T-cell epitopes’, Nature Biotechnology 16(10), 966–969.
Bairoch, A. & Apweiler, R. (2000), ‘The Swiss-Prot protein sequence database and its supplement TrEMBL in 2000’, Nucleic Acids Research 28, 45–48.
Humphreys, K., Demetriou, G. & Gaizaukas, R. (2000), Two applications of information extraction to biological science journal articles: Enzyme interactions and protein structures, in ‘Proceedings of Pacific Symposium on Biocomputing’, pp. 502–513.
Bajic, V. B. (2000), ‘Comparing the success of different prediction software in sequence analysis: A review’, Briefings in Bioinformatics 1(3), 214–228.
ISO (1987), Standard 8824. Information Processing Systems. Open Systems Interconnection. Specification of Abstraction Syntax Notation One (ASN.1).
Bajic, V. B. & Seah, S. H. (2002), ‘Dragon Gene Start Finder: An advanced system for finding approximate location of the start of gene transcriptional units’. Submitted.
Knudsen, S. (1999), ‘Promoter2.0: For the recognition of Pol II promoter sequences’, Bioinformatics 15, 356– 361.
Bajic, V. B., Seah, S. H., Chong, A., Zhang, G., Koh, J. L. Y. & Brusic, V. (2002), ‘Dragon Promoter Finder: recognition of vertebrate RNA polymerase II promoters’, Bioinformatics 18(1), 198–199. Bajic, V., Chong, A., Seah, S. & Brusic, V. (2002), ‘Intelligent system for vertebrate promoter recognition’, IEEE Intelligent Systems 17(4), 64–70.
Li, J., Liu, H., Downing, J. R., Yeoh, A. E.-J. & Wong, L. (2002), ‘Simple rules underlying gene expression profiles of more than six subtypes of acute lymphoblastic leukemia (ALL) patients’, Bioinformatics . To appear. Li, J. & Wong, L. (2002a), Geography of differences between two classes of data, in ‘Proceedings 6th European Conference on Principles of Data Mining and Knowledge Discovery’, Helsinki, Finland, pp. 325– 337.
Li, J. & Wong, L. (2002b), ‘Identifying good diagnostic genes or genes groups from gene expression data by using the concept of emerging patterns’, Bioinformatics 18, 725–734. Liu, H., Li, J. & Wong, L. (2002), A comparative study on feature selection and classification methods using gene expression profiles and proteomic patterns, in ‘Proceedings of 13th International Conference on Genome Informatics’, Tokyo, Japan. To appear. Liu, H. & Sentiono, R. (1995), Chi2: Feature selection and discretization of numeric attributes, in ‘Proceedings of IEEE 7th International Conference on Tools with Artificial Intelligence’, pp. 338–391. Ng, S.-K. & Wong, M. (1999), ‘Toward routine automatic pathway discovery from on-line scientific text abstracts’, Genome Informatics 10, 104–112. Ono, T., Hishigaki, H., Tanigami, A. & Takagi, T. (2001), ‘Automated extraction of information on proteinprotein interactions from the biological literature’, Bioinformatics 17(2), 155–161. Pearson, P., Matheson, N., Flescher, N. & Robbins, R. J. (1992), ‘The GDB human genome data base anno 1992’, Nucleic Acids Research 20, 2201–2206. Reese, M. G., Harris, N. L. & Eeckman, F. H. (1996), Large scale sequencing specific neural networks for promoter and splice site recognition, in L. Hunter & T. E. Klein, eds, ‘Proceedings of Pacific Symposium on Biocomputing’, World Scientific Publishing Co., Singapore. Rindflesch, T., Tanabe, L., Weinstein, J. & Hunter, L. (2000), EDGAR: Extraction of drugs, genes, and relations from biomedical literature, in ‘Proceedings of Pacific Symposium on Biocomputing’, pp. 517–528. Scherf, M., Klingenhoff, A. & Werner, T. (2000), ‘Highly specific localisation of promoter regions in large genomic sequences by PromoterInspector: A novel context analysis approach’, J. Mol. Biol. 297, 599– 606. Schoenbach, C., Koh, J., Sheng, X., Wong, L. & Brusic, V. (2000), ‘FIMM, a database of functional molecular immunology’, Nucleic Acids Research 28(1), 222– 224. Schoenbach, C., Yu, K. & Brusic, V. (2002), ‘Large-scale computational identification of hiv t-cell epitopes’, Immunology and Cell Biology 80, 300–306. Schuler, G. D., Epstein, J. A., Ohkawa, H. & Kans, J. A. (1996), ‘Entrez: Molecular biology database and retrieval system’, Methods in Enzymology 266, 141– 162. Thomas, J., Milward, D., Ouzounis, C., Pulman, S. & Carroll, M. (2000), Automatic extraction of protein interactions from scientic abstracts, in ‘Proceedings of Pacific Symposium on Biocomputing’, pp. 538–549. Wong, L. (2000a), ‘Kleisli, a functional query system’, J. Funct. Prog. 10(1), 19–56. Wong, L. (2000b), Kleisli, its exchange format, supporting tools, and an application in protein interaction extraction, in ‘Proceedings of IEEE International Symposium on Bio-Informatics and Biomedical Engineering’, Washington, DC, pp. 21–28. Wong, L. (2001), PIES, a protein interaction extraction system, in ‘Proceedings of Pacific Symposium on Biocomputing’, pp. 520–531.
Xenarios, I., Salwinski, L., Duan, X., Higney, P., Kim, S. & Eisenberg, D. (2002), ‘DIP, the Database of Interacting Proteins: A research tool for studying cellular networks of protein interactions’, Nucleic Acid Res 30(1), 303–305. Yeoh, E.-J., Ross, M. E., Shurtleff, S. A., William, W. K., Patel, D., Mahfouz, R., Behm, F. G., Raimondi, S. C., Reilling, M. V., Patel, A., Cheng, C., Campana, D., Wilkins, D., Zhou, X., Li, J., Liu, H., Pui, C.-H., Evans, W. E., Naeve, C., Wong, L. & Downing, J. R. (2002), ‘Classification, subtype discovery, and prediction of outcome in pediatric acute lymphoblastic leukemia by gene expression profiling’, Cancer Cell 1, 133–143. Zarour, H., Storkus, W., Brusic, V., Williams, E., Old, L. & Kirkwood, J. (2000), ‘NY-ESO-1 encodes DRB1*0401-restricted epitopes recognized by melanoma-reactive CD4+ T cells’, Cancer Research 60(17), 4946–4952. Zeng, F., Yap, R. & Wong, L. (2002), Using feature generation and feature selection for accurate prediction of translation initiation sites, in ‘Proceedings of 13th International Conference on Genome Informatics’, Tokyo, Japan. To appear.