SAMCO Final Report 2006 F11 Selected Papers
FROM INPUT-OUTPUT TO OUTPUT-ONLY MODAL IDENTIFICATION OF CIVIL ENGINEERING STRUCTURES Álvaro Cunha, Elsa Caetano, Filipe Magalhães, Carlos Moutinho Faculty of Engineering, University of Porto (FEUP), Portugal E-mail:
[email protected]
Website: www.fe.up.pt/vibest
Abstract This paper presents a brief characterization of the evolution of Experimental Modal Analysis in the Civil Engineering field, from Input-Output to Output-Only Modal Identification Techniques, taking particularly into account the experience of the authors at the Laboratory of Vibrations and Monitoring (VIBEST, www.fe.up.pt/vibest) of FEUP. Key words:
Experimental Modal Analysis, Input-Output, Output-Only, Modal Identification Techniques, Civil Engineering, Laboratory of Vibrations and Monitoring
1. Introduction Some decades ago, the major concern of Structural Engineers was the development and automatic application of new and powerful numerical methods for the analysis (static and dynamic) and design of large Civil Engineering structures. In this context, the fast development of the finite element techniques accompanied by the tremendous technological progress in the field of personal computers allowed the structural designer to use currently excellent structural analysis software packages, which enable to accurately simulate the structural behaviour. However, the design and construction of more and more complex and ambitious civil structures, like dams, large cable-stayed or suspension bridges, or other special structures, made structural engineers feel the necessity to develop also appropriate experimental tools that might enable the accurate identification of the most relevant structural properties (static and dynamic), providing reliable data to support the calibration, updating and validation of the structural analysis numerical models used at the design stage. Beyond that, the continuous ageing and subsequent structural deterioration of a large number of existing structures made structural engineers gradually more interested in the development and application of efficient vibration based damage detection techniques supported by structural health monitoring systems, in which the regular identification of modal properties plays also an important role. Therefore, the first and natural tendency of Civil Engineering researchers was to take some profit from important previous developments made in System Identification and Experimental Modal Analysis in Electrical and Mechanical Engineering, trying to accurately identify the main dynamic properties of civil structures by applying well established input-output modal identification techniques. The difficulty to excite large civil structures in a controlled form, as well as remarkable technological progresses registered in the area of transducers and analogue to digital www.samco.org
Page 1 of 22
SAMCO Final Report 2006 F11 Selected Papers converters, made however feasible to open a new and very promising road for the modal identification of large structures, exclusively based on the measurement of the structural response to ambient excitations and application of suitable stochastic modal identification methods. Under these circumstances, the main purpose of this paper is to briefly present the perspective of the authors concerning the evolution of Experimental Modal Analysis in the Civil Engineering field, from Input-Output to Output-Only Modal Identification Techniques, which is naturally strongly influenced and conditioned by their own experience as researchers at the Laboratory of Vibrations and Monitoring (VIBEST, www.fe.up.pt/vibest) of FEUP.
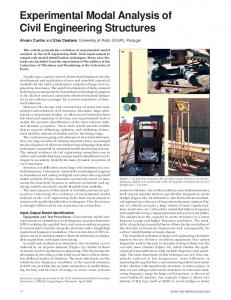
2. Input-Output Modal Identification Equipment and test procedures The conventional Modal Testing is based on the estimation of a set of Frequency Response Functions (FRFs) relating the applied force and the corresponding response at several pairs of points along the structure, with enough high spatial and frequency resolution. The construction of FRFs requires the use of an instrumentation chain for structural excitation, vibration measurement and data acquisition and signal processing. In small and medium size structures, the excitation can be induced by an impulse hammer (Fig. 1a), similar to those currently used in Mechanical Engineering. This device has the advantage of providing a wide-band input, able to stimulate different modes of vibration. The main drawbacks are the relatively low spectral estimates’ frequency resolution, which can preclude the accurate estimation of modal damping factors, and the lack of energy to excite some relevant modes of vibration. Due to this last factor, some laboratories have built special impulse devices more specifically designed to excite bridges (Fig. 1b). An alternative, also derived from Mechanical Engineering, is the use of large electrodynamic shakers (Fig. 1c), which can apply a large variety of input signals (random, multi-sine, etc.), when duly controlled both in frequency and amplitude using a signal generator and a power amplifier. The shakers have capacity to excite structures in a lower frequency range and higher frequency resolution can be attained. The possibility of application of sinusoidal forces allows for the excitation of the structure in resonance and, consequently, for a direct identification of the mode shape.
Fig. 1. a) Impulse hammer; b) Impulse exciation device for bridges (K.U.Leuven); c) Electrodynamic shaker over three load cells; d) Eccentric mass vibrator.
The controlled excitation of large Civil Engineering structures requires however the use of specific and heavy excitation equipment. One option frequently used in the
www.samco.org
Page 2 of 22
SAMCO Final Report 2006 F11 Selected Papers past in dynamic testing of dams was the eccentric mass vibrator (Fig. 1d), which enables the application of sinusoidal forces with variable frequency and amplitude. The main drawbacks of this technique are low force amplitude induced at low frequencies and some difficulty to measure the applied force and ensure no relative movement of the vibrator with regard to the structure. A better option in terms of providing a wide band-excitation over the most interesting frequency range for large civil structures was the use servo-hydraulic shakers. Figure 2 shows, for instance, two shakers of this type built at EMPA (www.empa.ch) to excite bridges or dams, vertically and laterally, as well as the electro-hydraulic mass reaction shaker Victoria from Arsenal Research (www.arsenal.ac.at).
(a)
(b)
(c)
Fig. 2. Servo-hydraulic shakers to excite (a) bridges (vertically), (b) dams (laterally) (EMPA); (c) Electro-hydraulic shaker from Arsenal Research.
The dynamic response of the structure is usually measured with accelerometers (Figure 3) (piezoelectric, piezoresistive, capacitive or force balance) [1], due to their relatively low cost and high sensitivity. A particular characteristic of piezoelectric accelerometers is that they don’t need specific power supply and operate well over a wide frequency range. However, most of them are not suited to low frequency applications. On the contrary, piezoresistive, capacitive and force balance accelerometers can provide DC or low frequency response capability.
(a)
(b)
(c)
(d)
Fig. 3. Schematic cross-section of (a) piezoelectric, (b) piezoresistive, (c) capacitive and (d) force balance accelerometers
The electrical signals captured by these transducers are usually rather low and so must be amplified by conditioning units that may also provide anti-aliasing low-pass filtering (allowing lower sampling rates) and analogue integration to velocities or displacements. The data acquisition and storage of measurement data involves the use of an analogue-to-digital (A/D) converter inserted in a digital computer. The digital raw data must be preliminary analysed and processed, considering operations of scale conversion, trend-removal and decimation. Afterwards, the acceleration time series can be multiplied by appropriate time windows (Hanning, Cosine-Taper, etc.), in order to reduce leakage effects, and subdivided in different blocks for evaluation of average spectral auto and cross spectra estimates, using the FFT algorithm. At last, estimates of FRFs can be obtained using estimators H1 or H2 [1]. The automatic
www.samco.org
Page 3 of 22
SAMCO Final Report 2006 F11 Selected Papers evaluation of FRFs requires appropriate software for analysis and signal processing, which is already available in commercial Fourier analyzers. These analyzers are sometimes simply materialized through the insertion of a specific PCMCIA card into a laptop, allowing either the acquisition of data through input channels or the control of a shaker through an output channel. Input-Output Modal Identification methods There is presently a wide variety of input-output modal identification methods, whose application relies either on estimates of a set of FRFs or on the corresponding Impulse Response Functions (IRFs), which can be obtained through the inverse Fourier Transform. These methods try to perform some fitting between measured and theoretical functions and employ different optimization procedures and different levels of simplification. Accordingly, they are usually classified according to the following criteria: (i) Domain of application (Time or Frequency); (ii) Type of formulation (Indirect or Modal and Direct); (iii) Number of modes analysed (SDOF or MDOF); (iv) Number of inputs and type of estimates (SISO, SIMO, MIMO, MISO). The former methods of identification were developed in the frequency domain. In the simpler SDOF formulations (e.g. Peak Amplitude, Circle-Fit, Inverse methods), a fitting between a measured and a theoretical FRF of a SDOF system in the vicinity of each resonant frequency is developed, neglecting the contribution of resonant modes. In the more sophisticated MDOF methods (e.g. Rational Fraction Polynomial (RFP), Complex Exponential Frequency Domain (CEFD), Polyreference Frequency Domain (PRFD)), the fitting between measured and theoretical FRFs is made globally in a wide range of frequencies. Time domain methods, which tend to provide the best results when a large frequency range or a large number of modes exist in the data, began to be developed as consequence of some limitation in terms of spectral estimates frequency resolution, as well as leakage errors in the estimates. The most widely known methods are either Indirect (e,g. Complex Exponential (CE), Least-Squares Complex Exponential (LSCE), Polyreference Complex Exponential (PRCE), Ibrahim Time Domain (ITD), Eigensystem Realization Algorithm (ERA)) or Direct (e.g. Autoregressive MovingAverage (ARMA)). The gradual development of all these methods, which are extensively described by Maia et al. [1], shows a tendency to completely automated systems of acquisition, analysis, processing and identification, instead of some initial trend to the use of interactive programs. Beyond that, the best-performing methods have been implemented in robust Modal Analysis software [2]. A special class of modal identification methods, called Tuned-Sinusoidal methods (e.g. Asher, Mau) corresponds to the particular type of tests that are based on the application of a sinusoidal excitation at each natural frequency, as can happen using eccentric mass vibrators. Examples of forced vibration tests The performance of classical input-output modal identification tests in Civil Engineering structures can be of interest both on physical models and on prototypes. Figure 4 shows the physical model of Jindo Bridge (South Korea), which was extensively tested to analyze the importance of dynamic cable-structure interaction in terms of seismic response analysis [3]. In this context, several forced vibration tests were performed either using an electro-dynamic shaker or two different shaking
www.samco.org
Page 4 of 22
SAMCO Final Report 2006 F11 Selected Papers tables (at Univ. Bristol and ISMES), and considering two alternative configurations for the model. First, additional masses were distributed along the cables, according to the similitude theory, in order to idealize the cables’ mass and consider the lateral cables vibration. In a second phase, no distributed additional mass was introduced along the cables, but equivalent masses have been concentrated at their extremities. This study permitted to identify the existence of different sets of multiple modes; some being pure cable modes, but others coupled modes. Each of these sets present a common shape for the deck and towers and different cables motion, the corresponding natural frequencies being very close, always in the vicinity of a global mode of the primary system (Figure 6).
(a)
(b)
(c)
(a)
(b)
(c)
Fig. 4. (a) Jindo cable-stayed bridge; (b) Physical model on shaking table (EERC, Univ. Bristol); (c) Physical model on shaking table (ISMES).
Amplitude FRF ((m/s2)/N)
Fig. 5. (a) Application of electro-dynamic shaker; (b) Response measurement with piezoelectric accelerometer; (c) Measurement of cables tensions. 1.00E+01 1.00E+00
Shaker
Exp.
1.00E-01
Ajust. 1.00E-02 8
9
10
11
12
Frequência (Hz)
(a)
(b)
Fig. 6. (a) Amplitude of FRF relating vertical acceleration at 1/3 span with the vertical force applied at the opposite 1/3 span; (b) Identified pattern of a set of multiple modes.
Several large Civil Engineering structures, like buildings, bridges or dams, have been also submitted to forced vibration tests in the past, using heavy excitation devices only available at important and well equipped laboratories. That was the case of EMPA, where Cantieni and other researchers have tested a significant number of bridges and dams [4-6]. Figures 7-9 show some examples of that remarkable activity, presenting in particular some of the modes of vibration accurately identified at the sweedish Norsjö dam.
www.samco.org
Page 5 of 22
SAMCO Final Report 2006 F11 Selected Papers
(a)
(b)
(c)
Fig. 7. (a) Dala bridge; (b) Aarburg bridge; (c) Electro-hydraulic vibrator used at Aarburg bridge
(a)
(b)
(c)
Fig. 8. (a) Norsjö dam; (b,c) View of instrumented point at downstream side reinforced concrete wall
Fig. 9. Some identified modes of vibration at Norsjö dam (modes 1, 2, 3, 10, 11, 12).
3. Output-Only Modal Identification The main problem associated to the performance of forced vibration tests in bridges, buildings or dams stems from the difficulty to excite, with sufficient energy and in controlled manner, their most significant modes of vibration in a low range of frequencies. In very large and flexible structures like cable-stayed or suspension bridges, in particular, the forced excitation requires extremely heavy and expensive equipment very seldom available in most dynamic labs. Figure 10 shows, for instance, the impressive shakers used to excite the Tatara and the Yeongjong bridges.
www.samco.org
Page 6 of 22
SAMCO Final Report 2006 F11 Selected Papers
(a)
(b)
Fig. 10. Forced vibration tests of (a) Tatara cable-stayed bridge (http://www.hsba.go.jp) and (b) Yeongjong suspension bridge (http://www.yeongjongbridge.com)
However, the technological developments registered in the fields of transducers and A/D converters during the last years made feasible the very accurate measurement of very low levels of dynamic response induced by ambient excitations, like wind or traffic, strongly stimulating the development of output-only modal identification methods. Therefore, the performance of output-only modal identification tests became an alternative of extraordinary importance in the field of Civil Engineering, allowing the accurate identification of modal properties of large structures at the commissioning stage or during the structure life time, in a much more comfortable way and avoiding any type of interruption of normal traffic in bridges. Equipment and test procedures
Fig. 11. (a) Force balance accelerometers; (b) Multi-channel data acquisition and processing system for ambient vibration tests; (c) Strong motion tri-axial seismograph
Modern force balance accelerometers (Fig. 11a), specially conceived for measurements in the range 0-50Hz and virtually insensitive to high frequency vibrations, have contributed very significantly to the success of ambient vibration tests. In such tests, the structural ambient response is captured by one or more reference sensors, at fixed positions, together with a set of roving sensors, placed at different measurement points along the structure, in different setups. The number of points used is conditioned by the spatial resolution needed to characterize appropriately the shape of the most relevant modes of vibration (according to preliminary finite element modeling), while the reference points must be conveniently far from the corresponding nodal points. Force balance accelerometers require appropriate power supply, and their analogue signals (that may be locally amplified) are usually transmitted to a data acquisition system with an A/D conversion card, of at least 16 bit, through relatively long electrical cables. This system can be based on a normal PC, although some data acquisition and processing systems, specifically conceived for the performance of ambient vibration tests are already available (Fig. 11b), playing a role similar to the Fourier analyzers in the context of classical Experimental Modal Analysis. Although most of the output-only modal identification tests in large civil structures have been based worldwide on the use of long electrical cables, the implementation
www.samco.org
Page 7 of 22
SAMCO Final Report 2006 F11 Selected Papers of this type of solution is rather cumbersome and time consuming. Therefore, there is presently a natural tendency to develop wireless architectures or, at least reduce drastically the cables length, by introducing local digitization and single cable signal transmission. A very efficient and comfortable alternative has been intensively used at FEUP[7] and LNEC[8], based on tri-axial strong motion recorders duly synchronized through GPS sensors. Output-Only Modal Identification methods The ambient excitation has commonly a multiple input nature and wide band frequency content, stimulating a significant number of modes of vibration. For simplicity, output-only modal identification methods assume the excitation input as a zero mean Gaussian white noise, which means that the real excitation can be interpreted as the output of a suitable filter excited with that white noise input. Modelling the behaviour of the filter-structure system, one may conclude that some additional computational poles, without structural physical meaning, appear as consequence of the white noise assumption. There are two main groups of output-only modal identification methods: nonparametric methods essentially developed in frequency domain and parametric methods in time domain. The basic frequency domain method (Peak-Picking), though already applied some decades ago to the modal identification of buildings [9,10] and bridges [11,12], was only conveniently systematized by Felber [13] about twelve years ago. This approach, which leads in fact to estimates of operational mode shapes, is based on the construction of average normalized power spectral densities (ANPSDs) and ambient response transfer functions involving all the measurement points, and allowed the development of software for modal identification and visualization used at UBC and EMPA [13]. The frequency domain approach was subsequently improved [14,15] by performing a single value decomposition of the matrix of response spectra, so as to obtain power spectral densities of a set of SDOF systems. This method (Frequency Domain Decomposition (FDD)) was better detailed and systematized by Brincker et al. [16], and subsequently enhanced [17] in order to extract modal damping factors estimates. In this last approach (EFDD) these estimates are obtained through inspection of the decay of auto-correlation functions, evaluated by performing the inverse Fourier transform of the SDOF systems’ power spectral densities. The time domain parametric methods involve the choice of an appropriate mathematical model to idealize the dynamic structural behaviour (usually time discrete state space stochastic models, ARMAV or ARV models) and the identification of the values of the modal parameters so as that model fits as much as possible the experimental data, following some appropriate criterion. These methods can be directly applied to discrete response time series or, alternatively, to response correlation functions. The evaluation of these functions can be made based on their definition, using the FFT algorithm [18] or applying the Random Decrement method (RD) [19]. A peculiar aspect of output-only modal identification based on the fitting of response correlation functions is the possibility to use methods that stem from classical input-output identification methods, based on impulse response functions. Some of these methods are the Ibrahim Time Domain (ITD) [20], the Multiple Reference Ibrahim Time Domain (MRITD) [21], the Least-Squares Complex Exponential (LSCE) [22], the Polyreference Complex Exponential (PRCE) [23] or the Covariance-Driven Stochastic Subspace Identification (SSI-COV) [24]. An alternative method that allows direct application to the response time series is the Data-Driven
www.samco.org
Page 8 of 22
SAMCO Final Report 2006 F11 Selected Papers Stochastic Subspace Identification (SSI-DATA) [25]. It’s still worth noting that the Random Decrement technique, usually associated to the application of time domain methods like Ibrahim’s, can be also the base for the application of frequency domain methods, like PP, FDD or EFDD, as it leads to free vibration responses, from which power spectral densities can be evaluated using the FFT algorithm [26], reducing noise effect (methods RD-PP, RD-FDD and RD-EFDD). These methods, schematically represented in Figure 6, have been recently systematized, applied and compared by Rodrigues [8]. Figure 6 also indicates the five different types of numerical techniques employed in their development (FFT, SVD, LS, EVD and QR). PP method estimates of power spectral density functions
Welch method FFT
FDD and EFDD methods SVD
estimates of RD functions RD method
fi SVD
Dy(t)
y (t)
ξi
ITD and MRITD methods estimates of correlation functions
direct method
LS
EVD eigenvector decomposition
φi
LSCE and PTD methods
QR
orthogonal decomposition
SSI-COV method
Ry(t)
FFT
least squares fitting
LS, EVD
LS, EVD
FFT based method
fast Fourier transform
SVD singular value decomposition
RD-FDD and RD-EFDD methods FFT
Numerical techniques used: FFT
RD-PP method
Sy (f) response time series
modal parameters
SVD, LS, EVD
SSI-DATA method QR, SVD, LS, EVD
Fig. 12. Schematic representation of output-only modal identification methods.
Very recently, the new operational Polymax parameter estimation method was introduced by LMS (www.lms.be) [27]. This method operates on spectra or half spectra (i.e. the Fourier transforms of the positive time lags of the correlation functions) and its main advantage consists in yielding extremely clear stabilization diagrams, making an automation of the parameter identification process rather straightforward, which may enable the continuous monitoring of structural dynamic properties. Examples of ambient vibration tests 1.00E+00 Half-sum
ANPSD (N-S)
1.00E-01
Half-diff.
1.00E-02 1.00E-03 1.00E-04 1.00E-05 1.00E-06 0
2
4
0
2
4
6
8
10
12
6
8
10
12
1.00E+00
Mode 1
ANPSD (E-W)
1.00E-01 1.00E-02 1.00E-03 1.00E-04 1.00E-05 Frequency (Hz)
(a)
(b)
Mode 4
(c)
Fig. 13. (a) Heritage Court Tower; (b) ANPSDs spectra; (c) Two identified mode shapes.
www.samco.org
Page 9 of 22
SAMCO Final Report 2006 F11 Selected Papers
Fig. 14. View of Vasco da Gama Bridge. Frequency Domain Decomposition - Peak Picking Singular Values of Spectral Density Matrices of Data Set: Deck nodes 4 and 10
dB | 1.0 / Hz
State Space Dimension
Stabilization Diagram Data Set: Deck nodes 4 and 10 PC [Data Driven]
20 83
0 78
-20 73
-40 68
-60
0
0.3
0.6
0.9
1.2
0
0.3
Frequency [Hz] ARTeMIS Extractor, 0f 9-4eaa-9649-64e1, ARTX-0330E-270803PRO, Enterprise License
0.6
0.9
1.2
Frequency [Hz] ARTeMIS Extractor, 0f 9-4eaa-9649-64e1, ARTX-0330E-270803PRO, Enterprise License
Fig. 15. Singular value spectra (left); Stabilization diagram (right).
Fig. 16. Identified first (left) and second (right) bending (up) and torsion (down) modes.
Ambient vibration tests have been performed with great success in large buildings, bridges or other special structures, allowing the creation of high quality experimental databases that have been used to compare the performance of different output-only modal identification methods. In this context, a benchmark test, concerning the modal identification of the Heritage Court Tower (Vancouver, Canada) has been organized at IMAC-XVIII by Ventura [28]. This example could show the interest of considering a pre-combination of measured signals (half-sum and half-difference signals along two orthogonal directions at two different points at each floor) to emphasize the contributes from bending or torsion, as well as of a high frequency resolution to separate contributions from close modes, when using the classical PP method [29]. The application of FDD and SSI methods permitted a more automatic identification procedure, distinguishing close modes and extracting modal damping estimates. In the field of bridges, complete ambient vibration tests were developed along about 5km of the Vasco da Gama Bridge by FEUP. Regarding the main cable-stayed
www.samco.org
Page 10 of 22
SAMCO Final Report 2006 F11 Selected Papers bridge (Figure 14), the ambient structural response was measured during periods of 16 minutes at 58 points along the deck and towers (upstream and downstream) using a wireless system based on 6 tri-axial 16 bit seismographs duly synchronized by a laptop. The identification of a significant number of lateral, vertical and torsion modes in the relevant frequency range of 0-1Hz was performed, in a first instance [7], using the PP method. Subsequently, SSI and FDD methods were also applied [30,31] and compared using the software MACEC [24] and ARTEMIS [32], leading also to estimates of modal damping factors, although very accurate damping estimates require longer measurement periods. Figure 15 shows the singular value spectra and a stabilization diagram associated to the application of these two methods, while Figure 16 presents plots of some fundamental identified modes. PSD - half-sum of vertical aceleration 1E-02 S1 - v=2m/s S2 - v=2m/s S3 - v=2m/s S4 - v=9m/s S5 - v=9m/s S6 - v=9m/s S7 - v=14m/s
1E-03
1E-04
1E-05
1E-06 0.25
0.35
0.45 Frequency (Hz)
(a) Power Spectral Density functions at reference section (half-sum of vertical acceleration)
Amplitude 1E-02
0.55
0.65
(b) Power Sepctral Density functions at reference section (half-sum of transversal acceleration)
Amplitude 1E-02 1E-03
1E-03
1E-04 1E-04
1E-05 1E-05
1E-06
wind - 2 m/s
1E-06 0
0.2
0.4
0.6
0.8
1
1.2
wind - 10 m/s
1.4 1.6 1.8 Frequency (Hz)
(c)
2
2.2
wind - 14 m/s 2.4
2.6
2.8
wind - 2 m/s
1E-07 3
0
0.3
0.6
0.9
wind - 10 m/s
1.2 1.5 1.8 Frequency (Hz)
2.1
wind - 14 m/s 2.4
2.7
3
(d)
Fig. 17. (a) Guadiana cable-stayed bridge; PSD functions of half-sum vertical (b, c) and lateral (d) acceleration at reference section, as function of mean wind speed.
It’s worth noting that the existence of cables’ frequencies in the frequency range of analysis can difficult the identification of global natural frequencies. Figures 17 (c,d) show, for instance, PSD functions concerning the ambient response of the international Guadiana cable stayed-bridge (Fig. 17 (a)) (linking Portugal to Spain in Algarve), evaluated with three different levels of average wind speed, which show the appearance of spectral contributes from the fundamental modes of stay-cables (in the range 0.6-0.9Hz) or second harmonics, leading to spectral peaks that can not be interpreted as global natural frequencies of the bridge. Inspection of the spectral peaks (Figure 17 (b)) shows also the increase of modal damping with wind speed, which can be evaluated through ambient vibration tests using sufficiently long measurement periods [33]. It’s still worth mentioning that the above described output-only modal identification technique used in Vasco da Gama and Guadiana bridges by FEUP, has been also recently applied with great success in the dynamic tests at the commissioning stage of the outstanding Millau viaduct, coordinated by Grillaud and Flamand (CSTB, France) [34]. The same approach can be used in the experimental assessment of other special structures, like innovative stadia roofs, particularly susceptible to wind induced vibrations, as consequence of their slenderness. That is, for instance, the case of the new Braga Sports Stadium suspended roof (EURO’2004) (Figure 18), formed by 68
www.samco.org
Page 11 of 22
SAMCO Final Report 2006 F11 Selected Papers cables with 212m span, supporting precast reinforced concrete slabs extended to about 1/4 span. The experimental modal identification of this structure was developed by performing an ambient vibration test considering a mesh of 3x9 measurement points, at one side, and 3x5 points, at the other side. Two reference points were used during the test and the time of acquisition in each setup was of 16 minutes. Figure 19 shows 9 modes of vibration identified, as well as the corresponding natural frequencies, which present an excellent correlation with the results provided by the finite element modelling developed considering the geometrical non-linear behaviour of the suspended roof and the progressive application of loads during the construction phase. This comparison is summarized in Table 1, considering the calculated values obtained at the design stage and after some slight modifications dictated by construction, and it is presented in detail in ref. [35].
Fig. 18. Braga stadium cable roof. Table 1. Natural frequencies of the roof structure: calculated at design and constructed, and identified. Frequency (Hz) Frequency (Hz) Mode Mode Design Constructed Identified Design Constructed Identified 1 0.303 0.277 0.275 8 0.672 0.678 0.702 0.293 2 0.322 0.305 9 0.691 0.712 0.684 0.525 3 0.455 0.520 10 0.693 0.754 0.737 0.537 4 0.470 0.532 11 0.712 0.844 0.562 5 0.476 0.574 12 0.748 0.923 0.635 6 0.516 0.610 13 0.802 1.045 0.653 7 0.660 0.673 14 0.864 1.063
www.samco.org
Page 12 of 22
SAMCO Final Report 2006 F11 Selected Papers f = 0.276 Hz
f = 0.293 Hz
f = 0.523 Hz
f = 0.540 Hz
f = 0.559 Hz
f = 0.632 Hz
f = 0.654 Hz
f = 0.701 Hz
f = 0.874 Hz
Fig. 19. Nine identified modes of vibration
Examples of Free Vibration Tests - Damping Estimation The accurate identification of modal damping factors is a point of major difficulty in the identification process, not only due to the considerably larger scatter associated to the estimates provided by the several methods used with regard to natural frequencies and mode shapes, but also because the viscous damping assumption does not correspond exactly to the real damping characteristics, the values of modal damping ratios increasing gradually with the levels of oscillation. However, in several circumstances the accurate identification of modal damping factors is required, which is frequently achieved by performing a free vibration test. That is, for instance, the case of large and slender cable-stayed or suspension bridges, where knowledge of certain damping factors is crucial for the assessment of aero elastic instability problems. Therefore, such tests have been performed, in particular, at Normandy, Vasco da Gama or Millau bridges. At Vasco da Gama bridge, the test was made suspending a barge with a mass of 60t from an eccentric point at the deck (Fig. 20a) [7], at 1/3 span upstream, through a cable, which was cut when the tide became low and the wind speed inferior to 3m/s, to avoid the influence of aerodynamic damping. The sudden release of the mass caused a free vibration response, which was measured during 16 minutes by six tri-axial seismographs at ½ and 1/3 span deck cross-sections. Other alternative techniques can be used with the same purpose, as is the case of Madeira airport [36], where a mass of 60.8t (Fig.20b,c) was suspended from the deck, the sudden release of the mass being achieved through an explosion of a fusible element incorporated in the suspension device.
www.samco.org
Page 13 of 22
SAMCO Final Report 2006 F11 Selected Papers
(b)
(a)
(c)
Fig. 20. (a) Free vibration test of Vasco da Gama cable-stayed bridge; (b) Aerial view of Madeira airport extension; (c) Mass of 60.8t used in the free vibration test of Madeira airport
In the cable-roof of the new Braga Stadium (EURO’2004) (Fig. 18), whose aeroeleastic stability was proved by different experimental tests on physical models, the modal damping identification was essentially required to study possible resonance effects, which may affect the structural integrity and durability in the long term. The identification of modal damping ratios was developed, in a first instance [37] based on a set of data collected by the instrumentation installed at the roof structure, during the forced and free vibration tests developed at commissioning phase. The free vibration test was based on the sudden release of a 5 ton mass from the roof, the structural response (Figure 21a) being collected by the six tri-axial forcebalance accelerometers of the dynamic monitoring system. The application of bandpass filters to the measured signals enables the evaluation of modal free decay responses; these were used to estimate the modal damping coefficients presented in the second column of Table 2. This procedure faces two problems, which justify the missing values in the table: the low level of excitation of some modes and the difficulty of isolate the contribution of modes with very close natural frequencies. An alternative to this procedure is to use the measured response to the impulse as input to the SSI-COV method, as the responses to impulses are proportional to the correlations of the responses to a white noise excitation. This technique was used after the application of a low-pass filter, with a cut-off frequency of 1 Hz, and a decimation to reduce the sampling frequency to 5 Hz, and provided the results presented in the third column of Table 2. It is interesting to observe that for the modes where both techniques were applied the results are very consistent. Forced vibration tests were further conducted, based on a harmonic excitation of the roof at resonance, by means of a cable pulled by an electric engine. After resonance was attained, the excitation was suppressed and the free vibration response measured at the same 6 accelerometers. Figure 21b) represents one of the measured free decays. Using this procedure 5 modes were excited and so, 5 free
www.samco.org
Page 14 of 22
SAMCO Final Report 2006 F11 Selected Papers decays were measured, like the one represented in Figure 21b), which were used to estimate the modal damping coefficients presented in the fourth column of Table 2.
(b)
(a)
Fig. 21. Free decay (a) after application of an impulse and (b) after excitation of the 2nd mode
The comparison between the modal damping coefficients identified using artificial and ambient excitation shows the existence of a satisfactory correlation. However, one can notice that relative differences tend to increase at lower frequencies. In effect, it is well known that it is very difficult to estimate modal damping coefficients since they are dependent on the amplitude of vibration and also on the wind characteristics because of the existence of aeroelastic damping. The very low damping values of this structure make the comparison even more difficult, because very small differences are expressed by significant relative errors. It is important to stress that, in this very flexible structure, the results provided by the FDD method are comparable with the ones of the SSI methods due to the very long time series used and because it was adopted an alternative procedure [35] to estimate the correlation function. The application of the standard EFDD method using independently the time series of each setup (with 16 min.) led to values of modal damping coefficients for the first modes of about 1%. Table 2. Summary of all the identified modal damping coefficients (%). Mode 1 2 3 4 5 6 7 8 9 10 11
Free Vib. Filter 0.28 0.25 0.34 0.20 -
Free Vib. SSI-COV 0.29 0.37 0.32 0.22 0.44 0.36 0.29 0.11 0.18 0.18 -
Harmonic excitation 0.28 0.27 0.22 0.43 0.20 -
Amb. FDD 0.58 0.52 0.47 0.35 0.25 0.36
vibration SSI-COV 0.50 0.42 0.44 0.40 0.47 0.54 0.28 0.27 0.26 0.26 0.41
SSI-DATA 0.51 0.48 0.39 0.33 0.53 0.47 0.73 0.30 0.31 0.29 0.38
4. Finite Element Correlation and Updating Finite element correlation The modal identification of bridges and special structures plays a relevant role in terms of experimental calibration and validation of finite element models used to
www.samco.org
Page 15 of 22
SAMCO Final Report 2006 F11 Selected Papers predict the static or dynamic structural behaviour, either at the design stage or at rehabilitation. After appropriate experimental validation, finite element models can provide essential baseline information that can be subsequently compared with information captured by long-term monitoring systems, in order to detect structural damage. The correlation of modal parameters can be analyzed both in terms of identified and calculated natural frequencies and in terms of the corresponding mode shapes, using correlation coefficients or MAC values. Beyond that, modal damping estimates can be also compared with the values assumed for numerical modelling. This type of analysis, already developed at Vasco da Gama or Luiz I bridges with excellent results [7,38], has been recently applied considering two Portuguese bridges over Douro river: the New Hintze Ribeiro Bridge (a six span composite bridge that substituted the centenary bridge that collapsed in 2001) and the Pinhão Bridge (a three span simple supported metallic bridge with a concrete slab at the deck, which is presently under rehabilitation).
Fig 22. Lateral view and schematic of the New Hintze Ribeiro Bridge, over Douro river, with indication of the measurement points used along the deck.
In the first case (Fig. 22), rather good correlation between identified and calculated modal parameters was achieved concerning the vertical bending modes of vibration (Table 3, left). However, regarding the lateral response of the bridge, identified frequencies were systematically considerably higher than the corresponding calculated values (Table 3, right), though good correlation of modal shapes has been obtained [39]. Such discrepancy stems naturally from the difficulty to simulate numerically the real characteristics of soil-structure interaction at the foundation of the several piers, and it shows the large influence that variations of boundary conditions can have on the global dynamic bridge properties.
www.samco.org
Page 16 of 22
SAMCO Final Report 2006 F11 Selected Papers Table 3. Comparison between calculated and identified natural frequencies associated to vertical (left) and lateral modes (right). Calculated frequency (Hz) 1.608 1.896
Identified frequency (Hz) 1.465 1.782
Type of mode
2.291 2.711
2.197 2.710
3rd vertical 4th vertical
3.458
3.54
5th vertical
1st vertical 2nd vertical
Calculated frequency (Hz) 0.715 0.892 1.180
Identified frequency (Hz) 1.147 1.636 2.881
Type of mode 1st lateral 2nd lateral 3rd lateral
Fig. 23. Views of Pinhão Bridge, over Douro River.
In the case of Pinhão Bridge (Fig. 23), very similar modal estimates were obtained in the three similar spans and good correlation was achieved between significant identified and calculated modal parameters, considering either the vertical or the lateral behaviour of the bridge. However, it was clearly noticed [40] that the initial numerical modeling developed by the designer should be improved to correctly simulate the lateral dynamic response by including the stiffness associated to the concrete slab of the deck, which was made through a discretization in shell elements. Table 4. Comparison of calculated and identified natural frequencies. Mode
Vertical bending
Lateral bending Torsion
type 1st 2nd 3rd 4th 5th 1st 2nd 3rd 1st
Experimental 2.779 5.460 8.293 10.604 12.577 1.721 3.210 4.273 5.937
Frequency (Hz) Model_1 2.380 4.676 6.352 7.383 8.106 1.165 2.020 4.278 5.087
Model_2 2.998 5.447 8.695 11.749 13.396 1.758 3.523 4.495 6.921
This fact is evidenced by Table 4, where the identified natural frequencies are compared with the calculated ones using either a numerical model exclusively based on a discretization in bar elements (Model_1) or an improved model including the discretization of the concrete slab in shell elements (Model_2).
www.samco.org
Page 17 of 22
SAMCO Final Report 2006 F11 Selected Papers Finite element updating The accurate identification of the most significant modal parameters based on outputonly identification tests can support the updating of finite element models, which may be a very interesting task in order to overcome several uncertainties associated to the numerical modeling. Such updating has been recently followed, on a sensitivity basis, to study the dynamic behaviour of a footbridge at FEUP Campus (Figure 24). The bridge deck is a very slender stress-ribbon concrete slab, continuous over two spans (30m / 28m). The slab (3.80m wide and 0.15m height) is formed by 1m long precast segments, at the bottom, and cast in-situ concrete at the top, and embeds four prestressing cables, taking a catenary shape over the two spans, with a circular curve over the intermediate support.
Fig. 24. Stress-ribbon footbridge at FEUP Campus.
For the purpose of finite element updating, a complete ambient vibration test was performed and initial finite element models were developed idealizing the bridge deck as a set of beam elements with the geometry considered at the design stage or measured through a topographic survey (Models 1 and 2). Afterwards, due to the clear nonlinear geometrical behaviour of the bridge, a third model (Model 3) was developed discretizing the deck in truss finite elements with the cables axial stiffness (neglecting bending stiffness), adjusting the initial cables tension so as to obtain the measured longitudinal profile after progressive application of the loads. In order to take also into account the bending stiffness of the concrete slab, this model was subsequently adapted (Model 4), discretizing the deck in truss finite elements, with progressive loading and activation of beam elements connecting the nodes of the truss elements, simulating the effective construction procedure. Finally, this model was slightly modified, considering partial rotations between beam elements to simulate the lack of sealing of the joints and reducing the area and inertia of the beam elements to simulate the effects of cracking and lack of adherence between precast and cast in situ concrete. After all these iterations, very good level of correlation between identified and calculated natural frequencies and mode shapes was achieved, as extensively described in ref. [41]. Subsequently, similar finite element updating procedure was also performed considering the three-dimensional nature of the bridge and discretizing the concrete slab in shell elements (Figure 25), which led also to a good correlation of calculated and identified natural frequencies (Table 5) and mode shapes [42].
www.samco.org
Page 18 of 22
SAMCO Final Report 2006 F11 Selected Papers Table 5. Calculated and identified natural frequencies and damping coefficients. Mode no. 1 2 3 4 5 6 7 8 9 10
Calculated frequency (Hz) 0.940 2.101 2.152 2.234 2.344 3.736 3.875 4.188 4.200 5.761
Identified frequency (Hz) 0.972 2.072 2.043 1.960 2.382 3.590 4.165 5.461
Identified damping (%) 1.07 1.51 1.40 1.10 1.72 1.78 2.00 1.92
Type of mode First symmetric (two spans, opposite phase) Second anti-symmetric (L=30m) First symmetric (two spans, in-phase) First lateral (two spans) Second anti-symmetric (L=28m) Second symmetric (L=30m) First torsional (two spans, L=30m dominant) Second symmetric (L=28m) First torsional (two spans, L=28m dominant) Third anti-symmetric (L=30m)
F=2.101Hz
F=2.152Hz
F=2.234Hz
F=2.344Hz
Fig. 25. Examples of calculated modal shapes
Beyond this type of sensitivity analyses, more automatic finite element updating techniques can also be used [43]. In this context, a drawback of output-only modal identification seemed to be the impossibility to obtain mass normalized mode shapes. However, this inconvenient can be overcome [44] introducing appropriate mass changes.
5. Conclusion Civil Engineering structures have peculiar characteristics (large size and relatively low natural frequencies) that make difficult the current application of classical inputoutput modal identification techniques. Therefore, there is presently a clear tendency worldwide to explore and improve the potential of output-only modal identification techniques, whose efficiency and accuracy were clearly illustrated with the applications shown. These techniques, that may be used under normal operation conditions, can provide a solid basis for: (i) the development of finite element correlation analyses, (ii) the finite element updating and validation; (iii) the definition
www.samco.org
Page 19 of 22
SAMCO Final Report 2006 F11 Selected Papers of a baseline set of dynamic properties of the initially non-damaged structure, that may be subsequently used for the application of vibration based damage detection techniques; (iv) the integration of output-only modal identification techniques in health monitoring systems; (v) the implementation of vibration control devices.
6. References [1]
Maia, N. et al. “Theoretical and Experimental Modal Analysis”, Research Studies Press, UK, 1997
[2]
Han, M-C & Wicks, A.L. “On the application of Forsythe orthogonal polynomials th for global modal parameter estimation, Proc. 7 Int. Modal Analysis Conference, 1989
[3]
Caetano, E., Cunha, A. & Taylor, C. “Investigation of Dynamic Cable-deck Interaction in a Physical Model of a Cable-stayed Bridge. Part I: Modal Analysis”, Int. Journal Earthquake Engineering and Structural Dynamics, Vol.29, No.4, p.481-498, 2000
[4]
Pietrzko, S., Cantieni, R. & Deger, Y. “Modal testing of a steel/concrete th composite bridge with a servo-hydraulic shaker”, Proc. 14 Int. Modal Analysis Conference, Deaborn, Michigan, 1996
[5]
Cantieni, R., Deger, Y. & Pietrzko, S. “Large structure investigation with dynamic methods: the bridge on the river Aare at Aarburg”, Prestressed Concrete in th Switzerland, Report of the Swiss FIP Group to the 12 FIP Congress, Washington D.C., 1994
[6]
Cantieni, R. “Assessing a Dam's Structural Properties Using Forced Vibration Testing“, Proc. IABSE International Conference on Safety, Risk and Reliability Trends in Engineering, Malta, 2001
[7]
Cunha, A., Caetano, E. & Delgado, R. “Dynamic Tests on a Large Cable-Stayed Bridge. An Efficient Approach”, Journal Bridge Engineering, ASCE, Vol.6, No.1, p.54-62, 2001
[8]
Rodrigues, J. “Stochastic Modal Identification. Methods and Applications in Civil Engineering Structures”, Ph.D. Thesis (in Portug.), Univ. of Porto (FEUP/LNEC), 2004
[9]
Crawford, R. & Ward, H.S. “Determination of the Natural Period of Buildings”, Bulletin of the Seismological Society of America, Vol.54, No.6, p.1743-1756, 1964
[10]
Trifunac, M.D. “Comparison Between Ambient and Forced Vibration Experiments, Earthquake Engineering and Structural Dynamics, Vol.1, p.133150, 1972
[11]
Mc Lamore, V.R., Hart, G. & Stubbs, I.R. “Ambient Vibration of Two Suspension Bridges, Journal of the Structural Division, ASCE, Vol.97, N.ST10, p.2567-2582, 1971
[12]
Abdel-Ghaffar, A.M. “Vibration Studies and Tests of a Suspension Bridge”, Earthquake Engineering and Structural Dynamics, Vol.6, p.473-496, 1978
[13]
Felber, A. “Development of a Hybrid Bridge Evaluation System”, Ph.D. Thesis, University of British Columbia (UBC), Vancouver, Canada, 1993
[14]
Prevosto, M. “Algorithmes d’Identification des Caractéristiques Vibratoires de Structures Mécaniques Complexes”, Ph.D. Thesis, Univ. de Rennes I, France, 1982
[15]
Corrêa, M.R. & Campos Costa, A. “Ensaios Dinâmicos da Ponte sobre o Rio Arade”, in “Pontes Atirantadas do Guadiana e do Arade” (in Portuguese), ed. by LNEC, 1992
www.samco.org
Page 20 of 22
SAMCO Final Report 2006 F11 Selected Papers [16]
Brincker, R., Zhang, L. & Andersen, P. “Modal Identification from Ambient th Responses using Frequency Domain Decomposition”, Proc. 18 Int. Modal Analysis Conference, Kissimmee, USA, 2001
[17]
Brincker, R., Ventura, C. & Andersen, P. “Damping Estimation by Frequency th Domain Decomposition”, Proc. 19 Int. Modal Analysis Conference, San Antonio, USA, 2000
[18]
Brincker, R., Krenk, S., Kirkegaard, P.H. & Rytter, A. “Identification of the Dynamical Properties from Correlation Function Estimates”, Bygningsstatiske Meddelelser, Danish Society for Structural Science and Engineering, Vol.63, N.1, p.1-38, 1992
[19]
Asmussen, J.C. “Modal Analysis based on the Random Decrement Technique. Application to Civil Engineering Structures”, Ph.D. Thesis, Univ. Aalborg, 1997
[20]
Ibrahim, S.R. & Mikulcik, E.C. “A Method for the Direct Identification of Vibration Parameters from the Free Response”, The Shock and Vibration Bulletin, Vol.47, N.4, p.183-198, 1977
[21]
Fukuzono, K. “Investigation of Multiple-Reference Ibrahim Time Domain Modal Parameter Estimation Technique”, M.Sc. Thesis, Univ. Cincinnati, USA, 1986
[22]
Brown, D.L., Allemang, R.J. , Zimmerman, R. & Mergeay, M. “Parameter Estimation Techniques for Modal Analysis, SAE Technical Paper Series, N.790221, 1979
[23]
Vold, H., Kundrat, J., Rocklin, G.T. & Russel, R. “A Multi-Input Modal Estimation Algorithm for Mini-Computers”, SAE Technical Paper Series, N.820194, 1982
[24]
Peeters, B. “System Identification and Damage Detection in Civil Engineering”, Ph.D. Thesis, K.U.Leuven, Belgium, 2000
[25]
Van Overschee, P. & De Moor, B. “Subspace Identification for Linear Systems: Theory, Implementation, Applications”, Kluwer Academic Publishers, The Netherlands, 1996
[26]
Rodrigues, J., Brincker, R. & Andersen, P. “Improvement of Frequency Domain Output-Only Modal Identification from the Application of the Random Decrement rd Technique, Proc. 23 Int. Modal Analysis Conference, Deaborn, USA, 2004
[27]
Peeters, B., Vanhollebeke, F. & Van der Auweraer, H. “Operational PolyMAX for Estimating the Dynamic Properties of a Stadium Structure during a Football rd Game”, Proc. 23 Int. Modal Analysis Conference, Orlando, USA, 2005
[28]
Ventura, C.E. & Horyna, T. “Measured and Calculated Modal Characteristics of th the Heritage Court Tower in Vancouver”, Proc. 18 Int. Modal Analysis Conference, San Antonio, USA, 2000
[29]
Cunha, A., Caetano, E. & Moutinho, C. “Ambient Vibration Data Analysis of Heritage Court Tower. Contribution of University of Porto to IMAC Benchmark", th Proc. of the 18 Int. Modal Analysis Conference (IMAC), San Antonio, Texas, USA, 2000
[30]
Peeters, B., De Roeck, G., Caetano, E. & Cunha, A. “Dynamic study of the Vasco da Gama Bridge”, Proc. of the International Conference on Noise and Vibration Engineering, ISMA, Leuven, Belgium, 2002
[31]
Cunha, A., Caetano, E., Brincker, R. & Andersen, P. “Identification from the nd Natural Response of Vasco da Gama Bridge”, Proc. 22 Int. Modal Analysis Conference, Deaborn, USA, 2004
[32]
ARTeMIS Extractor Pro, Structural Vibration Solutions, Aalborg, Denmark
[33]
Magalhães, F. “Stochastic Modal Identification for Validation of Numerical Models”, M.Sc. Thesis (in Portuguese), Univ. Porto, FEUP, 2004
www.samco.org
Page 21 of 22
SAMCO Final Report 2006 F11 Selected Papers [34]
Flamand, O. & Grillaud, G. “Identification Modale du Viaduc de Millau”, Technical Report EN-CAPE 05.007 C-V0, CSTB, France, 2005
[35]
Magalhães, F., Caetano, E. & Cunha, A. “Operational Modal Analysis of the th Braga Sports Stadium Suspended Roof”, Proc. 24 Int. Modal Analysis Conference, St. Louis, USA, 2006
[36]
Rodrigues, J. & Campos Costa, A. “Dynamic Tests of the Structure for Extension th of the Madeira Island Airport”, Proc. 20 Int. Modal Analysis Conference, L.A., USA, 2002
[37]
Magalhães, F., Caetano, E. & Cunha, A. “Experimental Identification of Modal Damping Coefficients of the New Braga Stadium Cable-Roof”, Technical Report (in Portuguese), Univ. Porto, FEUP/VIBEST, 2004
[38]
Cunha, A. & Calçada, R. “Ambient Vibration Test of a Steel Trussed Arch th Bridge”, Proc. of the 18 Int. Modal Analysis Conference, San Antonio, Texas, 2000
[39]
Caetano, E. & Cunha, A. “Ambient Vibration Test and Finite Element Correlation of the New Hintze Ribeiro Bridge”, Proc. Int. Modal Analysis Conf., Kissimmee, USA, 2003
[40]
Magalhães, F., Caetano, E. & Cunha, A. “Ambient Vibration Test of Pinhão Bridge”, Technical Report (in Portuguese), Univ. Porto, FEUP/VIBEST, 2004
[41]
Caetano, E. & Cunha, A. “Experimental and Numerical Assessment of the Dynamic Behaviour of a Stress-Ribbon Bridge”, Structural Concrete, Journal of FIB, 5, No 1, pp.29-38, 2004
[42]
Caetano, E. & Cunha, A. “Study of the potential of collapse of a footbridge under vandal loads”, Proc. IABSE Symposium on Extreme Events, Lisbon, 2005
[43]
Teughels, A. “Inverse Modelling of Civil Engineering Structures based on Operational Modal Data”, Ph.D. Thesis, K.U.Leuven, Belgium, 2003
[44]
Brincker, R. & Andersen, P. “A way of getting Scaled Mode Shapes in Output st Only Modal Testing”, Proc. 21 Int. Modal Analysis Conference, 2003
www.samco.org
Page 22 of 22