Vladimir Katkovnik, Alessandro Foi, Karen Egiazarian, Jaakko Astola. Department of ...... wavelets by Kingsbury [65],[95], the spectral neighborM hood can be ...
International Journal of Computer Vision manuscript No. (will be inserted by the editor)
From local kernel to nonlocal multiple-model image denoising Vladimir Katkovnik, Alessandro Foi, Karen Egiazarian, Jaakko Astola Department of Signal Processing, Tampere University of Technology The date of receipt and acceptance will be inserted by the editor
Abstract We review the evolution of the nonparametric regression modeling in imaging from the local Nadaraya-Watson kernel estimate to the nonlocal means and further to transform-domain Þltering based on nonlocal block-matching. The considered methods are classiÞed mainly according to two main features: local/nonlocal and pointwise/multipoint. Here nonlocal is an alternative to local, and multipoint is an alternative to pointwise. These alternatives, though obvious simpliÞcations, allow to impose a fruitful and transparent classiÞcation of the basic ideas in the advanced techniques. Within this framework, we introduce a novel single- and multiplemodel transform domain nonlocal approach. The Block Matching and 3-D Filtering (BM3D) algorithm, which is currently one of the best performing denoising algorithms, is treated as a special case of the latter approach.
1 Introduction Suppose we have independent random observation pairs {zi , xi }ni=1 given in the form zi = yi + εi ,
(1)
where yi = y(xi ) is a signal of interest, xi ∈ Rd denotes a vector of “features” or explanatory variables which determines the signal observation yi , and εi = ε(xi ) is an additive noise, which we assume normally distributed with standard-deviation σ and mean zero. The problem is to reconstruct y(x) from {zi }ni=1 . In statistics, the function y is treated as a regression of z on x, y(x) = E{z|x}. In this way, the reconstruction at hand is from the Þeld of the regression techniques. If a parametric model cannot be proposed for y, then, strictly speaking, the problem is from a class of the nonparametric ones. Paradoxically, one of the most constructive ideas in nonparametric regression is a parametric local modeling. This localization is developed in a variety of
modiÞcations and can be exploited for the argument feature variables x, in the signal space y, or in the transform/spectrum domains. This parametric modeling “in small ” makes a big deal of difference versus the parametric modeling “in large”. The idea of local smoothing and local approximation is so natural that it is not surprising it has appeared in many branches of science. Citing [72], we can mention early works in statistics using local polynomials by the Italian astronomer and meteorologist Schiaparelli (1866) and the Danish actuary Gram (1879) (famous for developing the Gram-Schmidt procedure for orthogonalization of vectors). In the sixties-seventies of the twentieth century the idea became subject of an intensive theoretical study and applications: in statistics due to Nadaraya (1964, [79]), Watson (1964, [112]), Cleveland and Devlin (1979, [17]) and in engineering due to Brown (1963, [9]), Savitzky and Golay (1964, [93]), Katkovnik (1976, [52], 1985, [53]). Being initially developed as local in x, the technique obtained recently a further signiÞcant development with localization in the signal y domain as the nonlocal means algorithm due to Buades et al [10]. For imaging, the nonlocal modeling appeared to be extremely successful when exploited in transform domain. This is a promising direction where the intensive current development is focused. The scope of this paper is twofold. First, we outline the evolution of the nonparametric regression modeling from the local Nadaraya-Watson estimates to nonlocal means and further to the nonlocal block-matching techniques. Second, we present a constructive contribution concerning a novel multiple-model modeling for the nonlocal block-matching techniques. A particular instance of this idea has been implemented in the block-matching 3-D (BM3D) image denoising algorithm (Dabov et al. [19]), which demonstrates a performance beyond the ability of most modern alternative techniques (see, e.g., [66] or [108]). On one hand, the multiple-model interpretation of the BM3D algorithm highlights a source of this outstanding performance; on the other hand, this very
2
Vladimir Katkovnik et al.
Local
Nonlocal Pointwise
Section 2 (Local pointwise modeling)
Section 4 (Nonlocal pointwise modeling)
Signal-independent weights (Sections 2.1-2.4): Nadaraya-Watson [17],[9],[93],[79],[112], LPA [30],[52],[72], Lepski’s approach [69],[101],[85], LPA-ICI [41],[54],[57],[31], sliding window transform [117],[116];
Weighted means (Section 4.1): neighborhood Þlter [10], NL-means algorithm [10], Lebesgue denoising [113], Adaptive Weights Smoothing (AWS) [84],[86],[102], Exemplar-based [61],[62],[63], scale and rotation invariant [73],[120];
Signal-dependent weights (Section 2.5): Yaroslavsky Þlter [118], SUSAN Þlter [100], Sigma-Þlter [67], Bilateral Þlter [105],[24], kernel regression [103];
Higher-order models (Section 4.2): NL-means with regression correction [11], kernel regression [16];
Variational formulations (Section 2.6): ROF [91],[90], Anisotropic diffusion [83],[114],[115].
Variational formulations (Section 4.3): [64],[40],[39],[73],[74],[28],[106],[107].
Multipoint Section 3 (Local multipoint modeling) Overcomplete transform [80],[81],[23],[119],[43],[46]; shape-adaptive transform [37],[32]; learned bases: adaptive PCA [78], FoE [89], K-SVD [3],[27], MS-K-SVD [75]; TLS [47], BLS-GSM [87], OAGSM-NC [44].
Section 5 (Nonlocal multipoint modeling) Single-model approach (Section 5.1): Vectorial NL-means [10]; Multiple-model approach (Section 5.2): BM3D [19], Shape-Adaptive BM3D [20], BM3D with Shape-Adaptive PCA [21].
Table 1 Organization of the paper and classiÞcation of the algorithms.
performance suggests the potential of the modeling herein proposed. In what follows, the considered techniques are classiÞed mainly according to two main features: local/nonlocal and pointwise/multipoint. Here nonlocal is an alternative to local, and multipoint is an alternative to pointwise. We call an algorithm local if the weights used in the design of the algorithm depend on the distances between the estimation point x0 and observation points xs in such a way that distant points are given small weights, so that the size of the estimation support is practically restricted by these distances. An algorithm is nonlocal if these weights and the estimation support are functions of the differences of the corresponding signal (image intensity) values at the estimation point y 0 and observations ys . In this way, even distant points can be awarded large weights and the support is often composed of disconnected parts of the image domain. Note that the weights used in local algorithms can be dependent also on ys ,
but, nevertheless, the °weights are overall dominated by ° the distance °x0 − xs °. An important example of this speciÞc type of local Þlters is the Yaroslavsky Þlter [118], referred in Buades et al. [10,13] as a precursor of the nonlocal means. Let us make clear the pointwise/multipoint alternative. We call an estimator multipoint if the estimate is calculated for all observation points used by the estimator. These points can constitute an image block or an arbitrarily-shaped region adaptively or non-adaptively selected. In contrast to a multipoint estimator, a pointwise estimator gives the estimate for a single point only, namely x0 . To be more ßexible, we can say that the multipoint estimator gives the estimates for a set of points while the pointwise one is restricted to estimation for a single point only. The multipoint estimates are typically not the Þnal ones. The Þnal estimates are calculated by aggregating (fusing) a number of multipoint estimates, since typically many such estimates are available for each
From local kernel to nonlocal multiple-model image denoising
point (a common of many overlapping neighborhoods). In the pointwise approach the estimates are calculated directly as the Þnal ones. We found that the classiÞcation of the algorithms according to these two features: local/nonlocal and pointwise/multipoint is fruitful for giving an overview of this quickly developing Þeld. It is emphasized that this classiÞcation relies only on the basic ideas of the algorithms and on the principles that determine the algorithms’ design. Indeed, most of these algorithms are eventually implemented combining different ideas and features, which makes often impossible to impose a clear-cut and unambiguous taxonomy. Table 1 illustrates the proposed classiÞcation as well as the organization of this paper. The local approximations are well developed in terms of various approaches, theories and implementations, and are well documented in numerous papers and books (e.g., Yaroslavsky [118], Loader [72], Katkovnik et al. [57]). The nonlocal approximations being very successful are a comparatively novel direction where many aspects are only sketched and waiting for accurate formulation and study. In this paper we are focused on this emerging area of nonlocal modeling and estimation. We consider image denoising as a basic problem convenient for overview also of various approaches used for a plethora of other image processing problems including restoration/deblurring, interpolation, reconstruction, enhancement, compression, demosaicing, etc. In our review and classiÞcation, we have no pretension of completeness. The methods and algorithms that appear in Table 1, as well as others to which we refer throughout the text, are cited mainly to give few concrete examples of possible implementations of the general schemes discussed in the next four sections. This paper is a development and extension of the authors’ work presented in [59].
2 Local pointwise modeling 2.1 Pointwise weighted means The weighted local mean as a nonparametric regression estimator of the form X yˆh (x0 ) = gh (x0 − xs )zs , (2) s
wh (x − xs ) gh (x − xs ) = P , s wh (x − xs )
has been independently introduced by Nadaraya [79], as a heuristic idea, and by Watson [112], who derived it from the deÞnition of regression as the conditional expectation and using the Parzen estimate of the conditional probability density. It is convenient to treat this estimator as a zero-order local-polynomial approximation and obtain it as a min-
3
imizer for the windowed (weighted) mean-squares criterion: ˆ Cˆ = argminC Ih,x0 (C), yˆh (x0 ) = C, X wh (x0 − xs )[zs − C]2 . Ih,x0 (C) =
(3) (4)
s
The window wh (x) = w(x/h) deÞnes the neighborhood Xh of x0 used in the estimator. A scalar (for simplicity) parameter h > 0 gives the size of this neighborhood as well as the weights for the observations. In particular, for the Gaussian window we have w(x) = exp(−||x||2 ). 2.2 Pointwise polynomial modeling In the local polynomial approximation (LPA), the observations zs in the quadratic criterion (4) are Þtted by polynomials. The coefficients of these polynomials found by minimization of Ih,x0 serve as the pointwise estimates of y and its derivatives at the point x0 (e.g. Fan [30], Loader [72], Cleveland and Devlin [17], Katkovnik et al [57], Foi [31]). This sort of estimate is a typical example of what we call pointwise local estimate. Of course, for the zero-order polynomial we obtain the NadarayaWatson estimates (2). The polynomial order m and the window function w characterize the¡ LPA. for a point x0 , the ¢ SpeciÞcally, ¡ 0¢ 0 LPA estimate yˆh x of y x given the noisy signal z is deÞned as ¡ ¢ ¡ ¢ yˆh x0 = pˆh x0 , pˆh = argmin p∈Pm Ih,x0 (p) (5) X 2 0 wh (x − xs ) (z (xs ) − p (xs )) , Ih,x0 (p) = s
where Pm are the 2-D polynomials of order m. In other words, at every point x, the LPA provides the value pˆh (x) of the best Þtting polynomial pˆh of order m, with the window wh determining the localization of this Þt. For the regular grid of xs the LPA estimates are shift invariant and can be calculated by convolution against a kernel deÞned by the window wh and the polynomials Pm . Starting from a basic window function w, one can obtain LPA’s of different bandwidths/scales using scaled windows wh , where positive h can be treated as a scale parameter. The corresponding kernels, denoted as gh , give the estimate (5) in the convolutional form ¡ ¢ ¡ ¢ yˆh x0 = (z ~ gh ) x0 . (6)
The support of the window wh or equivalently of the kernel gh , is the estimator’s support. It is common practice to use compactly supported window functions. In this case, by using a basic window w of the unit length, we obtain that h coincides with the length of the window wh . Hence, window length (size), scale, and bandwidth become interchangeable concepts. Using symmetric, non-symmetric and directional windows we obtain
4
respectively the Þlter banks with the symmetric, nonsymmetric and directional supports scaled by the parameter h. A quite similar approach is used to obtain the differentiation kernels giving the derivatives based on scaled symmetric, non-symmetric, and directional neighborhoods. Details of this sort of ßexible Þltering techniques and their theoretical background can be seen, in particular, in Katkovnik et al. [57] and Foi [31]. The initial idea of the LPA is so simple and so appealing that it is not surprising that it is appeared in different modiÞcations and under different names, such as moving (sliding, windowed) least-squares, Savitzky-Golay Þlter, reproducing Þlters. Recently the LPA has been reintroduced as moment Þlters by Seuhling et al. [96] and as kernel regression by Takeda et al. [104]. The local approximation is not restricted to the polynomial functions. Any reasonable set of basis functions can be used, such as trigonometric functions, wavelets, splines, etc. Thus, the LPA framework can be used also for more general (non-polynomial) parametric approximations. A adaptive data-driven selection of h is a special topic, in particular, in the books by Fan [30] and Loader [72]. In what follows we consider some recent developments in this area. 2.3 Adaptive scale selection The choice of the scale parameter is crucial when dealing with noisy data, because it controls the amount of smoothing introduced by the local approximation. A large h corresponds to a larger window and therefore to smoother estimates, with lower variance and typically increased estimation bias. A small h corresponds to noisier estimates, less biased, and with higher variance. Thus, the scale parameter h controls the trade-off between bias and variance in the LPA estimates. An optimal selection of the invariant and varying h is a subject of many publications starting from the very early days of the LPA. Various fundamental approaches and formulations can be seen in the books by Fan [30], Loader [72] and [110] devoted to statistical nonparametric estimation. Two main groups of techniques are exploited in the nonparametric regression approach. The Þrst one is based on estimation of the bias and the variance with scale calculation using the theoretical formulas for the mean squared error of estimation. These sort of methods are known as “plug-in” methods. The second group of methods disregards the bias or formulas for the ideal scale selection and is instead based on quality-of-Þt statistics such as cross-validation, generalized cross-validation, Cp , Akaike criteria, etc., which are applied for model selection or direct optimization of the estimation accuracy. A successful implementation of the plug-in approach has been reported by several authors. Overall, these methods give smooth curves with good Þltering of random
Vladimir Katkovnik et al.
errors. However, the estimate bias depends on unknown high-order derivatives of the signal. As a result the algorithms are quite complex and have a number of parameters to be tuned, in particular for the estimation of these derivatives. Automatic window-size selectors with estimation of the higher-order derivatives of y have been developed and studied in [30]. The estimates at several window sizes are used in [92] in order to approximate the bias for estimation of the signal and the derivative. Similar ideas have been exploited in adaptive smoothers described in [94]. Most of publications concerning the quality-of-Þt approach are related to a data-driven global (constant) scale selection (e.g., [45], [49], [53], [99]). In this discussion and in what follows, the scale selection is deÞned by the accuracy criteria, with the main goal to achieve the optimal accuracy balancing the bias and the variance of estimation. These methods can be applied for scale selection for both estimation of image intensities as well as their derivatives. In this paper we are restricted to this accuracy-based scale selection only. Even more, we are focused on the automatic varying scale selection with the adaptive scales possibly taking different values from pixel to pixel. We note that there are very different scale-selection problems for the analysis of 2-D and 3-D surfaces, where the main goal is to Þnd and recognize singularities such as edges, ridges, discontinuities, etc. This sort of problems is particularly relevant in computer vision (e.g., [70], [71]). 2.4 Adaptivity of pointwise polynomial estimates The accuracy of the local estimates is quite dependent on the size and shape of the neighborhood used for estimation. Adaptivity of these estimates is a special subject that recently obtained a wide development concerning, in particular, the adaptive selection of the neighborhood size/shape or of the estimation weights. The main idea of the recent methods is to describe a greatest possible local neighborhood of every pixel in which the local parametric assumption is justiÞed by the data. These methods are mainly linked with the so-called Lepski’s approach (see, e.g., Lepski [68], Lepski et al. [69], Spokoiny [101], and Polzehl and Spokoiny [85]). One of the efficient versions of this approach is known as the LPA-ICI algorithm (Goldenshluger and Nemirovski [41], Katkovnik [54]). Here ICI stands for the intersection of conÞdence intervals (ICI) rule. A development of this technique for the adaptive image processing is presented in [57] and [31]. In [60], the approach is applied to the exponential class of distributions and in particular to the denoising of Poissonian images. A general theory of the adaptive image/signal processing developed for quite general statistical models can be seen in the book by Spokoiny [102].
From local kernel to nonlocal multiple-model image denoising
5
Fig. 2 Approximation of an ideal starshaped anisotropic neighborhood using adaptive sectors.
Fig. 1 The Intersection of ConÞdence Intervals (ICI) rule.
2.4.1 Intersection of conÞdence intervals (ICI) rule The ICI rule is a multiple hypothesis testing criterion used for the adaptive selection of the size (length/scale) of the LPA window. The aim is to achieve a balance between the bias and the variance such that the pointwise mean square error (MSE) is minimized. Let x0 be a Þxed¡ estimation ¢ ¡ ¢point/pixel. The LPA estimates yˆhj (x0 ) = z ~ ghj x0 (6) are calculated for a set H = {hj }Jj=1 of increasing scales h1 < · · · < hJ . The goal of the ICI is to select among these given esªJ ¡ ¢ © timates yˆhj (x0 ) j=1 an adaptive estimate yˆh+ (x0 ) x0 , ¡ ¢ ¡ ¢ h+ x0 ∈ H, such that yˆh+ (x0 ) x0 is close to an “ideal” ¡ 0¢ estimate yˆh∗ (x0 ) x which minimizes the MSE with¡ re-¢ spect to the variation of the scale h (note that h∗ x0 does not necessarily¡belong to H). Roughly speaking, ¢ the estimate yˆh+ (x0 ) x0 is the “best” among the given ones. The ICI rule is as follows: Consider the intersection of conÞdence intervals I j = Tj i=1 D i , where
Overall this pointwise-adaptive algorithm searches for a largest local vicinity of the point of estimation where the estimate Þts well to the data. The estimates yˆhj (x0 ) are calculated for a set of window sizes (scales) and compared. The adaptive scale is deÞned as the largest of those for which estimate does not differ signiÞcantly from the estimators corresponding to the smaller window sizes. Several algorithms are developed, based on this sort of adaptive estimators: denoising is the main, and most natural application, but also deconvolution and derivative estimation are problems where the adaptation can play a signiÞcant role in order to achieve an improved restoration performance [57].
© ª σ yˆhi (x0 ) = std yˆhi (x0 ) is the standard deviation of ¡ 0¢ yˆhi x , and Γ > 0 is a threshold parameter. Let j + be the largest of the indexes j for which I j is non-empty, ¡ ¢ I j + 6= ∅ and I¡j ++1 = ∅. The adaptive scale h+ x0 is ¢ deÞned as h¡+ x¢0 = hj + and the adaptive estimate is thus yˆh+ (x0 ) x0 . An illustration of the ICI is given in Figure 1. The standard-deviations of the LPA estimates can be easily 2 calculated from the kernel ° corresponding ° © 6 -norm ª of the as σ yˆhj (x0 ) = std yˆhj (x0 ) = σ °ghj °2 , where σ is the standard deviation of the noise in z. Since the scales are increasing, the standard-deviations are decreasing and the conÞdence intervals shrink as j increases. Therefore, in the intersections we are testing estimates with progressively lower variance. The rationale behind the ICI is that the estimation bias is not too large as long as the intersections are non-empty. In practice this means that the ICI adaptively allows the maximum level of smoothing, stopping before oversmoothing begins. Asymptotically, the LPA-ICI adaptive estimator allows to get a near-optimal quality of signal recovery [41].
2.4.2 LPA with anisotropic supports A main assumption for the design of the anisotropic estimator [33,55, 57] is that the optimal vicinity of the estimation point in which the model Þts the data is a starshaped neighborhood which can be approximated by some sectorial decomposition with, say, K non-overlapping sectors. Such a sectorial approximation is shown in Figures 2 and 3. This irregular shape of these neighborhoods and their sectorial approximation is a direct manifestation of the anisotropy of the underlying signal or, roughly speaking, that the signal smoothness is different at different points and along different directions. To replicate this behavior in our estimator, we use special directional kernels deÞned on a sectorial support. Anisotropy is enabled by allowing different adaptive scales for different directions. Thus, the ICI rule is exploited K times, once for each sector. In this way, we reduce a complex multidimensional shape adaptation problem to a number of scalar optimizations. The directional estimates corresponding to the adaptive-scale sectors are then combined into the Þnal anisotropic estimate. The resulting estimator is truly anisotropic,
h ¡ ¢ i ¡ ¢ Di = yˆhi x0 − Γ σ yˆhi (x0 ) , yˆhi x0 + Γ σyˆhi (x0 ) ,
Fig. 3 Anisotropic local approximations achieved by combining a number of adaptive-scale directional windows. The examples show some of these windows selected by the directional LPA-ICI for the noisy Lena and Cameraman images.
6
Vladimir Katkovnik et al.
and its support can have quite an exotic shape. It is highly sensitive with respect to change-points, and allow to reveal Þne elements of images from noisy observations, thus showing a remarkable advantage in the proposed strategy. Results and modiÞcations of this algorithm for different applications (including gradient estimation, deconvolution, inverse-halftoning, video denoising, and signal-dependent noise removal) can be seen in [55,33,34,56,36,35,29,36] and, in particular, in [31] and [57].
total variation as penalty. The success of this penalty stems from the fact that it allows discontinuous solutions and hence preserves edges while Þltering high-frequency oscillations due to noise. Several other methods are derived from the original ROF model by Meyer [77], Osher [82], Vese and Osher [109]. Nonlinear anisotropic diffusion Þlters have been introduced by Perona and Malik [83] and signiÞcantly studied and developed by many authors, particularly by Weickert [114], [115]. Various versions of these Þlters exist. The Þltered signal is deÞned as a solution of a partial differentiation equation of the form
2.5 Signal-dependent windows/weights There are a variety of works where the local weights wh (x0 − xs ) depend also on the observations zs . A principal difference of these algorithms versus the nonlocal ones is that all the signiÞcant weights are localized in the neighborhood of x0 . In particular, Smith and Brady [100] presented the SUSAN algorithm where the localization is enabled by the weights depending on the distances from x0 to the observation points xs and on the corresponding values of y: wh (x0 − xs , y 0 − ys ) = e−
||x0 −xs ||2 h2
− |y
0 −y |2 s γ
,
γ, h > 0.
Similar ideas are exploited in the Sigma-Þlter by Lee [67] and in the Bilateral Þlter by Tomasi and Manduchi [105] and by Elad [24]. These algorithms are local, mainly motivated by the edge detection problem where the localization is a natural assumption. Further development and interpretation of this sort of local estimator can be seen in Elad [24] and Barash [6]. In the works by Yaroslavsky [118] the localization of the weights is enabled by taking observations from a ball centered at x0 . The accuracy analysis of these algorithms can be seen in Buades et al. [10]. It this context, it is worth mentioning also the kernel estimator by Takeda et al. [103], which is a particular higher-order LPA estimator where the weights are deÞned as in the bilateral Þlter.
2.6 Variational formulations and diffusion Þltering A variety of methods for image denoising are derived by considering image processing as a variational problem where the restored image is computed by minimization of an energy functional. Typically, such functionals consist of a Þdelity term such as the norm of the difference between the true image and the observed noisy image and a regularization penalty term: J = λ||y − z||22 + pen(y).
(7)
One of the successful Þlters in this class is the RudinOsher-Fatemi (ROF) method [91], [90], which uses the
∂u(x, t)/∂t = div (g(∂u/∂x) · ∂u/∂x) , u(x, 0) = z(x), yˆT (x) = u(x, T ),
(8)
where div is the divergence operator and g is a scalarvalued nonnegative diffusivity function, such that g(0) = 1 and lim|x|→∞ g(x) = 0. The initial condition u (x, 0) is deÞned by the given noisy signal and the estimate yˆT (x) is a solution u (x, t) at the stopping time T . The time t plays a role of a smoothing (scale) parameter for the estimate, where larger t corresponds to stronger smoothing. The equation (8) is ill-posed and some regularization is required for the solution. There are natural relations between the nonlinear anisotropic diffusion and the variational approach, because the diffusion may be interpreted as a gradient descent for a suitable functional minimization. Links between the diffusion Þlters and variational settings with the penalty regularizations terms like (7) are subject of many mathematical publications. In connection with these works, we wish to mention the paper by Steidl et al. [97], where it is shown that for the one-dimensional case there is an equivalence between the total-variational diffusion, total-variational regularization, and soft wavelet shrinkage. The total-variation diffusion is of special interest, in particular because the corresponding equation is well posed [97]. A broad overview of these connections can be seen in the book by Chan and Shen [15]. All these algorithms belong to the class of local pointwise ones because the solution is achieved by means of diffusion equations typically based on local differential estimates.
3 Local multipoint modeling It is assumed in the above local modeling that for each pixel exists a neighborhood where the low-order polynomial model Þt the data. The order of this polynomial parametric model is Þxed and the parameters as well as the size/shape of this neighborhood are the main tool of estimation. Another principal point is that in the pointwise estimation the model parameters and the neighborhood are used in the pointwise manner in order to estimate the function for a single point only.
From local kernel to nonlocal multiple-model image denoising
In what we call the local multipoint estimation the modeling and estimation are very different. First of all, for each neighborhood or image patch we use full-rank high-order approximations with a maximum number of basis functions (typically non-polynomials). For the orthogonal basis functions, this modeling is treated as the corresponding transform-domain representation, with Þltering produced by shrinkage in the spectrum (transform) domain. Second, the estimates are calculated for all points in the neighborhood/patch, as opposed to the pointwise estimation which estimates a single point at a time. This makes the estimation to be multipoint. Third, the data are typically processed by overlapping subsets, i.e. windows, blocks or generic neighborhoods, and multiple estimates are obtained for each individual point. Overall, the estimation is composed of three successive steps: 1) data windowing (blocking, patching); 2) multipoint processing; 3) calculation of the Þnal estimate by aggregating (fusing) the multiple multipoint estimates. It is found that this sort of redundant approximations with multiple estimates for each pixel dramatically improves the accuracy of estimation.
3.1 Overcomplete transform domain modeling Let the signal be deÞned on a regular 2-D grid X. Consider a windowing C = {Xr , r = 1, . . . , Ns } of X with Ns blocks (uniform windows) Xr ⊂ X of size nr × nr such s that ∪N r=1 Xr = X. Mathematically speaking, this windowing is a covering of X. Thus, each x ∈ X belongs to at least one subset Xr . The noise-free data y (x) and the noisy data z(x) windowed on Xr are arranged in nr × nr blocks denoted as Yr and Zr , respectively. We will use Y and Z as notation for matrices of the true and noisy signals over X. Typically, the blocks are overlapping and therefore some of the elements may belong to more than one block. In what follows, we use transforms (orthonormal series) in conjunction with the concept of the redundancy of natural signals. Mainly these are the 2-D discrete Fourier and cosine transforms (DFT and DCT), orthogonal polynomials, and wavelet transforms. The transform, denoted as Tr2D , is applied for each window Xr independently as θr = Tr2D (Yr ) ,
£
= Dr Yr DrT
¤
r = 1, . . . , Ns , (9) where θr is the spectrum of Yr . The equality enclosed in square brackets holds when the transform Tr2D is realized as a separable composition of 1-D transforms, each computed by matrix multiplication against an nr × nr −1 orthogonal matrix Dr . The inverse Tr2D of Tr2D deÞnes the signal from the spectrum as Yr = Tr2D
−1
(θr ) ,
£
= DrT θr Dr
¤
r = 1, . . . , Ns .
7
The noisy spectrum of the noisy signal is deÞned as ˜θr = Tr2D (Zr ) ,
£
= Dr Zr DrT
¤
r = 1, . . . , Ns . (10) The signal y is sparse if it can be well approximated by a small number of non-zero elements of the spectrum θr . The number of non-zero elements of θr , denoted using the standard notation as ||θr ||0 , is interpreted as the complexity of the model in the block. If the blocks are overlapping the total number of the spectrum elements θr , r = 1, . . . , Ns , is larger (much larger) than the image size and we arrive to the overcomplete or redundant data approximation. This redundancy is an important element of the efficiency of this modeling overall. The blockwise estimates are simpler for calculation than the estimates produced for the whole image because the blocks are much smaller than the whole image. This is a computational motivation for the blocking. Another even more important point is that the blocking imposes a localization of the image on small pieces where simpler models may Þt the observations. These shorter models are easy to be compared and selected. Here we can recognize the basic motivation for the zero-order or low-order LPA, which is simple and for small neighborhoods can well Þt the data which globally can instead be complex and not allow a simple parametric modeling. By windowing we introduce a small segments exactly with the same reasons in order to use simple parametric models (expansions in the series deÞning the corresponding transforms) for overall complex data. A principal difference versus the pointwise estimation is that with blocks the concept of the center actually do not have a proper sense and the estimates are thus calculated for all points in the block. Thus, instead of the pointwise estimation we arrive to the blockwise (multipoint) estimation. For the overlapping blocks this leads to the next problem: the multiple estimates for the points and the necessity to aggregate (fuse) these multiple estimates in the Þnal ones. The data windowing can be produced in many different ways. In deterministic non-adaptive design, Þxed-size square windows cover the image entirely. One example of this sort of windowing is the sliding windowing where to each pixel in the image a window is assigned having this pixel as, say, its upper-left corner (e.g., [5], Ch. 5). The adaptive windowing can be produced as a result of image or spectrum analysis, resulting in windows having irregular location and shape, such as the anisotropic windows used by the Shape-Adaptive DCT estimator [37] described in Section 3.4.
3.2 Multipoint estimation For the white Gaussian noise in the observation model (1), the penalized minus log-likelihood maximization gives
8
Vladimir Katkovnik et al.
the estimates as ˆθr = argmin ||Zr − ϑ ³ ´ 2D −1 ˆ ˆ Yr =Tr θr ,
−1 Tr2D
(ϑ) ||22 /σ 2 + λ pen(ϑ),
(11)
where pen(ϑ) is a penalty term and λ > 0 is a parameter that controls the trade-off between the penalty and the Þdelity term. The penalty pen(ϑ) is used for characterizing the model complexity and appears naturally in this modeling, provided that the spectrum θr is random with a prior density p(θr ) ∝ e−λ pen(θr ) . The estimator (11) can be presented in the following equivalent form ˆθr = argmin ||˜θr − ϑ||2 /σ 2 + λ pen(ϑ), 2
A number of threshold operators ρ derived from (13) for different penalty functions are studied by Elad [25]. In this optimization approach the threshold function is deÞned by the assumed penalty function.
3.3 Aggregation At the points where the windows overlap, multiple estimates appear. Then, the Þnal estimate for each x is calculated as the average or a weighted average of these multiple estimates: P µ yˆr (x) yˆ(x) = P r r , x ∈ X, µ r r χXr (x)
(12)
ϑ
where the noisy spectrum is calculated as (10). If the penalty P is additive for the items of the spectrum ϑ, pen(ϑ) = i,j pen(ϑ(i,j) ), where ϑ(i,j) is an element of ϑ, then the problem can be solved independently for each element of the matrix ˆθr as a scalar optimization problem: ´2 ³ ˆθr,(i,j) = argmin ˜θr,(i,j) − x /σ 2 + λ pen(x). (13) x
This solution depends on ˜θr,(i,j) and λ, and it can be presented in the form ³ ´ ˆ θr,(i,j) = ρ ˜θr,(i,j) , λσ , (14)
where ρ is deÞned by the penalty function in (13). Hard and soft thresholding are particular cases of this sort of estimates (Donoho and Johnstone [22]): (1) Hard thresholding. The penalty is ||x||0 , i.e. ||x||0 = 1 if x 6= 0 and ||x||0 = 0 if x = 0. It can be shown that ³ √ ´ ˆ θr,(i,j) · 1 |˜θr,(i,j) | ≥ σ λ . (15) θr,(i,j) = ˜
In thresholding for the block of the size nr × nr the socalled universal threshold λ is deÞned depending on nr as λ = 2 log n2r . (2) Soft thresholding. The penalty function is pen(x) = ||x||1 = |x|. The function ρ in (14) is deÞned as ³ ´ ρ ˜ θr,(i,j) , σ = ˜θr,(i,j) ·
Ã
λσ 2 1− 2|˜θr,(i,j) |
!
.
(16)
+
The signal estimates in the windows are³ calculated ´ −1 ˆ from the spectrum estimates as Yˆr = Tr2D θr . These are multipoint (not pointwise) estimates as they are calculated for all pixels in the windows. There is a number of various threshold rules developed in mathematical statistics and derived from different speculations. Here we wish to mention also the control of error rate thresholding developed by Abramovich and Benjamini [1], Benjamini and Liu [7], and Abramovich et al. [2].
(17)
where yˆr is obtained by returning³the´window-wise (mul−1 ˆ tipoint) estimates Yˆr = Tr2D θr to the respective place Xr (and extending it as zero outside Xr ), µr are the weights used for these estimates, and χXr is the indicator function (characteristic function) of the set Xr . Although in many works equal weights µr = 1 ∀r are traditionally used (e.g., Coifman and Donoho [18], Hua and Orchard [48], Öktem et al. [80], [81]), it is a well established fact that the efficiency of the aggregated estimates (17) sensibly depends on the choice of the weights. In particular, using weights µr inversely proportional to the variances of the corresponding estimates yˆr is found to be a very effective choice, leading to a dramatic improvement of the accuracy of estimation (Egiazarian et al. [23], Yaroslavsky et al. [119]). The variances of yˆr are practically approximated as σ 2 multiplied by the sum of the squared shrinkage coefficients. In the case of thresholding, these coefficients are the rightmost factors in (15), (16). Thus, for hard thresholding, one may deÞne µr are the reciprocal of the number of non-zero elements of ˆθr,(i,j) . Guleryuz [43] studied the effects of different weights for aggregating blockwise estimates from sliding window DCT and demonstrated essential improvements of the algorithms. We wish to mention few related works. In [27], Elad and Aharon consider shrinkage in redundant representations and derive an optimal estimator minimizing a global energy criterion. This criterion can be written as ´ X³ 1 −1 ||Z − Y ||22 + ||Yr − Tr2D (ϑr ) ||22 + λ pen(ϑr ) , 2 σ r (18) where pen(ϑr ) = kϑr k0 . The algorithm proposed in [27] uses the alternative minimization with respect to both ϑr and Y with the initialization Yr = Zr and deÞning the spectrum estimates at the Þrst step as
E=
˜θr = arg min ||Zr − Tr2D −1 (ϑr ) ||2 + λ pen(ϑr ). 2 ϑr
(19)
From local kernel to nonlocal multiple-model image denoising
Given ˜θr the signal estimate is calculated as X 1 ||Yr − Yˆr ||22 , Yˆ = arg min 2 ||Z − Y ||22 + Y σ r ³ ´ −1 2D ˜ Yˆr = Tr θr .
(20)
Repeating this procedure we arrive to the recursive algorithm X 1 Yˆ (k) = arg min 2 ||Z − Y (k−1) ||22 + ||Yr − Yˆr(k−1) ||22 , Y σ r (21) ³ (k−1) ´ −1 ˜θ , k = 1, . . . Yˆr(k−1) = Tr2D r ˜θ(k−1) = arg min ||Y (k−1) − Tr2D −1 (ϑr ) ||2 + λ pen(ϑr ), r r 2 ϑr
(22) The Þrst equation in (21) deÞnes the aggregation in this algorithm and can be rewritten as the sample mean of (k−1) the windowed estimates yˆr (x) [27]: yˆ(k) (x) =
P (k−1) (x) zr (x)/σ2 + r yˆr P , 2 1/σ + r χXr (x)
x ∈ X.
(23)
The optimal estimator minimizing a global energy criterion can be achieved as a limit of this recursive procedure. However, as it is discussed above, the sample mean is not a good aggregation formula. It means that the recursive energy minimization used for the windowed estimates results in a procedure which can be improved. Indeed, the good denoising results shown in [27] are obtained mainly due to combining the recursive procedure (23) with a “dictionary update” stage, leading to the K-SVD algorithm [3]. The dictionary (i.e., the transform) is deÞned as a result of minimization of the energy E (18) with respect to Y , ϑr , complemented by optimization with respect to the parameters of the transform Tr2D . This approach gives the optimal single scale transform. A generalization of this idea for design of the multiscale transforms is produced in [75], yielding a further improvement in restoration quality. We wish to note that, when the dictionary is learned from the given noisy image, this stage may be treated as nonlocal, because blocks at other locations can inßuence the dictionary used at a particular location. The Adaptive Principal Components algorithm by Muresan and Parks [78] and Fields of Experts (FoE) algorithm by Roth and Black [88], [89] are other successful examples of this sort of methods using bases optimized with respect to the given image or set of images at hand. Hel-Or and Shaked [46] consider instead the optimization of the shrinkage function for a given Þxed simple averaging of the windowed estimates. The total least square (TLS) algorithm by Hirakawa and Parks [47] also takes advantage of multiple multipoint estimates. However, while in the above algorithms
9
Þltering is achieved by shrinkage in spectrum domain, in TLS the image block is modeled as a linear combination of the neighboring overlapping blocks where perturbations are allowed in the blocks in order to make the Þt possible. The window-wise estimates are then obtained from the linear combination which allow a Þt with minimal perturbations. Computationally the algorithm is very demanding but it demonstrates a good performance. This algorithm, though strictly a local one, has a few features which might resemble a nonlocal multipoint algorithm and we shall discuss some of these similarities in Section 5.2.2. As overcomplete estimation with multiple estimates for each pixel demonstrates high efficiency, the aggregation of these estimates becomes a hot topic because of two different reasons. The Þrst one is pragmatic, what is the best way to aggregate, and the second one is principal, why the aggregation can be so efficient. A ßow of publications on aggregation can be seen in mathematical statistics (e.g., Birge [8], Bunea et al. [14], Goldenshluger [42]). The problems studied in these works are mainly concentrated on comparison and selection of the best estimator from a given set of estimators. This setting is close to the classical model-selection problem. The principal difference of the effects we observe is that the aggregation of the windowed estimates results in an estimate which can be drastically better than any of the windowed estimates. In our opinion, this improvement follows from the fact that the windowed estimates have different supports and are adaptive with different estimation models. This variety of the estimates is a main base of the potential improvement for the aggregated estimate. Recently, Elad and Yavneh [26] proposed to generate a collection of multiple estimates by randomizing the Orthogonal Matching Pursuit (OMP) algorithm. Aggregation of these estimates demonstrates quite essential improvement of estimation. This is one of the mechanisms how the estimates suitable for fusing can be generated.
3.4 Shape-adaptive transform domain Þltering Here we highlight the overcomplete transform domain Þltering developed by Foi et al. [37], [32] where the windowing is adaptive. For each pixel in the image, we obtain the adaptive neighborhood where the LPA model Þts well to the data. These neighborhoods are similar to the ones illustrated in Fig. 3. Using in this neighborhood a shape-adaptive orthonormal transform and thresholding we obtain the estimation which is both order and neighborhood adaptive. What makes a difference versus the pointwise estimation in Section 2.4.2 is that these estimates are calculated for all pixel included in the adaptive neighborhood. Thus, we arrive to the multiple estimates where each of the estimates to be aggregated are shape and order adaptive. Overall, the algorithm has a
10
Vladimir Katkovnik et al.
clear intention to obtain the best possible estimates using all tools discussed above. The approach to estimation for a point x0 can be roughly described as the following four stage procedure: Stage I (spatial adaptation): For every x ∈ X, deÞne a ˜x+ of x where a simple low-order polynoneighborhood U mial model Þts the data; Stage II (order selection): apply some localized transform (parametric series model) to the data on the set ˜x+ , use thresholding operator (model-selection proceU dure) in order to identify the signiÞcant (i.e. nonzero) elements of the transform (and thus the order of the parametric model). Stage III (multipoint estimation): Calculate, by inversetransformation of the signiÞcant elements only, the cor˜ +. responding estimates yˆU˜x+ (v) of the signal for all v ∈ U x These yˆU˜x are calculated for all x ∈ X. Stage IV (aggregation): Let x0 ∈ X and Ix0 = {x ∈ X : ˜x+ } be the set of the centers of the neighborhoods x0 ∈ U which have x0 as a common point. The estimate n Þnal ¡ 0 ¢o 0 yˆ(x ) is calculated as an aggregate of yˆU˜x+ x . x∈Ix0
The details of this algorithm as well as its study can be found in Foi et al. [37], [32]. ModiÞcations of this algorithm have been produced for different imaging problems including deblurring, deringing and deblocking. All these algorithm show a very good performance among the best within the class of local estimators [66], [108], [37]. Illustrations of these results can be seen in Section 6. 3.5 Local estimation in spectral domain
The shrinkage operators from Section 3.2 treat the spectral coefficients as independent elements, essentially acting as diagonal operators. However, many transforms enjoy particular structures and correlations in their spectra, which can be exploited to improve the effectiveness of shrinkage. This is especially the case of wavelets, for which the amplitude responses of neighboring coefficients are strongly correlated. In case of redundant oriented multiscale transforms, such as the steerable pyramid by Freeman and Adelson [38], [98] or the complex wavelets by Kingsbury [65],[95], the spectral neighborhood can be seen in space for the same orientation and scale (i.e. for the same subband), or in orientation,for the same scale and spatial position, or in scale, for the same orientation and spatial position. For instance, let {θs } be a set of multiscale spectra of the image Y . Then, the local Þltering techniques could be applied to {θs } and the image estimate is obtained after inverse of the Þltered spectra {ˆθs }. This sort of methods are local despite the fact that the Þltering algorithms are applied in the spectrum domain. One of the most successful developments in this area is the Gaussian scale mixture (GSM) algorithm due Portilla et al. [87]. The algorithm is based on the steerable
pyramid multiscale image representation. The key idea of the approach is statistical modeling of the coefficients within multiscale and oriented spectra. The localization concerns the spectrum coefficients both at adjacent positions and at adjacent scales. The spectrum coefficients included in the local neighborhood are considered as the product of a Gaussian vector and a positive scalar multiplier. The latter deÞnes the local variance of the coefficients in the neighborhood, and thus models correlations between the coefficient amplitude. The Gaussian scale mixture is used as a distribution of the product of a Gaussian vector and a random scalar multiplier. The developed estimator is obtained by the Bayesian technique as a posterior mean where the Gaussian scale mixture deÞnes a prior for the random scalar multiplier. Hammond and Simoncelli [44] generalize this technique to the rotated neighborhoods. Then, the prior used in the Bayesian estimator concerns both the random scale and the direction, which is also assumed to be random. In implementation of this technique the spectra {θs } are windowed and the GSM processing is applied for each patch (window). The highpass and lowpass spectrum components are treated differently. What is important for our classiÞcation of the algorithms is that the Þltered spectrum components are calculated for entire patches. It means that the algorithm is multipoint (not pointwise). It is noted in [44] that "one could partition the transform domain into nonoverlapping square patches, denoise them separately, then invert the transform. However, doing this would introduce block boundary artifacts in each subband. An alternative approach, used is to apply the estimator to overlapping patches and use only the center coefficient of each estimate. In this way each coefficient is estimated using a generalized neighborhood centered on it." It is a way how the aggregation of the multipoint estimates in the Þnal one is solved (or avoided) in the GSM algorithms.
4 Nonlocal pointwise modeling 4.1 Nonlocal pointwise weighted means Similar to (3), a nonlocal estimator can be derived as a minimizer for X Ih,x0 (C) = wh (y 0 − ys )[zs − C]2 , y 0 = y(x0 ), (24) s
where the weights wh depend on the distance between the signal values at the observation points ys and the desirable point y 0 = y(x0 ). Minimization of (24) gives the weighted mean estimate in the form (neighborhood Þlter [10]): yˆh (x0 ) =
X s
wh (y 0 − ys ) gh,s (y 0 )zs , gh,s (x) = P . 0 s wh (y − ys ) (25)
From local kernel to nonlocal multiple-model image denoising
This estimator is local in the signal space y similar to (2) while it can be nonlocal in x depending on the type of the function y. The ideal set of observations for the noiseless data is the set © ª X ∗ = x : y(x) = y 0 = y(x0 ) , (26)
where y(x) takes the value y0 . The estimate (25) is the weighted mean of the observed zs and the only link with x0 goes through y 0 = y(x0 ). It is a principal difficulty of this estimate, as it requires to know the accurate y 0 and ys used in (25). In other words, to calculate the estimate we need to know the estimated signal. There are a number of ways to deal with this problem. Some of them are discussed in what follows. 4.1.1 Weights deÞned by pointwise differences The simplest and straightforward idea is replace ys be zs , then, X gh,s (z 0 )zs , (27) yˆh (x0 ) = s
wh (z 0 − zs ) , z 0 = z(x0 ). gh,s (z 0 ) = P 0−z ) w (z h s s
As the observed zs are used instead of the true values ys it results in a principal modiÞcation of the very meaning of the estimate (25). Indeed, provided a given weight gh,s , this estimate is linear with respect to the observations zs , while when we use ys = zs the estimate (27) becomes nonlinear with respect to the observations and the noise in these observations.
11
deÞned by the Euclidean distance between the observations z in V -neighborhoods of the points x0 and xs , V being a Þxed neighborhood of 0. The nonlocal means estimate is calculated as X wh,s (x0 , xs ) yˆh (x0 ) = gh,s (x0 )zs , gh,s (x0 ) = P . 0 s wh,s (x , xs ) s (30) The detailed review of the nonlocal means estimates with a number of generalizations and developments are presented by Buades et al. [10],[13]. From the results in [10], we wish to note the accuracy analysis of the estimator (27) with respect to both signal y and the noise. These asymptotic accuracy results are given for h → 0 and exploited to prove that the nonlocal mean estimates can be asymptotically optimal under a generic statistical image modeling. This sort of nonlocal estimates has been developed, more or less in parallel, in a number of publications with different motivation varying from computer vision ideas to statistical nonparametric regression (see also, e.g., Wei [113], Kervrann and Boulanger [61], [62], [63], Buades et al. [13] and references therein). Extension of the original approach including scale and rotation invariance for the data patches used to deÞne the weights are proposed in Lou et al. [73] and Zimmer et al. [120]. 4.1.3 Recursive reweighting The next natural idea is to use for the weights gh,s preprocessed observations zˆs , say, preÞltered by a procedure independent of (27): X gh,s (ˆ z 0 )zs , (31) yˆh (x0 ) = s
z 0 − zˆs ) wh (ˆ gh,s (ˆ z )= P . z 0 − zˆs ) s wh (ˆ 0
4.1.2 Weights deÞned by neighborhoodwise differences: NL-means algorithm The weights in the formula (27) are calculated as differences of individual noisy samples z 0 and zs . In practice, this can yield a quite different outcome from the difference between the true signal samples y 0 and ys , assumed in (24). The nonlocal means (NL-means) as they are introduced by Buades et al. [10] are given in a different form where these weights calculated over spatial neighborhoods of the points x0 and xs . This neighborhoodwise differences can be interpreted as a more reliable way to estimate y 0 − ys from the noisy samples alone. Then, the nonlocal mean estimate is calculated in a pointwise manner as the weighted mean with the weights deÞned by the proximity measure between the image patches used in the estimate. This estimation can be formalized as minimization of the local criterion similar to (24) X Ih,x0 (C) = wh,s (x0 , xs )[zs − C]2 , (28) s
with, say, Gaussian weights (as in [10]) 0
wh,s (x , xs ) = e
−
! v∈V
(z(x0 +v)−z(xs +v))2 h2
(29)
For the preÞltering we can exploit the same nonlocal average (27) zˆs = yˆh (xs ). Then the algorithm becomes recursive with successive use of the estimates for the weight recalculation: X (k+1) 0 (k) (x ) = gh,s (ˆ yh (x0 ))zs , x0 ∈ X, (32) yˆh s
(k)
(k)
yh (x0 ) − yˆh (xs )) wh (ˆ (k) gh,s (yh (x0 )) = P . (k) (k) yh (x0 ) − yˆh (xs )) s wh (ˆ
If the algorithm converges, the limit recursive estimate yˆh is a solution of the set of the nonlinear equations X gh,s (ˆ yh (x0 ))zs , x0 ∈ X, (33) yˆh (x0 ) = s
wh (ˆ yh (x0 ) − yˆh (xs )) gh,s (ˆ yh (x0 )) = P . yh (x0 ) − yˆh (xs )) s wh (ˆ
These estimates can be very different from (31), which can be treated as a Þrst step of the recursive procedure (32). We do not know results concerning the study of these estimates for the Þltering of z which are recursive (k) on yˆh . However, recursive equations of a similar style are considered by the methods referred in Section 4.3.
12
Vladimir Katkovnik et al.
4.1.4 Adaptive weights A different type of the algorithms called Adaptive Weights Smoothing (AWS) is developed by Polzehl and Spokoiny [84], [86]. The main idea of AWS is to describe in a data-driven way a maximal local neighborhood of every point in which the local parametric assumption is justiÞed by the data. The method is based on a successive increase of local neighborhoods around every point and a description of the local model within such neighborhoods by assigning weights that depend on the result of the previous step of the procedure. By expanding the local neighborhoods up to covering the whole image domain, we arrive to an adaptive nonlocal means Þlter. The numerical results [86] demonstrate that the AWS method is very efficient in situations where the underlying regression function allows a piecewise constant or piecewise smooth approximation with large homogeneous regions. The procedure is particularly successful in preserving contrast and edges, achieving optimal noise reduction inside large homogeneous regions.
where the proportionality factor depends on h and σ but not on z. Provided a change of the parameter h in the weight √ function wh for h2 + 2σ2 , we have w ˜h (z) ∝ wh (z), which makes this weight function legitimate for the use with noisy data zs instead of unknown ys . The larger value of h, coming from the change of parameter, means a larger window size and stronger smoothing, in some sense equivalent to data preÞltering.
4.2 Nonlocal pointwise higher-order models Use of the higher-order LPA in the local estimates is well known and well studied area (e.g., [57]). In particular, for the Þrst-order estimate we have the criterion and the estimate in the form X Ih,x0 (C0 , C1 ) = wh (x0 − xs )[zs − C0 − C1 (x0 − xs )]2, s
(35)
yˆh (x0 ) = Cˆ0 , (Cˆ0 , Cˆ1 ) = argmin Ih,x0 (C0 , C1 ),
4.1.5 Weights averaging: Bayesian approach There is an alternative idea how to deal with the dependence of the weights wh on the unknown signal y. Let us use the Bayesian rationale and replace the local criterion (24) by an a-posteriori conditional mean calculated provided that the given observations are Þxed: I˜h,x0 (C) = Ey {Ih,x0 (C)|zs , s = 1, . . . , N }.
C0 ,C1
where the weights are deÞned as in (2). Recall that Cˆ1 in (35) is an estimate of the derivative ∂y(x0 )/∂x. Let us try to use this Þrst-order LPA model in the context of the nonlocal means (24) and combine the weights depending on the distance between the signal values from (24) with the linear on x Þt for the observed zs from (35). Then the nonlocal criterion is of the form
(34)
Assume for simplicity that we consider the scalar case, d = 1, then ys are random and independent with the prior pdf p0 (ys ), then the conditional pdf of ys provided a given zs is calculated according to the Bayes formula: p(ys |zs ) = R
Ih,x0 (C0 , C1 ) =
s
0
Thus, (34) is easily calculated as I˜h,x0 (C) = XZ Z p(y0 |z0 )p(ys |zs )wh (y 0 − ys )[zs − C]2 dys dy0 = X s
w ˜h (z 0 − zs )[zs − C]2
2
In particular, for the Gaussian window wh (y) = tedious calculations show that 2
− 2(h2z+2σ2 )
w ˜h (z) ∝ e
,
(36) 0
Again Cˆ1 is an estimate of the derivative ∂y(x0 )/∂x. Accordingly to the used windowing the ideal neighborhood X ∗ is deÞned as in (26), i.e. it is a set of x where y(x) = y 0 . However, the derivative ∂y/∂x can be different for the points in this X ∗ and then the linear model C0 + C1 (x − xs ) does not Þt y(x) for all x ∈ X ∗ . Figure 4 illustrates a possible situation, where the set X ∗ includes all y(x) = y but the derivatives in this points have different signs. The ideal neighborhood should be different from (26) and include both the signal and derivative values ½ ¾ ∂y(x) ∂y(x0 ) ∗ 0 X = x : y(x) = y(x ), = . (37) ∂x ∂x
2
(zs −ys )2 1 p(ys |zs ) ∝ p(zs |ys ) = √ e− 2σ2 . 2πσ
s
wh (y 0 − ys )[zs − C0 − C1 (x − xs )]2 ,
y = y(x ).
p(zs |ys )p0 (ys ) . p(zs |ys )p0 (ys )dys
For the Gaussian observations model zs = N (ys , σ ) and p0 (ys ) = const., it gives
=
X
y √ 1 e− 2h2 2πh
It follows from this consideration that, for the class , of the nonlocal estimators, the windowing function wh should correspond to the model used in estimation and actually incorporate this model. For the linear model it can be done selecting the window function deÞning the
From local kernel to nonlocal multiple-model image denoising
13
Fig. 4 Local versus nonlocal supports for zero- and Þrst-order polynomial Þtting: local (2) III; nonlocal zero-order model (36) I∪II; nonlocal Þrst-order model (37)-(38) I.
distance in both the signal and signal derivative values. In particular as follows ³ ´ X 0 ) s) × wh1 (y 0 − ys )wh2 ∂y(x − ∂y(x Ih,x0 (C0 , C1 ) = ∂x ∂x s
(38)
2
× [zs − C0 − C1 (x − xs )] . In implementation of this estimation, the unknown ys and ∂y(xs )/∂x could be replaced by the corresponding estimates obtained from LPA or by independent estimates as it is discussed in the previous section. Figure 4 illustrates the differences between the neighborhoods used for estimation in the case of the local pointwise model (2) and the nonlocal zero and Þrst order models. The area III shows the local neighborhood for the local pointwise estimate deÞned by the window width parameter h. For the nonlocal zero-order modeling (36), the neighborhood is deÞned as a set of x values where |y − y 0 | ≤ ∆. In the Þgure this area is a deÞned as the union of all the subareas I and II. However, if the Þrst order model is used for the nonlocal modeling according to (37)-(38) at least the sign of the derivative ∂y/∂x should also be taken in consideration. if we ¡ Thus, ¢ say that for the desired neighborhoods ∂y x0 /∂x > 0, the estimation neighborhood is the union of the subareas I. In this sense, the nonlocal zero-order model does not distinguish between the subareas I and II. It has been observed that the nonlocal pointwise means, in particular of the form (24)-(25) can create large ßat zones and spurious contours inside smooth regions, i.e. the so-called “staircasing” or “shock” effects. In order to repair and avoid these undesirable effects, the nonlocal polynomial models of the Þrst and higher orders have been proposed by Buades, Coll, and Morel [11], [12]. Similar higher-order nonlocal algorithm has been reported in Chatterjee and Milanfar [16], where the polynomial approximations up to second order are used. The nonlocal polynomials models used in these papers are similar to (36), where standard weights depending only on the signal values (and not on the derivatives) are used. Thus, the polynomial modeling is not included in the window function as it is in (38).
Here we wish to note the work by Alexander et al. [4], where different models of self-similarity in images are studied, with particular emphasis on affine (i.e. Þrst order) similarity between blocks. It is interesting that, under some assumptions, the nonlocal estimates can behave similar to the PeronaMalik diffusion. It is proved by Buades, Coll, and Morel [11], [12] for the estimate (25) where the window wh is truncated Gaussian. This equivalence has a place provided that the width of the truncated Gaussian window and its standard deviation h are small and have the same order of magnitude. While in the above text we considered only polynomial expansions, of course, the higher-order modeling is not restricted to polynomials. The more general case using transforms is illustrated directly in the forthcoming Section 5 for nonlocal multipoint modeling.
4.3 Variational formulations The variational methods can be treated as local or nonlocal depending on whether a local or nonlocal penalty pen(y) is used in (7). The regularization involving only the signal and its derivatives evaluated at the same point results in Euler-Lagrange differential equations and definitely means the local type estimator. Recently, a novel class of the variational methods involving nonlocal penalty terms has been proposed (see Kindermann et al. [64], Gilboa and Osher [40], [39], Lou et al. [73], [74], Elmoataz et al. [28] and references therein). If the Euler-Lagrange equations are used for these methods they have a form of difference-integral equations. These new nonlocal methods are essentially motivated by the concept of the nonlocal means, used to deÞne nonlocal differential operators. One of the interesting results obtained in Kindermann et al. [64] is a derivation of the nonlocal means algorithms from a variational formulation. Let the penalty in (7) be of the form ! Z Ã 2 |y (x) − y (v)| pen(y) = g w(|x − v|)dxdv, (39) h2
14
Vladimir Katkovnik et al.
w > 0 is a window function, and g is a differentiable function. Minimization of (39) on y gives the equation Z ³ ´ 2 1 y(x) = y(v)w(|x − v|)dv, (40) g 0 |y(x)−y(v)| 2 h C(x) Z ³ ´ 2 C(x) = g 0 |y(x)−y(v)| w(|x − v|)dv. 2 h In particular, for g = 1 − exp(−x), it gives µ ¶ µ ¶ |y(x) − y(v)|2 |y(x) − y(v)|2 g0 = exp − . h2 h2 Equation (40) can be solved using the iterations yˆ(k+1) (x) = Z ³ (k) ´ 1 y (k) (v)|2 = yˆ(k) (v)w(|x − v|)du. g 0 |ˆy (x)−ˆ 2 h C(x) (41) The Þrst iteration of this algorithm with yˆ(0) = z can be interpreted as an integral version of the nonlocal means estimate (27) provided that the factor w(|x − v|) is constant. In this case, the corresponding estimator is nonlocal according to the deÞnition given in this paper. It is interesting to note also that these iterations look similar to the recursive procedure (32). Actually, the iterations (41) deal with the same problem of how to calculate weights depending on the unknown signal y. Let us go back to the formulation (7). Using (39)(40), we arrive to the equation derived in [64] and including the observations z y(x) = ¶ µ Z ³ ´ 2 1 0 |y(x)−y(v)| = y(v)w(|x − v|)dv . λz + g h2 C(x) (42) On a similar line, we wish to mention the works by Tschumperlé and Brun [106,107], where a mapping of the image into a high-dimensional space of patches is used in order to apply conventional regularization operators (e.g., Tikhonov regularization) in a nonlocal way.
5 Nonlocal multipoint modeling In this section we consider nonlocal estimates different from the ones discussed in Section 4.1 Þrst of all by use of the transforms enabling the adaptive high-order approximations of the windowed data. As in Section 3.1, we consider the signal Yj and observation Zj blocks corresponding to a given windowing. The transforms are deÞned and calculated for these blocks. Furthermore, it is assumed that there is a similarity between some of these blocks. As a measure of this similarity we use the Euclidean norm ||Yj − Yr ||22 . The distance between the blocks is deÞned by the window functions wh depending
Fig. 5 A simple example of grouping in an artiÞcial image, where for each reference block (with thick borders) there exist perfectly similar ones.
on the norms ||Yj − Yr ||22 . For instance, for the Gaussian window the distance between the blocks j and r is calculated similar to (29) as wh (j, r) = exp(−||Yj − Yr ||22 /h2 ).
(43)
Another principal difference versus Section 4.1 is that the estimates are not pointwise but multipoint, calculated for all points in the block. In this way we arrive to a set of estimates for each pixel and necessity to fuse them into the Þnal estimate by a special aggregation procedure. 5.1 Single-model approach Motivated by the pointwise nonlocal mean (24), we introduce a nonlocal multipoint estimator by the criterion X ° °2 IYr (ϑ) = wh (j, r) °Zj − T 2D −1 (ϑ)°2 + (44) j
+ λ pen(ϑ), ³ ´ wh (j, r) = wh kYj − Yr k22 .
Here, instead of y 0 , used in (24), we use the so-called reference-block Yr . The estimation is intended to be for the pixels of this reference block only. The wh is a weight function deÞning the correspondence of the block Yj to the reference-block Yr , ||Zj − T 2D −1 (ϑ) ||22 measures the discrepancy between the observed Zj and the model of the reference block T 2D −1 (ϑ), expressed through the spectrum parameters ϑ. The penalty term λ pen(ϑ) controls the complexity of the reference block model (e.g., the smoothness of the estimate). The term single-model means that in (44) the same model T 2D −1 (ϑ) is exploited to Þt all blocks Zj . For an orthonormal transform, (44) can be presented in spectral variables only as X wh (j, r)||˜θj − ϑ||22 + λ pen(ϑ), (45) IYr (ϑ) = j
wh (j, r) = wh (||θj − θr ||22 ).
From local kernel to nonlocal multiple-model image denoising
15
Fig. 6 Illustration of grouping blocks from noisy natural images corrupted by white Gaussian noise with standard deviation 15 and zero mean. Each fragment shows a reference block marked with “R”and a few of the blocks grouped with it.
Here and in what follows, it is essential that a common transform operator is applied to all blocks in the group, i.e. the same transform T 2D is used for r and for all j. We resort to orthonormal transforms mainly to simplify the formulation. However, the approach can be easily generalized to non-orthogonal transforms, either biorthogonal or redundant ones. In practice, for calculation of the weights wh (||Yj − Yr ||22 )|| we replace the unknown ||Yj − Yr ||22 by the observed ||Zj − Zr ||22 . Then wh (j, r) = wh (||˜θj − ˜θr ||22 ), where ˜ θj = T 2D (Zj ), ˜θr = T 2D (Zr ) are noisy spectra, or use instead of Yj and Yr a preÞltered version of the observed Zj and Zr . Let us assume that the weights wh (j, r) are given. It can be veriÞed that (45) can be rewritten as X wh (j, r)||¯θr − ϑ||22 + λ pen(ϑ) + const, (46) IYr (ϑ) = j
where ¯ θr =
X j
wh (j, r)˜θj /
X
wh (j, r),
(47)
j
is the weighted mean of the blocks’ spectra and const is independent of ϑ. Then the minimization of IYr (ϑ) and estimation for the reference block becomes ˆ = arg min ||¯θr − ϑ||2 + λr pen(ϑ), ϑ 2 ϑ ³ ´ ˆ . Yˆr = T 2D −1 ϑ
(48) (49)
P where λr = λ/ j wh (j, r). If the penalty is additive with respect to the components of ϑ, minimization in (48) is reduced to the scalar one and using (14) the results can be given in the form ˆ = arg min ||¯ θr − ϑ||22 + λr pen(ϑ) = ρ(¯θr , λr ). ϑ ϑ
(50)
ˆ is a two-step procedure. Thus, the estimation of ϑ First, calculation of the weighted mean (47) and, second, thresholding (50). After that, the estimate Yˆr is calculated according to formula (49). In practice, only the blocks with larger weights wh (j, r) are included in calculations of the weighted mean (47). A set of blocks selected for estimation is called a group corresponding to the reference block Yr . Usually this selection is deÞned by Kr∆ = {j : ||Yj − Yr ||22 ≤ ∆},
(51)
where Kr∆ is the set of indexes of the blocks in the group and ∆ > 0 is a threshold parameter. Figures 5 and 6 illustrate the concept of grouping. The mean (47) can be given in the form X X ¯θr = wh (j, r)˜θj / wh (j, r). (52) j∈Kr∆
j∈Kr∆
The aim of this grouping is a joint processing of the windowed data in the group. Once ¯θr is found, the thresholding is performed according to (50) with X λr = λ/ wh (j, r). j∈Kr∆
In principle, one can incorporate the grouping (51) in the deÞnition of the window function wh (replacing wh with its¡ product against the indicator window func¢ tion χ[0,∆] ||Yj − Yr ||22 ). However, in practice, a binary indicator is often used instead of the window function, deÞned as follows: ¡ ¢ wh (||Yj − Yr ||22 ) = χ[0,∆] ||Yj − Yr ||22 . (53) In this case, (52) simpliÞes to X 1 ¯θr = ˜θj , λr = λ/#(K ∆ ), r ∆ #(Kr ) ∆ j∈Kr
(54)
16
Vladimir Katkovnik et al.
where #(Kr∆ ) is the cardinality of the set Kr∆ for the reference block Yr . The Þnal estimate of the signal is obtained from the reference estimates ¯θr according to the aggregation formula (17). Different versions of the considered approach can be developed. First, various estimates of unknown Yj and Yr can be used in the block’s weighting/grouping rule; second, different metrics for comparison of this estimates and the weights wh (||Yj −Yr ||22 ) in the estimates. Finally, various forms of shrinkage can be applied to the blockwise estimates ˜ θr before and after averaging in (54). We wish to note that already in [10], a blockwise version of nonlocal means (vectorial NL-means) are suggested. However, it is done only for original spatial domain data without Þltering in the spectrum domain enabled in the above estimation using penalization. In general, the described approach corresponds to what we may call a single (parametric) model approach, because for each group of blocks a unique parametric model (in the form T 2D −1 (ϑ) in (44)) is used, where the parameter ϑ is taking values that will Þt for all grouped blocks. It results in a speciÞc use of this blockwise estimates in the group where they are combined as a sample mean or as a weighted mean estimates similar to (54). As it is already mentioned in the previous subsection, the weighted means in the form (17) allows signiÞcantly improve the multipoint estimate, in particular using the inverse variances of the estimates as the weights.
where ˜θj = T 2D (Zj ). Only the blocks with the largest weights wh (j, r) are included in calculations of the criterion (56). Again, we use the term group to indicate this set of blocks. As in (51), Kr∆ denotes the set of indexes of the blocks in the group corresponding to the rth reference block. We have IYr ({ϑj }j ) = ³ ´ X wh (j, r)||˜θj − ϑj ||22 + λ pen {ϑj }j∈K ∆ . = r
j∈Kr∆
(57)
Here, if the penalty term is additive with respect to j, the minimization of IYr is trivialized and the very meaning of the group is lost, because the solution is obtained by minimizing independently for each j. As a matter of fact, once a multiple-model group is assembled, it is the penalty term that should establish the interaction between different members of the group. We propose a special ßexible way in order to install this interaction and call it collaborative Þltering. 5.2.1 Collaborative Þltering For transparency, let us simplify again the weights w to an indicator of the form (53). In this way, the criterion (57) takes the form ³ ´ X IYr ({ϑj }j ) = ||˜θj − ϑj ||22 + λ pen {ϑj }j∈K ∆ . r
j∈Kr∆
5.2 Multiple-model approach: collaborative Þltering In this section we introduce the nonlocal multiple-model estimation where individual (parametric) models are used for each block in the group. We use the same T 2D -basis functions for all blocks, which makes reasonable a comparison of the corresponding block-spectra. In the single-model approach (44), for each block, the observed Zj are Þtted by T 2D −1 (ϑ), where ϑ is the same for all j. Let us now assume that, in this Þtting, ϑ can take different values ϑj for different Zj selected for a given reference block Zr . Then, the criterion (45) is changed and we arrive to the following multiple-model one: IYr ({ϑj }j ) = (55) ³ ´ X wh (j, r)||Zj − T 2D −1 (ϑj ) ||22 + λ pen {ϑj }j . = j
¢ ¡ Here pen {ϑj }r means that the penalty is imposed on all spectra ϑj used for the reference block r. In the transform domain it gives ³ ´ X IYr ({ϑj }j ) = wh (j, r)||˜θj − ϑj ||22 +λ pen {ϑj }j . j
(56)
(58) ˜ r = {˜θj }j∈K ∆ be the set of T 2D Let us consider Θ r spectra in the group, which is treated as 3-D array, where j is the index used for the third dimension. Apply a 1D orthonormal transform T 1D with respect to j. In this way we arrive to a groupwise 3-D spectrum of the group as ˜r = T 1D (Θ ˜ r ). Ω (59) Consistent with this representation, we replace the penalty ³ ´ pen {ϑj }j∈K ∆ with an equivalent penalty pen(Ω), where r Ω = T 1D ({ϑj }j∈Kr∆ ) is the corresponding 3-D spectrum obtained by applying the 1-D transform T 1D on the collection of 2-D spectra {ϑj }j∈Kr∆ . We denote the 3-D transform obtained by the composition of T 1D and T 2D as T 3D . We use this 3-D spectrum representation as a special model of data collected in this group, with the penalty pen(Ω) deÞning the complexity of the data in the group: ˜r − Ω||22 + λ pen(Ω). IY (Ω) = ||Ω r
Then, the estimation of the true Ωr is deÞned as ³ ´ ˜r − Ω||22 + λ pen(Ω) , ˆr = argmin ||Ω Ω Ω ³ ´ ˆ ˆr , ˆ Θr = {θr,j }j∈Kr∆ = T 1D −1 Ω ³ ´ Yˆr,j = T 2D −1 ˆθr,j .
(60)
(61)
From local kernel to nonlocal multiple-model image denoising
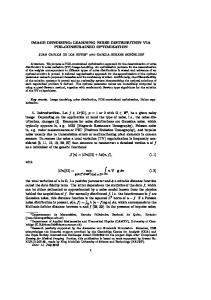
Again, if the penalty pen(Ω) is additive with respect to the components of Ω, the minimization in (60) is scalar and independent for each element of Ω; thus, it ˜r . The consecutive can be solved by thresholding of Ω 1D −1 2D −1 T and T inverse transforms return Þrst the esˆ r = {ˆ timates Θ θr,j }j∈Kr∆ of T 2D -spectra of the blocks in the group, and hence the multipoint estimates Yˆr,j of these blocks. Because these estimates can be different in different groups, we use the double indexes for the signal estimates Yˆr,j , where j stays for the index of the block and r for the group where these estimates are obtained. Let us summarize speciÞc features of the multiple modeling used in this section versus the single-model approach. First, the Þltering (thresholding) in the spectrum domain gives individual estimates for each block in the group. Note that in the single-model group of the previous section a unique estimate is calculated and used for the reference-block only. Second, an essential difference exists in how the data in the group are processed. The sample mean or weighted mean estimate (54) treats the data in the group as relevant (reliable) to the signal estimated for the reference block only. Contrary to it, the multiple-model approach produces individual estimates for all participants of the group (collaborative Þltering), where the joint spectrum ˆr is exploited in order to improve the estimates for in Ω each of the blocks in the group. Thus, we obtain a more ßexible technique where, say, an erroneously included block is not able to damage seriously the estimates of other blocks and itself could not be damaged by data from other blocks. As a result of the groupwise estimation, we obtain multiple estimates for each x in X and the Þnal signal estimate is calculated by fusing these blockwise estimates in a single Þnal one. The main formula used for this aggregation is the weighted mean (17). 5.2.2 Implementation: BM3D algorithm Assuming the indicator window function (53), the multiple model approach is implemented as the Block-Matching and 3-D Filtering (BM3D) algorithm by Dabov et al. [19]. In this case, the weights wh (j, r) are the same for the all blocks in the group. The algorithm has the following main steps: — Grouping: for a given reference block Xr similar blocks Xj are selected and arranged in 3-D arrays. The idea of the grouping is illustrated in Figure 5 where the perfectly identical blocks are collected in the corresponding 3-D arrays/groups. For noisy data this grouping makes the element-wise averaging (i.e. averaging between pixels at the same relative positions) an optimal estimator. In this way, we achieve an accuracy that cannot be obtained by processing the separate blocks independently. If non-identical fragments are collected within the same group, averaging
17
is no longer optimal. Therefore, a Þltering strategy more effective than averaging should be employed. The grouping for real data is demonstrated in Fig 6. — 3-D collaborative Þltering in the spectrum domain: 3D spectrum (59) is calculated for the grouped data; this spectrum is thresholded (Þltered) according to (60); the Þltered 3-D spectrum is inverted to the 3-D signal estimate (61) and the 2-D block-wise estimates Yˆr,j are returned to the original places of these blocks; — Aggregation: the Þnal estimates are calculated as the weighted means over all block-wise estimates overlapping at the point x P P ˆ r j µr,j Yr,j (x)χXj P P yˆ(x) = , x ∈ X, (62) r j µr,j χX j
where the weights µr,j are calculated as the inverse variances of the estimates Yˆr,j (x).
Also this algorithm exploits two similar stages for 3-D spectrum Þltering, one based on hard-thresholding, as it is deÞned by (60), and another using the empirical Wiener Þltering instead of hard-thresholding. During the second stage, the estimate yˆ from the Þrst stage is exploited also to improve the accuracy of the blockmatching. Details of the algorithm is documented in Dabov et al. [19] and Matlab codes of the algorithm are available online1 . In particular, in [19] we discuss and analyze the impact of the choice of the T 2D and T 1D transforms to the effectiveness of the algorithm. It turns out that the algorithm is rather insensitive to this choice, as long as T 1D includes a constant basis function (i.e. it provides what is called a DC term). The strength of BM3D is largely conÞrmed by numerous experiments [19], [108], [66]. The collaborative Þltering is a key element of the multiple-model approach overall. In the group similar blocks are collected. This similarity means that the grouparray allows a quite sparse representation in the spectrum domain and this high-sparsity means that only few spectrum elements can be taken as active non-zero. The sparsity in 3-D spectrum domain is much higher than it can be achieved for 2-D block-wise spectra. It enables a much stronger noise attenuation using group spectra compared with what could be achieved using 2-D blockwise spectra. Figure 7 illustrates distributions of the active elements in 3-D and 2-D spectra after the hard-thresholding of the 3-D spectrum: after shrinkage there remain only few nonzero coefficients in the 3-D spectrum. This sparsity is due both to decorrelation within each grouped block operated by the T 2D (intra-block decorrelation) and to decorrelation across the corresponding spectral components of the block operated by the T 1D (interblock decorrelation). After applying the T 2D −1 inverse 1
http://www.cs.tut.Þ/~foi/GCF-BM3D/
18
Fig. 7 Illustration of the sparsity in collaborative hardthresholding. After shrinkage, the remaining coefficients are mostly concentrated around the DC term of the T 3D spectrum, which is located at the upper-left corner in the top layer of the T 3D -spectrum. However, few other coefficients representing the inter-block differences are also present in the lower layers of this spectrum. The inversion of T 3D can be computed either by inverting Þrst T 2D and then T 1D , or vice versa. If we consider the stack with the T 1D -spectra, we notice that these are all typically nonzero (since they can be identically zero only when the corresponding layer in the T 3D -spectrum has no nonzero coefficients after shrinkage) but they are nevertheless T 2D -sparse (since they are produced by the few coefficients found in the corresponding layer in the T 3D -spectrum). Each block estimate in the image domain is obtained as a linear combination of the layers in the stack of the T 1D -spectra. These block estimates are typically not T 2D -sparse (since they can be T 2D -sparse only when the corresponding layer in the stack of the T 2D -spectra has very few nonzero coefficients).
transform, we obtain a number of intermediate block estimates (the red stack at the top-right of the Þgure). Each of these is obviously T 2D -sparse. The blockwise estimates (the purple stack at the bottom-right of the Þgure) are obtained by applying the T 1D −1 inverse transform on the intermediate block estimates. As a matter of fact, each one of the blockwise estimates is calculated as a linear combination of the intermediate estimates, where the coefficients of the linear combination are simply the coefficients of one of the T 1D basis elements. Note that the blockwise estimates are not necessarily T 2D -sparse, as it is illustrated in the Þgure. In a very broad sense, the success of BM3D algorithm supports the idea that in multipoint image estimation a weighted average of a few sparse estimates is better than single sparse estimate alone. This issue, but for different type of the algorithm, is discussed by Elad and Yavneh [26].
Vladimir Katkovnik et al.
In the single-model algorithm we have a penalty that enforces sparsity on a single estimate, whereas in the multiple-model the sparsity is enforced for the group as a whole but not on the individual blockwise estimates, which are instead a linear combination of intermediate blockwise estimates that are sparse. On this point, it is also interesting to return to the TLS algorithm by Hirakawa and Parks [47]. This algorithm builds a group by taking neighboring overlapping blocks to a given reference one. The idea is that the reference block can be seen as a linear combination of the grouped blocks. This Þtting is formalized using TLS, which is based on the assumption that all blocks in the group can be treated as perturbed by some noise. It is known that TLS allows to minimize the norm of this perturbation and this yields an estimate for the reference block. The authors generalize this approach to the case when the grouped blocks are used for Þtting a few of them treated as a set of reference blocks. It might seem that in this way a joint groupwise processing is achieved, similar to some extent to the presented collaborative Þltering. However, this similarity is quite superÞcial and even misleading. Firstly, while TLS produces these estimates for only a few blocks in the group, the collaborative Þltering gives the estimates for all blocks. In particular, collaborative Þltering works in a symmetrical fashion, i.e. all blocks are treated as equal partners in the collaborative Þltering, whereas in TLS there a big deal of difference between the Þtted blocks and observation blocks. In TLS the Þltering follows by Þtting each reference block using a single coefficient for each of the observation blocks. Contrary to it, the collaborative Þltering is enabled by the spectral representation of the group in 3-D space. TLS cannot exploit the sparsity of the transform domain representation and its noise suppression ability is thus very limited. In the collaborative Þltering framework, this would correspond to naively shrinking all 2-D spectrum coefficients on a layer of the 3-D spectrum using exactly the same constant. In the light of what discussed in the preceding sections, the estimation quality of BM3D can be improved by introducing additional adaptivity in the algorithm. 5.2.3 BM3D algorithm with adaptive-shape neighborhoods The existence of mutually-similar patches is, as illustrated in Figure 6, a characteristic feature of natural images. Due to this, the above BM3D algorithm can generally achieve an excellent denoising accuracy. However, the assumption that the block should be square is very artiÞcial. By replacing Þxed-size block transforms with adaptive-shape transforms, we can obtain a more ßexible tool with a potential for better denoising performance. This is done by Dabov et al. [20]. The algorithms uses grouping of adaptive-shape neighborhoods whose surrounding square supersets have been found similar by a block-matching procedure. The data deÞned
From local kernel to nonlocal multiple-model image denoising
on these grouped neighborhoods is stacked together, resulting in 3-D structures which are generalized cylinders with adaptive-shape cross sections. Because of the similarity, which follows from the matching, and because of the adaptive selection of the shape of the neighborhoods, these 3-D groups are characterized by a high correlation along all the three dimensions. A 3-D decorrelating transform is computed as a separable composition of the Shape-Adaptive DCT (SA-DCT) and a 1-D orthonormal transform, and subsequently attenuate the noise by spectrum shrinkage with hard-thresholding or Wiener Þltering. Inversion of the 3-D transform produces individual estimates for all grouped neighborhoods. These estimates are returned to their original locations according to the very idea of the collaborative Þltering, and aggregated with other estimates coming from different groups. Overall, this method generalizes two existing tools: the BM3D Þlter, which uses grouping of Þxed-size square blocks, and the pointwise SA-DCT Þlter (Section 3.4), which exploits shrinkage on the adaptive-shape supports. It is shown in [20] that the developed method inherits the strengths of both Þlters, resulting in a very effective and ßexible tool for image denoising.
5.2.4 BM3D algorithm with shape-adaptive PCA A proper selection of the transform is crucial element for ensuring the success of the transform-based methods. This problem, known under different names as best basis, dictionary, or prior selection, has been a subject of intensive study from the very beginning of the development and application of estimation/approximation methods. In particular, the use of bases adaptive to the data at hand is of special interest. As a general reference to the problem, we wish to mention such popular techniques as Basis Pursuit [76], Matching Pursuit and Orthogonal Matching Pursuit [76], Principal Component Analysis (PCA) [51], and Independent Component Analysis (ICA) [50]. From recent developments we wish to note the techniques close to the problems discussed in this paper such as Fields of Experts [88], [89] and K-SVD algorithms for single [3] and multiscale [75] sparse representations, where special sets of image or images patches are used for the basis selection. Curiously, it is shown in [19] that BM3D is comparatively insensitive to the basis (transform) selection. However, this conclusion concerns the selection of a priori Þxed bases. The latest version of BM3D algorithm incorporating a shape-adaptive PCA as part of the 3-D transform is proposed by Dabov et al. [21]. For a 3-D group of adaptive-shape image patches, a shape-adaptive PCA basis is obtained by eigenvalue decomposition of an empirical second-moment matrix computed from these patches. Hence, the overall 3-D transform is a separable composition of the PCA (applied on each image patch) and a Þxed orthogonal 1-D transform in the third dimension.
19
The use of a data-driven adaptive transform for the collaborative Þltering results in a further improvement of the denoising performance, especially in preserving image details and introducing very few artifacts [21]. To the best of our knowledge, this new algorithm is currently achieving the highest denoising quality to date. 6 Experimental comparison To complement the mostly theoretical discussions of the previous sections, we provide here an experimental comparison of some of the cited techniques. In particular, we consider the BM3D Þlter by Dabov et al. [19] and its modiÞcations with shape-adaptive DCT (SA-BM3D) [20] and shape-adaptive PCA (BM3D-SAPCA) [21], the SA-DCT Þlter by Foi et al. [37], the K-SVD algorithm by Aharon and Elad [3] and its multiscale extension (MSK-SVD) by Mairal et al. [75] , the TLS algorithm by Hirakawa and Parks [47], the BLS-GSM algorithm by Portilla et al. [87] and its orientation-adaptive extension (OAGSM-NC) by Hammond and Simoncelli [44], the NL-means by Buades et al. [10], the Fields of Experts (FoE) Þlter by Roth and Black [88], [89], the Structure Adaptive Filter (SAFIR) by Kervrann and Boulanger [61], and the Anisotropic LPA-ICI by Katkovnik et al. [55] and its recursive implementation by Foi et al. [33]. The algorithms2 are applied on a set of 10 different test images corrupted by additive white Gaussian noise3 with standard deviations σ = 5, 15, 20, 25, 35 (thus a total of 50 noisy images). The comparison is made in terms of both PSNR and mean structural similarity index map (MSSIM) [111] and is presented in Figures 8 and 9 and in Tables 2 and 3. We can see that the BM3DSAPCA overcomes the other methods, typically achieving a PSNR about 0.2 dB higher than that of BM3D, SABM3D, or MS-K-SVD. The latter three achieve roughly the same results and are followed by the SA-DCT Þlter and K-SVD, which are performing slightly better than the GSM, SAFIR, and TLS methods. Neither the FoE nor relatively simple algorithms such as the LPA-ICI and NL-means appear to be competitive. Overall, the MSSIM results are roughly consistent with the PSNR ones with the only exception of TLS, which shows a relative performance in terms of MSSIM slightly higher than in terms of PSNR. Let us note that the three algorithms based on the collaborative Þltering paradigm occupy the top-three places also in this comparison. The difference in visual quality between the various methods can be inspected in the examples shown in Fig2
The implementations by the respective authors are used for all experiments. 3 The noisy observations are generated with a Þxed initialization for the pseudo-random noise generator, according to the following Matlab code: randn(’seed’,0); z=y+sigma*randn(size(y));
20
ures 10 and 11. Relatively high noise standard deviations (σ = 35 and σ = 25) are used in order to emphasize the differences in the estimates by each method. From the Þgures, we observe that the BM3D-SAPCA method effectively reconstructs Þner details and at the same time introduces less artifacts than the other methods. The importance of using shape-adaptive transforms can be particularly appreciated for the Cameraman image, for which one can notice that only the methods based on such transforms are able to reconstruct sharp edges without introducing spurious oscillations or ghosting artifacts.
7 Conclusion In this paper we reviewed recent developments in the Þeld of nonparametric regression modeling and image processing. In these conclusive comments, we would like to discuss some theoretical aspects of these developments and, in particular, what problems, of principal importance in our opinion, are not solved. The considered methods were classiÞed mainly according to two leading features: local/nonlocal and pointwise/multipoint. This discussion is organized according to this classiÞcation. (1) Local pointwise estimators. These estimators are supported by strong theoretical results covering nearly all aspects of estimation: estimation accuracy, adaptation with varying spatially adaptive neighborhoods, etc. Unsolved problem: simultaneous selection of adaptive neighborhood and order of the local parametric model. It is a generalized model-selection problem where the model support is treated as an element of the model selection. Note that this setting is very different from the classical model-selection problem where the model support is assumed to be Þxed. (2) Local multipoint estimators. These estimators deal with multiple preliminary estimators and the Þnal estimate is calculated by aggregation (fusing) of the preliminary estimates. The existing aggregation methods assume that the models of the preliminary estimates are given. These two-step procedures are actually heuristic or semiheuristic as the aggregation turns out as the only method to exploit the produced redundant estimates. Unsolved problem: simultaneous optimization of aggregation and models for the preliminary estimates. In particular, development of the statistical observation model leading to the two-step procedure with the preliminary and aggregation step as a result of some standard statistical estimation technique (ML, EM, etc.). (3) Nonlocal pointwise and multipoint estimators. (3a) The signal dependent weights deÞne the support of the estimator, i.e. the points included in estimate, and
Vladimir Katkovnik et al.
the weights of the included observations. In many developments, in particular in our BM3D algorithm, the use of the indicator window deÞnes the nonlocal support while the details of the comparative weighting of this windows is ignored. Under this simpliÞcation, all basic aspects of the algorithms are similar to the ones of standard transform-domain Þltering. The situation becomes much different when we take into consideration the window weights varying according to unknown signal values. Using estimates for these unknown values results in the estimates which are principally different from the usual local ones. The limit estimate is a solution of the nonlinear equation (33): yˆh (x0 ) =
X
gh,s (ˆ yh (x0 ))zs .
s
It is difficult to say what sort of estimate we obtain even for the noiseless signal. For the local estimates with the signal-independent kernel gh,s we know eigenfunctions of this kernel (polynomial for the LPA) and we know the smoothing properties of this Þlter. For the case of signaldependent kernel the smoothing properties of this Þlter are actually unknown. The works by Buades et al. [10] and Kindermann et al. [64] are only very Þrst steps in the direction of studying this sort of nonlinear operators. Unsolved problem: smoothing properties of the nonlocal pointwise and multipoint estimator with respect to noiseless and noisy signals. (3b) This point similar to (2) but for the nonlocal estimators. Unsolved problem: development of the statistical observation model leading to the windowing, grouping, blockwise estimation and aggregation as a result of some standard statistical estimation technique (ML, EM, etc.). The model [criteria (55)-(60)] proposed in this paper gives only the blockwise/groupwise estimates while the windowing and the aggregation are treated as separate steps. Use of the mix-distribution for observation modeling in the work [58] was one of the Þrst attempts to combine the grouping with estimation.
8 Acknowledgments This work was supported by the Academy of Finland (project no. 213462, Finnish Programme for Centres of Excellence in Research 2006-2011, project no. 118312, Finland Distinguished Professor Programme 2007-2010, and project no. 129118, Postdoctoral Researcher’s Project 2009-2011). We would like to thank Julien Mairal, Jerome Boulanger and Charles Kervrann for providing us the experimental results of their algorithms. We are thankful also to the anonymous reviewers for their constructive suggestions which helped us improving our manuscript.
From local kernel to nonlocal multiple-model image denoising
21
Fig. 8 PSNR comparison of various denoising algorithms. Right: PSNR results obtained for 10 different images with 5 different levels of noise. The numbers are the results obtained by the BM3D-SAPCA algorithm. Left: difference in PSNR with respect to the BM3D-SAPCA algorithm. The data is sorted from top to bottom following the PSNR results obtained by BM3D-SAPCA. The Þgure is appreciated best when rotated counterclockwise 90 degrees.
22
Vladimir Katkovnik et al.
Montage σ=5 Montage σ=15 Montage σ=20 Montage σ=25 Montage σ=35 Cameraman σ=5 Cameraman σ=15 Cameraman σ=20 Cameraman σ=25 Cameraman σ=35 Boats σ=5 Boats σ=15 Boats σ=20 Boats σ=25 Boats σ=35 Lena σ=5 Lena σ=15 Lena σ=20 Lena σ=25 Lena σ=35 House σ=5 House σ=15 House σ=20 House σ=25 House σ=35 Barbara σ=5 Barbara σ=15 Barbara σ=20 Barbara σ=25 Barbara σ=35 Peppers σ=5 Peppers σ=15 Peppers σ=20 Peppers σ=25 Peppers σ=35 Couple σ=5 Couple σ=15 Couple σ=20 Couple σ=25 Couple σ=35 Hill σ=5 Hill σ=15 Hill σ=20 Hill σ=25 Hill σ=35 Man σ=5 Man σ=15 Man σ=20 Man σ=25 Man σ=35 Average
[21] 41.47 35.75 34.17 32.97 30.88 38.57 32.37 30.88 29.81 28.17 37.50 32.30 31.02 30.03 28.52 38.86 34.43 33.20 32.23 30.72 40.05 35.17 33.90 32.96 31.38 38.38 33.32 32.01 31.00 29.35 38.34 32.95 31.55 30.43 28.74 37.63 32.24 30.88 29.82 28.23 37.30 32.05 30.85 29.96 28.62 38.03 32.20 30.83 29.81 28.39 32.80
[20] 41.33 35.47 33.93 32.74 30.80 38.41 32.09 30.62 29.58 28.02 37.30 32.07 30.81 29.84 28.37 38.75 34.28 33.05 32.07 30.57 39.90 35.06 33.85 32.91 31.43 38.14 32.96 31.67 30.65 28.95 38.21 32.68 31.22 30.08 28.35 37.56 32.14 30.79 29.73 28.14 37.16 31.86 30.69 29.82 28.53 37.84 31.94 30.59 29.61 28.23 32.62
[19] 41.14 35.15 33.61 32.37 30.46 38.29 31.91 30.48 29.45 27.93 37.28 32.14 30.88 29.91 28.43 38.72 34.27 33.05 32.08 30.56 39.83 34.94 33.77 32.86 31.38 38.31 33.11 31.78 30.72 28.98 38.12 32.70 31.29 30.16 28.52 37.52 32.11 30.76 29.72 28.15 37.14 31.86 30.72 29.85 28.56 37.82 31.93 30.59 29.62 28.22 32.58
[75] 40.96 34.77 33.29 32.02 30.12 38.36 31.79 30.43 29.39 27.84 37.36 32.14 30.86 29.85 28.37 38.81 34.14 32.87 31.96 30.40 39.91 34.96 33.67 32.71 31.10 38.34 33.00 31.59 30.34 28.63 38.22 32.45 31.07 30.05 28.37 37.57 31.99 30.61 29.55 28.00 37.18 31.90 30.70 29.80 28.45 37.88 31.86 30.52 29.59 28.17 32.48
[37] 40.97 34.91 33.36 32.11 30.12 38.15 31.69 30.18 29.11 27.51 37.14 31.79 30.49 29.48 27.93 38.54 33.87 32.63 31.66 30.18 39.38 34.14 32.92 31.93 30.39 37.49 31.39 30.00 28.95 27.35 37.99 32.45 31.04 29.92 28.27 37.36 31.78 30.39 29.32 27.71 37.03 31.60 30.40 29.50 28.22 37.63 31.70 30.32 29.32 27.91 32.11
[3] 40.09 33.86 32.34 31.13 29.30 37.87 31.47 30.00 28.89 27.32 37.24 31.77 30.39 29.32 27.71 38.62 33.71 32.39 31.36 29.71 39.34 34.25 33.10 32.07 30.29 38.11 32.41 30.84 29.58 27.70 37.79 32.20 30.80 29.67 28.04 37.33 31.47 30.02 28.88 27.09 37.03 31.47 30.19 29.23 27.79 37.53 31.52 30.16 29.08 27.62 31.94
[44] 39.14 33.03 31.43 30.17 28.27 37.40 30.93 29.45 28.37 26.84 37.03 31.72 30.41 29.40 27.91 38.52 34.04 32.81 31.83 30.35 38.93 33.73 32.52 31.54 29.98 37.97 32.25 30.76 29.58 27.81 37.31 31.82 30.40 29.29 27.64 37.13 31.50 30.14 29.11 27.61 36.99 31.48 30.28 29.39 28.13 37.53 31.66 30.29 29.29 27.83 31.78
[63] 39.40 33.27 31.75 30.55 28.73 37.31 30.46 29.29 28.47 27.24 36.25 31.52 30.32 29.36 27.91 38.00 33.81 32.71 31.82 30.42 38.14 33.90 32.94 32.14 30.75 37.02 32.00 30.60 29.39 27.45 37.22 32.09 30.81 29.79 28.24 36.79 31.50 30.19 29.15 27.55 36.54 31.34 30.20 29.35 28.11 37.03 31.53 30.25 29.30 27.97 31.76
[87] 39.09 32.93 31.32 30.07 28.21 37.47 30.91 29.43 28.34 26.78 36.99 31.72 30.40 29.39 27.92 38.53 33.93 32.69 31.71 30.22 38.67 33.60 32.35 31.35 29.81 37.81 31.90 30.35 29.15 27.35 37.33 31.76 30.32 29.21 27.56 37.12 31.50 30.12 29.09 27.58 36.93 31.47 30.26 29.38 28.12 37.56 31.66 30.30 29.29 27.86 31.70
[47] 36.18 32.16 30.50 29.66 28.00 37.54 30.96 29.47 28.39 26.85 37.09 31.59 30.25 29.21 27.69 38.64 33.97 32.69 31.69 30.18 39.15 33.82 32.58 31.60 30.07 38.19 32.55 31.06 29.89 28.12 37.35 31.61 30.21 29.06 27.42 37.12 31.36 29.94 28.86 27.28 36.95 31.46 30.24 29.33 28.03 37.40 31.50 30.16 29.17 27.78 31.64
[89] 40.30 33.68 31.88 30.45 28.22 37.99 30.94 29.30 28.19 26.59 36.27 31.27 29.86 28.57 26.55 38.19 33.29 31.89 30.57 28.52 38.21 33.55 32.29 31.05 29.02 37.25 30.16 28.28 26.84 24.97 37.68 32.06 30.47 29.17 26.94 37.00 31.23 29.61 28.17 25.92 36.58 30.86 29.60 28.57 26.94 37.42 31.04 29.53 28.31 26.52 31.16
[33] 38.96 33.35 31.85 30.66 28.74 37.80 31.19 29.77 28.68 26.94 36.48 30.93 29.61 28.60 27.08 37.88 32.72 31.43 30.43 28.90 38.08 33.18 31.84 30.75 28.93 36.58 29.61 27.90 26.62 24.94 37.49 31.78 30.30 29.16 27.37 36.75 30.66 29.15 28.03 26.48 36.51 30.92 29.71 28.80 27.49 37.11 31.11 29.79 28.81 27.39 31.10
[55] 39.34 32.86 31.20 29.93 27.87 37.69 30.87 29.33 28.16 26.34 36.27 30.46 29.03 27.93 26.30 37.70 32.18 30.74 29.66 28.06 37.87 32.62 31.24 30.12 28.28 36.47 29.20 27.38 26.05 24.39 37.37 31.15 29.58 28.33 26.45 36.57 30.16 28.59 27.43 25.81 36.24 30.42 29.13 28.17 26.77 36.90 30.59 29.18 28.14 26.64 30.58
[10] 35.26 32.19 30.84 29.57 27.16 31.83 29.80 29.01 28.20 26.40 33.68 30.39 29.32 28.38 26.53 36.10 32.72 31.51 30.36 28.05 36.51 33.82 32.51 31.16 28.46 35.30 31.67 30.38 29.19 26.93 34.48 30.97 29.73 28.60 26.40 33.74 30.20 29.01 27.99 26.12 33.41 30.26 29.33 28.47 26.73 33.67 30.22 29.25 28.38 26.64 30.34
Table 2 PSNR comparison of various denoising algorithms: BM3D [19], SA-BM3D [20], BM3D-SAPCA [21], SA-DCT [37], K-SVD [3], MS-K-SVD [75], TLS [47], BLS-GSM [87], OAGSM-NC [44], NL-means [10], FoE [89], SAFIR [63], LPA-ICI [55], Rec. LPA-ICI [33]. Best results are boldfaced.
From local kernel to nonlocal multiple-model image denoising
23
Fig. 9 MSSIM comparison of various denoising algorithms. Right: MSSIM results obtained for 10 different images with 5 different levels of noise. The numbers are the results obtained by the BM3D-SAPCA algorithm. Left: difference in MSSIM with respect to the BM3D-SAPCA algorithm. The data is sorted from top to bottom following the MSSIM results obtained by BM3D-SAPCA. The Þgure is appreciated best when rotated counterclockwise 90 degrees.
24
Vladimir Katkovnik et al.
Montage σ=5 Montage σ=15 Montage σ=20 Montage σ=25 Montage σ=35 Cameraman σ=5 Cameraman σ=15 Cameraman σ=20 Cameraman σ=25 Cameraman σ=35 Boats σ=5 Boats σ=15 Boats σ=20 Boats σ=25 Boats σ=35 Lena σ=5 Lena σ=15 Lena σ=20 Lena σ=25 Lena σ=35 House σ=5 House σ=15 House σ=20 House σ=25 House σ=35 Barbara σ=5 Barbara σ=15 Barbara σ=20 Barbara σ=25 Barbara σ=35 Peppers σ=5 Peppers σ=15 Peppers σ=20 Peppers σ=25 Peppers σ=35 Couple σ=5 Couple σ=15 Couple σ=20 Couple σ=25 Couple σ=35 Hill σ=5 Hill σ=15 Hill σ=20 Hill σ=25 Hill σ=35 Man σ=5 Man σ=15 Man σ=20 Man σ=25 Man σ=35 Average
[21] 0.982 0.956 0.943 0.930 0.904 0.963 0.910 0.886 0.864 0.828 0.944 0.857 0.829 0.804 0.762 0.946 0.898 0.881 0.865 0.837 0.960 0.899 0.876 0.861 0.838 0.966 0.926 0.909 0.894 0.861 0.957 0.907 0.887 0.869 0.836 0.953 0.878 0.849 0.821 0.773 0.945 0.846 0.809 0.779 0.730 0.957 0.874 0.841 0.811 0.763 0.877
[20] 0.983 0.955 0.941 0.927 0.899 0.962 0.903 0.877 0.856 0.823 0.940 0.853 0.824 0.799 0.757 0.945 0.896 0.878 0.861 0.831 0.958 0.897 0.876 0.861 0.838 0.965 0.923 0.906 0.888 0.850 0.956 0.907 0.887 0.868 0.835 0.952 0.877 0.848 0.820 0.770 0.943 0.839 0.803 0.774 0.726 0.954 0.867 0.832 0.803 0.756 0.874
[19] 0.982 0.954 0.940 0.926 0.896 0.962 0.901 0.875 0.854 0.822 0.939 0.854 0.826 0.801 0.759 0.944 0.896 0.877 0.861 0.831 0.957 0.891 0.873 0.859 0.837 0.965 0.923 0.905 0.887 0.848 0.956 0.907 0.887 0.868 0.834 0.951 0.877 0.848 0.820 0.771 0.943 0.839 0.804 0.775 0.728 0.954 0.867 0.833 0.805 0.758 0.873
[75] 0.980 0.950 0.938 0.924 0.892 0.962 0.900 0.878 0.857 0.819 0.941 0.856 0.825 0.798 0.753 0.947 0.895 0.876 0.861 0.830 0.958 0.897 0.871 0.856 0.832 0.965 0.921 0.901 0.879 0.836 0.957 0.900 0.882 0.863 0.826 0.952 0.875 0.843 0.812 0.762 0.944 0.844 0.804 0.773 0.721 0.955 0.867 0.832 0.804 0.754 0.871
[37] 0.981 0.951 0.936 0.922 0.893 0.961 0.902 0.875 0.852 0.815 0.940 0.848 0.816 0.789 0.740 0.944 0.891 0.872 0.855 0.825 0.955 0.882 0.862 0.847 0.822 0.963 0.910 0.886 0.862 0.811 0.955 0.902 0.881 0.862 0.827 0.950 0.868 0.835 0.805 0.750 0.943 0.832 0.792 0.759 0.709 0.952 0.861 0.823 0.791 0.741 0.865
[47] 0.971 0.927 0.910 0.895 0.869 0.953 0.882 0.853 0.830 0.796 0.937 0.841 0.809 0.780 0.732 0.944 0.891 0.872 0.855 0.826 0.950 0.872 0.853 0.838 0.814 0.963 0.912 0.889 0.866 0.820 0.948 0.883 0.860 0.839 0.804 0.947 0.855 0.819 0.787 0.731 0.941 0.829 0.788 0.755 0.704 0.949 0.855 0.819 0.789 0.740 0.856
[3] 0.977 0.939 0.923 0.907 0.875 0.959 0.894 0.864 0.837 0.796 0.941 0.842 0.804 0.772 0.720 0.946 0.885 0.863 0.843 0.808 0.954 0.877 0.860 0.845 0.814 0.964 0.910 0.881 0.850 0.795 0.954 0.898 0.876 0.855 0.819 0.950 0.855 0.815 0.779 0.712 0.943 0.823 0.777 0.740 0.683 0.951 0.855 0.815 0.779 0.725 0.855
[44] 0.967 0.922 0.903 0.886 0.853 0.951 0.875 0.842 0.816 0.777 0.935 0.845 0.813 0.786 0.740 0.942 0.891 0.873 0.857 0.829 0.947 0.869 0.851 0.837 0.811 0.962 0.909 0.883 0.856 0.807 0.948 0.888 0.865 0.843 0.804 0.947 0.861 0.828 0.798 0.748 0.941 0.827 0.788 0.755 0.706 0.951 0.859 0.823 0.792 0.740 0.855
[63] 0.974 0.932 0.916 0.901 0.872 0.955 0.863 0.837 0.818 0.790 0.921 0.835 0.803 0.775 0.728 0.938 0.887 0.870 0.854 0.828 0.932 0.866 0.854 0.844 0.825 0.957 0.904 0.876 0.844 0.785 0.949 0.893 0.873 0.854 0.822 0.945 0.856 0.822 0.791 0.735 0.937 0.814 0.775 0.744 0.697 0.948 0.853 0.816 0.785 0.739 0.853
[87] 0.967 0.917 0.894 0.873 0.834 0.953 0.872 0.838 0.809 0.762 0.934 0.846 0.814 0.786 0.738 0.942 0.889 0.869 0.851 0.821 0.942 0.866 0.846 0.829 0.798 0.961 0.901 0.871 0.842 0.787 0.948 0.884 0.858 0.834 0.792 0.947 0.861 0.827 0.796 0.744 0.940 0.827 0.788 0.756 0.706 0.951 0.859 0.822 0.790 0.737 0.850
[89] 0.979 0.943 0.928 0.910 0.878 0.961 0.885 0.848 0.823 0.792 0.914 0.823 0.785 0.745 0.677 0.937 0.876 0.853 0.828 0.784 0.929 0.865 0.850 0.834 0.805 0.958 0.874 0.829 0.783 0.713 0.951 0.900 0.877 0.853 0.804 0.942 0.842 0.797 0.746 0.652 0.932 0.792 0.749 0.709 0.644 0.948 0.833 0.787 0.745 0.681 0.836
[33] 0.968 0.928 0.905 0.882 0.834 0.957 0.881 0.849 0.822 0.772 0.932 0.822 0.786 0.756 0.703 0.940 0.869 0.843 0.819 0.774 0.936 0.865 0.843 0.820 0.774 0.955 0.862 0.816 0.774 0.702 0.952 0.891 0.864 0.839 0.792 0.944 0.834 0.792 0.754 0.691 0.936 0.805 0.765 0.731 0.678 0.947 0.842 0.803 0.770 0.716 0.835
[55] 0.971 0.905 0.873 0.842 0.780 0.957 0.870 0.832 0.797 0.733 0.925 0.807 0.763 0.723 0.656 0.935 0.850 0.815 0.782 0.722 0.931 0.852 0.823 0.794 0.735 0.952 0.844 0.792 0.742 0.659 0.950 0.868 0.833 0.798 0.735 0.939 0.816 0.765 0.719 0.643 0.929 0.786 0.737 0.696 0.628 0.943 0.821 0.773 0.732 0.663 0.809
[10] 0.969 0.925 0.888 0.833 0.682 0.905 0.855 0.825 0.779 0.648 0.873 0.807 0.776 0.737 0.628 0.914 0.870 0.837 0.790 0.651 0.904 0.871 0.841 0.793 0.651 0.944 0.899 0.867 0.825 0.709 0.928 0.877 0.845 0.801 0.677 0.895 0.822 0.787 0.745 0.634 0.866 0.787 0.755 0.717 0.610 0.895 0.817 0.784 0.742 0.626 0.802
Table 3 MSSIM comparison of various denoising algorithms: BM3D [19], SA-BM3D [20], BM3D-SAPCA [21], SA-DCT [37], K-SVD [3], MS-K-SVD [75], TLS [47], BLS-GSM [87], OAGSM-NC [44], NL-means [10], FoE [89], SAFIR [63], LPA-ICI [55], Rec. LPA-ICI [33]. Best results are boldfaced.
From local kernel to nonlocal multiple-model image denoising
25
original Lena 512×512 ∞ / 1
noisy 20.18 / 0.271
BM3D-SAPCA [21] 32.23 / 0.865
SA-DCT [37] 31.66 / 0.855
SA-BM3D [20] 32.07 / 0.860
BM3D [19] 32.08 / 0.861
OAGSM-NC [44] 31.83 / 0.857
K-SVD [3] 31.36 / 0.843
MS-K-SVD [75] 31.96 / 0.861
BLS-GSM [87] 31.71 / 0.851
TLS [47] 31.69 / 0.855
SAFIR [63] 31.82 / 0.854
Fig. 10 Denoising of Lena corrupted by noise with σ = 25. The two numbers reported under each image are the corresponding PSNR and MSSIM values.
26
Vladimir Katkovnik et al.
original Cameraman 256×256 ∞ / 1
noisy 17.22 / 0.252
BM3D-SAPCA [21] 28.17 / 0.828
SA-DCT [37] 27.51 / 0.815
SA-BM3D [20] 28.02 / 0.823
BM3D [19] 27.93 / 0.822
OAGSM-NC [44] 26.84 / 0.777
K-SVD [3] 27.32 / 0.796
MS-K-SVD [75] 27.84 / 0.819
BLS-GSM [87] 26.78 / 0.762
TLS [47] 26.85 / 0.796
SAFIR [63] 27.24 / 0.790
Fig. 11 Denoising of Cameraman corrupted by noise with σ = 35. The two numbers reported under each image are the corresponding PSNR and MSSIM values.
From local kernel to nonlocal multiple-model image denoising
References 1. F. Abramovich and Y. Benjamini, “Adaptive thresholding of wavelet coefficients,” Computational Statistics and Data Analysis, vol. 22, pp. 351-361, 1996. 2. F. Abramovich, Y. Benjamini, D. Donoho, and I. Johnstone, "Adapting to unknown sparsity by controlling the false discovery rate," The Annals of Statistics, vol. 34, no. 2, pp. 584-653, 2006. 3. M. Aharon, M. Elad, and A.M. Bruckstein, "The KSVD: An algorithm for designing of overcomplete dictionaries for sparse representation", IEEE Trans. Signal Process., vol. 54, no. 11, pp. 4311-4322, 2006. 4. S. Alexander, S. Kovacic, and E. Vrscay, “A simple model for image self-similarity and the possible use of mutual information,” Proc. 15th Eur. Signal Process. Conf., EUSIPCO 2007 , Poznan, Poland, 2007. 5. J. Astola and L. Yaroslavsky (eds.) Advances in signal transforms: theory and applications, EURASIP Book Series on Signal Processing and Communications, vol. 7, Hindawi Publishing Corporation, 2007. 6. D. Barash, “A fundamental relationship between bilateral Þltering, adaptive smoothing, and the nonlinear diffusion equation,” IEEE Trans. Pattern Analysis and Machine Intelligence, vol. 24, no. 6, pp. 844-847, June 2002. 7. Y. Benjamini and W. Liu, “A step-down multiple hypotheses testing procedure that controls the false discovery rate under independence,” Journal of Statistical Planning and Inference, vol. 82, no. 1-2, pp. 163-170, 1999. 8. L. Birge, "Model selection via testing: an alternative to (penalized) maximum likelihood estimators," Ann. Inst. H. Poincare Probab. Statist. vol 40, pp. 273-325, 2006. 9. R. Brown, Smoothing, forecasting and prediction of discrete time series. Prentice-Hall, Englewood Cliffs, NY, USA, 1963. 10. A. Buades, B. Coll, and J. M. Morel, “A review of image denoising algorithms, with a new one,” SIAM Multiscale Modeling and Simulation, vol. 4, pp. 490-530, 2005. 11. A. Buades, B. Coll, J. M. Morel, "The staircasing effect in neighborhood Þlters and its solution", IEEE Transactions on Image Processing, vol. 15, pp. 1499-1505, 2006. 12. A. Buades, B. Coll, J. M. Morel, "Neighborhood Þlters and PDE’s", Numerische Mathematik, vol. 105, no. 1, pp. 1-34, 2006. 13. A. Buades, B. Coll, and J. M. Morel, “Nonlocal image and movie denoising,” International Journal of Computer Vision, vol. 76, no. 2, pp. 123-139, 2008. 14. F. Bunea, Tsybakov A. and M. Wegkamp, " Aggregation for regression learning," Annals of Statistics, vol. 35, pp. 1674-1697, 2007. 15. T. Chan and J. Shen, Image processing and analysis: variational, PDE, wavelet, and stochastic methods, SIAM, 2005. 16. P. Chatterjee and P. Milanfar, “A generalization of nonlocal means via kernel regression,” Proc. SPIE Conf. on Computational Imaging, San Jose, January 2008. 17. W.S. Cleveland and S.J. Devlin, “Locally weighted regression: an approach to regression analysis by local Þtting,” Journal of American Statistical Association, vol. 83, pp. 596-610, 1988.
27 18. R. Coifman and D. Donoho, “Translation-invariant denoising,” in Wavelets and Statistics (A. Antoniadis and G. Oppenheim (Eds.)), Lecture Notes in Statistics, Springer-Verlag, 125-150, 1995. 19. K. Dabov, A. Foi, V. Katkovnik, and K. Egiazarian, “Image denoising by sparse 3-D transform-domain collaborative Þltering,” IEEE Transactions on Image Processing, vol. 16, no. 8, pp. 2080-2095, August 2007. 20. K. Dabov, A. Foi, V. Katkovnik, and K. Egiazarian, “A Nonlocal and Shape-Adaptive Transform-Domain Collaborative Filtering,” Proc. 2008 Int. Workshop on Local and Non-Local Approximation in Image Processing, LNLA 2008, Lausanne, Switzerland, 2008. 21. K. Dabov, A. Foi, V. Katkovnik, and K. Egiazarian, “BM3D Image Denoising with Shape-Adaptive Principal Component Analysis”, Proc. Workshop on Signal Processing with Adaptive Sparse Structured Representations (SPARS’09), Saint-Malo, France, April 2009. 22. D. Donoho and I. Johnstone, “Adapting to unknown smoothness via wavelet shrinkage,” Journal of American Statistical Association, vol. 90, no. 432, pp. 12001224, 1995. 23. K. Egiazarian, V. Katkovnik, and J. Astola, “Local transform-based image de-noising with adaptive window size selection,” Proc. SPIE Image and Signal Processing for Remote Sensing VI, vol. 4170, 4170-4, Jan. 2001. 24. M. Elad, “On the origin of the bilateral Þlter and ways to improve it,” IEEE Trans on Image Processing, vol. 10, no. 10, pp. 1141-1151, 2002. 25. M. Elad, “Why shrinkage is still relevant for redundant representations?” IEEE Trans. Inf. Theory, 52, no. 12, pp. 5559-5569, 2006. 26. M. Elad and I. Yavneh, “A plurality of sparse representations is better than the sparsest one alone,” to appear in IEEE Transactions on Information Theory. 27. M. Elad and M. Aharon, “Image denoising via sparse and redundant representations over learned dictionaries,” IEEE Trans. Image Processing, vol. 15, no. 12, pp. 3736-3745, December 2006. 28. A. Elmoataz, O. Lezoray, S. Bougleux and V.T. Ta, "Unifying local and nonlocal processing with partial difference operators on weighted graphs," in Proc. 2008 Int. Workshop on Local and Non-Local Approximation in Image Processing, LNLA 2008, Lausanne, Switzerland, August 2008. 29. C. Ercole, A. Foi, V. Katkovnik, and K. Egiazarian, “Spatio-temporal pointwise adaptive denoising of video: 3D non-parametric approach”, Proc. of the 1st International Workshop on Video Processing and Quality Metrics for Consumer Electronics, VPQM2005, Scottsdale, AZ, January 2005. 30. J. Fan and I. Gijbels. Local polynomial modeling and its application. London: Chapman and Hall, 1996. 31. A. Foi, Anisotropic nonparametric image processing: theory, algorithms and applications, Ph.D. Thesis, Dip. di Matematica, Politecnico di Milano, ERLTDDD01290, April 2005. 32. A. Foi, Pointwise Shape-Adaptive DCT Image Filtering and Signal-Dependent Noise Estimation, D.Sc.Tech. Thesis, Institute of Signal Processing, Tampere University of Technology, Publication 710, December 2007.
28 33. A. Foi,V. Katkovnik, K. Egiazarian, and J. Astola, “A novel anisotropic local polynomial estimator based on directional multiscale optimizations”, Proc. 6th IMA Int. Conf. Math. in Signal Processing, Cirencester (UK), pp. 79-82, 2004. 34. A. Foi,R. Bilcu, V. Katkovnik, and K. Egiazarian, “Anisotropic local approximations for pointwise adaptive signal-dependent noise removal”, XIII European Signal Proc. Conf., EUSIPCO 2005, 2005. 35. A. Foi,V. Katkovnik, K. Egiazarian, and J. Astola, “Inverse halftoning based on the anisotropic LPA-ICI deconvolution”, Proc. Int. TICSP Workshop Spectral Meth. Multirate Signal Proc., SMMSP 2004, Vienna, pp. 49-56, Sep. 2004. 36. A. Foi,S. Alenius, M. Trimeche, V. Katkovnik, and K. Egiazarian, “A spatially adaptive Poissonian image deblurring”, IEEE 2005 Int. Conf. Image Processing, ICIP 2005, September 2005. 37. A. Foi, V. Katkovnik, and K. Egiazarian, “Pointwise Shape-Adaptive DCT for High-Quality Denoising and Deblocking of Grayscale and Color Images,” IEEE Trans. Image Process., vol. 16, no. 5, pp. 1395-1411, May 2007. 38. W. T. Freeman and E. H. Adelson, “The design and use of steerable Þlters,” IEEE Pattern Anal. Machine Intell., vol. 13, no. 9, pp. 891—906, 1991. 39. G. Gilboa and S. Osher, “Nonlocal linear image regularization and supervised segmentation,” SIAM Multiscale Modeling and Simulation, Vol. 6, No. 2, pp. 595-630, 2007. 40. G. Gilboa and S. Osher, “Nonlocal operators with applications to image processing,” UCLA Computational and Applied Mathematics, Reports cam (07-23), July 2007, online at http://www.math.ucla.edu/applied/cam. 41. A. Goldenshluger and A. Nemirovski, “On spatial adaptive estimation of nonparametric regression,” Math. Meth. Statistics, vol.6, pp.135-170, 1997. 42. A. Goldenshluger, “A universal procedure for aggregating estimators,” Annals of Statistics, vol. 37, no. 1, pp. 542-568, 2009. 43. O. Guleryuz, “Weighted averaging for denosing with overcomplete dictionaries,” IEEE Trans. Image Processing, vol. 16, no. 12, 2007, pp. 3020-3034. 44. D. K. Hammond and E. P. Simoncelli, "Image Modeling and Denoising With Orientation-Adapted Gaussian Scale Mixtures," IEEE Trans. Image Process., vol. 17, no. 11, pp. 2089-2101, Nov. 2008. 45. Hastie T.J. and Loader C. “Local regression: automatic kernel carpentry” (with discussion), Statistical Science, vol. 8, no. 2, pp. 120-143, 1993. 46. Y. Hel-Or and D. Shaked, “A discriminative approach for wavelet shrinkage denoising,” IEEE Trans. Image Process., vol 17, no. 4, pp. 443-457, April 2008. 47. Hirakawa, K., and T.W. Parks, “Image denoising using total least squares”, IEEE Trans. Image Process., vol. 15, no. 9, pp. 2730-2742, Sept. 2006. 48. G. Hua and M. T. Orchard, “A new interpretation of translation invariant image denoising,” Proc. Asilomar Conf. Signals Syst. Comput., PaciÞc Grove, CA, pp. 332-336, 2003. 49. Hurvich C. M., Simonoff J. S. and Chih-Ling Tsai, “Smoothing parameter selection in nonparametric re-
Vladimir Katkovnik et al.
50. 51. 52. 53.
54.
55.
56.
57.
58.
59.
60.
61.
62.
63.
64.
65.
66.
gression using an improved Akaike information criterion,” Journal of the Royal Statistical Society, Ser. B, vol. 60, pp. 271-293, 1998. A. Hyvärinen, J. Karhunen, E. Oja, Independent Component Analysis, Wiley, 2001. I. T. Jolliffe, Principal Component Analysis, 2nd ed. Springer, 2002. V. Katkovnik, Linear estimation and stochastic optimization problems. Nauka, Moscow, 1976 (in Russian). V. Katkovnik, Nonparametric identiÞcation and smoothing of data (local approximation method). Nauka, Moscow, 1985 (in Russian). V. Katkovnik, “A new method for varying adaptive bandwidth selection,” IEEE Trans. Signal Process., vol. 47, no. 9, pp. 2567-2571, 1999. V. Katkovnik, A. Foi, K. Egiazarian, and J. Astola, “Directional varying scale approximations for anisotropic signal processing”, Proc. XII European Signal Proc. Conf., EUSIPCO 2004, Vienna, pp. 101-104, September 2004. V. Katkovnik, A. Foi, K. Egiazarian, and J. Astola, “Anisotropic local likelihood approximations”, Proc. of Electronic Imaging 2005, 5672-19, January 2005. V. Katkovnik, K. Egiazarian, J. Astola, Local Approximation Techniques in Signal and Image Processing, SPIE PRESS, Bellingham, Washington, 2006. V. Katkovnik, A. Foi, K. Egiazarian, “Mix-distribution modeling for overcomplete denoising,” Proc. 9th workshop on Adaptation and Learning in Control and Signal Processing (ALCOSP’07), St. Petersburg, Russia, August, 29-31, 2007. V. Katkovnik, A. Foi, K. Egiazarian, and J. Astola, “Nonparametric regression in imaging: from local kernel to multiple-model nonlocal collaborative Þltering,” in Proc. 2008 Int. Workshop on Local and Non-Local Approximation in Image Processing, LNLA 2008, Lausanne, Switzerland, August 2008. V. Katkovnik and V. Spokoiny, “Spatially adaptive estimation via Þtted local likelihood techniques”, IEEE Trans. Image Process., vol. 56, no. 3, pp. 873-886, March 2008. C. Kervrann and J. Boulanger, “Local adaptivity to variable smoothness for exemplar-based image denoising and representation,” Research Report INRIA, RR5624, July 2005. C. Kervrann and J. Boulanger, “Unsupervised patchbased image regularization and representation,” ECCV 2006, Part IV, LNCS 3954, pp. 555-567, 2006. C. Kervrann and J. Boulanger, “Local adaptivity to variable smoothness for exemplar-based image regularization and representation,” International Journal of Computer Vision, vol. 79, pp. 45-69, 2008. S. Kindermann, S. Osher, and P.W. Jones, “Deblurring and denoising of images by nonlocal functionals,” SIAM Multiscale Modeling & Simulation, vol. 4, no. 4, pp. 1091-1115, 2005. N.G. Kingsbury, "Complex wavelets for shift invariant analysis and Þltering of signals", Journal of Applied and Computational Harmonic Analysis, vol. 10, no. 3, pp. 234-253, May 2001. S. Lansel, D. Donoho, and T. Weissman, “DenoiseLab: a standard test set and evalua-
From local kernel to nonlocal multiple-model image denoising
67.
68.
69.
70.
71.
72. 73.
74.
75.
76. 77.
78.
79. 80.
81.
82.
83.
84.
tion method to compare denoising algorithms”, http://www.stanford.edu/~slansel/DenoiseLab/. J.S. Lee, “Digital image smoothing and the sigma Þlter,” Computer Vision, Graphics, and Image Processing, vol. 24, pp. 255-269, 1983. O. Lepski, "One problem of adaptive estimation in Gaussian white noise," Theory Probab. Appl. 35, no. 3, 459—470, 1990. O. Lepski, Mammen, E. and V. Spokoiny, ”Ideal spatial adaptation to inhomogeneous smoothness: an approach based on kernel estimates with variable bandwidth selection,” The Annals of Statistics, vol. 25, no. 3, 929947, 1997. T. Lindeberg, “Edge detection and ridge detection with automatic scale selection,” International Journal of Computer Vision, vol 30, no. 2, pp. 117-154, 1998. T. Lindeberg, “Scale-space”, in Encyclopedia of Computer Science and Engineering (Benjamin Wah, ed.), John Wiley and Sons, Volume IV, pp. 2495-2504, Hoboken, New Jersey, 2009. C. Loader, Local regression and likelihood. Series Statistics and Computing, Springer-Verlag New York, 1999. Y. Lou, P. Favaro and S. Soatto, “Nonlocal similarity image Þltering,” UCLA Computational and Applied Mathematics, Reports cam (8-26), April 2008, online at http://www.math.ucla.edu/applied/cam. Y. Lou, X. Zhang, S. Osher and A. Bertozzi, “Image recovery via nonlocal operators,” Reports cam (8-35), May 2008, online at http://www.math.ucla.edu/applied/cam. J. Mairal, G. Sapiro and M. Elad, “Learning multiscale sparse representations for image and video restoration,” SIAM Multiscale Model. Simul., vol. 7, no. 1, pp. 214241, 2008. Mallat S., A wavelet tour of signal processing, Academic Press, 1999 Y. Meyer, Oscillating Patterns in Image Processing and Nonlinear Evolution Equations, Univ. Lecture Ser. 22, AMS, Providence, RI, USA, 2001. D. Muresan and T. Parks, “Adaptive principal components and image denoising,” Proc. 2003 IEEE Int. Conf. Image Process, ICIP 2003, pp. 101-104, Sept. 2003. E.A. Nadaraya, “On estimating regression,” Theory Prob. Appl., vol. 9, pp. 141-142, 1964. R. Öktem, L. Yaroslavsky, K. Egiazarian and J. Astola, Transform based denoising algorithms: comparative study, Tampere University of Technology, 1999. H. Öktem, V. Katkovnik, K. Egiazarian, and J. Astola, “Local adaptive transform based image de-noising with varying window size,” Proc. IEEE Int. Conf. Image Process., ICIP 2001, Thessaloniki, Greece, 273-276, 2001. S. Osher, A. Sole, and L. Vese, “Image decomposition and restoration using total variation minimization and the H −1 norm,” Multiscale Model. Simul., vol. 1, pp. 349-370, 2003. P. Perona and J. Malik, Scale space and edge detection using anisotropic diffusion, IEEE Trans. Patt. Anal. Mach. Intell., 12, pp. 629-639, 1990. J. Polzehl and V. Spokoiny, "Adaptive weights smoothing with applications to image restoration," Journal of Royal Stat. Soc., 62 Series B, 335—354, 2000.
29 85. J. Polzehl and V. Spokoiny, “Image denoising: pointwise adaptive approach,” The Annals of Statistics, vol. 31, no. 1, pp. 30-57, 2003. 86. J. Polzehl and V. Spokoiny, “Propagation-separation approach for local likelihood estimation, Probab. Theory Related Fields, vol. 135, no. 3, 335-362, 2005. 87. J. Portilla, V. Strela, M. J. Wainwright, and E. P. Simoncelli, “Image denoising using scale mixtures of Gaussians in the wavelet domain,” IEEE Trans. Image Process., vol. 12, no. 11, pp. 1338—1351, Nov.2003. 88. S. Roth and M. J. Black, “Fields of experts: A framework for learning image priors,” Proceedings of the IEEE International Conference on Computer Vision and Pattern Recognition (CVPR), San Diego, CA, pp. 860-867, 2005. 89. S. Roth and M. J. Black, “Fields of experts,” International Journal of Computer Vision, vol. 82, no. 2, pp. 205-229, 2009. 90. L. Rudin, S. Osher, and E. Fatemi, “Nonlinear total variation based noise removal algorithms,” Phys. D, 60 2, pp. 259-268, 1993. 91. L. Rudin, S. Osher, and E. Fatemi, “Nonlinear algorithms,” Phys. D, vol. 60, pp. 259-268, 1992. 92. D. Ruppert, “Empirical-bias bandwidths for local polynomial nonparametric regression and density estimation,” Journal of American Statistical Association, vol. 92 , no. 439, pp. 1049-1062, 1997. 93. A. Savitzky and M. Golay, “Smoothing and differentiation of data by simpliÞed least squares procedures,” Analytical Chemistry, vol. 36, pp. 1627-1639, 1964. 94. W.R. Schucany, “Adaptive bandwidth choice for kernel regression,” Journal of American Statistical Association, vol. 90, no. 430, pp. 535-540, 1995. 95. I.W. Selesnick, R.G. Baraniuk, and N.G. Kingsbury, "The Dual-Tree Complex Wavelet Transform," IEEE Signal Processing Magazine, vol. 22, no. 6, pp. 123-151, Nov. 2005. 96. M. Seuhling, M. Arigovindan, P. Hunziker, and M. Unser, "Multiresolution moment Þlters: theory and applications," IEEE Trans. Image Process., vol. 13, no. 4, pp. 484-495, 2004. 97. G. Steidl, J. Weickert, T. Brox, P. Mrazek, and M. Welk, "On the equivalence of soft wavelet shrinkage, total variation diffusion, regularization and SIDEs," SIAM J. Numerical Analysis, vol. 42, no. 2, pp. 686-713, 2004. 98. E.P. Simoncelli, W. T. Freeman, E. H. Adelson, and D. J. Heeger, “Shiftable multi-scale transforms,” IEEE Trans. Inform. Theory, vol.38, pp. 587—607, 1992. 99. Simonoff, J.S. Smoothing methods in statistics. N.Y., Springer, 1998. 100. S.M. Smith and J.M. Brady, “SUSAN - a new approach to low level image processing,” International Journal of Computer Vision, vol. 23, no. 1, pp. 45-78, 1997. 101. V. Spokoiny, “Estimation of a function with discontinuities via local polynomial Þt with an adaptive window choice,” Annals of Statistics, vol. 26, pp. 1356-1378, 1998. 102. V. Spokoiny, Local parametric methods in nonparametric estimation, Springer, to appear, draft online at http://www.wias-berlin.de/people/spokoiny/adabook/ada.pdf
103. H. Takeda, S. Farsiu, and P. Milanfar, “Higher order bilateral Þlters and their properties,” Proc. of the SPIE
30
104.
105.
106.
107.
108.
109.
110.
111.
112. 113.
114.
115.
116. 117.
118. 119.
120.
Vladimir Katkovnik et al. Conf. on Computational Imaging, San Jose, January 2007. H. Takeda, S. Farsiu, and P. Milanfar, “Kernel regression for image processing and reconstruction,” IEEE Trans. Image Process., vol. 16, no. 2, pp. 349—366, 2007. C. Tomasi and R. Manduchi, “Bilateral Þltering for gray and color images,” Proc.of the Sixth Int. Conf. on Computer Vision, pp. 839-846, 1998. D. Tschumperlé and L. Brun, “DeÞning some variational methods on the space of patches: Application to multi-valued image denoising and registration”, Research Report: Les cahiers du GREYC, no. 08-01, Caen, France, February 2008. D. Tschumperlé and L. Brun, “Image denoising and registration by PDE’s on the space of patches”, Proc. Int. Workshop on Local and Non-Local Approximation in Image Processing (LNLA’08), Lausanne, Switzerland, August 2008. E. Vansteenkiste, D. Van der Weken, W. Philips, and E. Kerre, “Perceived image quality measurement of state-of-the-art noise reduction schemes”, LNCS 4179 - ACIVS 2006, pp. 114-124, Springer, Sept. 2006. L. Vese and S. Osher, “Modeling textures with total variation minimization and oscillating patterns in image processing,” J. Sci. Comput., vol. 19, pp. 553-572, 2003. M.P. Wand, M.C. Jones, Kernel smoothing, Monographs on Statistics and Applied Probability 60, Hartman&Hall/CRC, 1995. Z. Wang, A.C. Bovik, H.R. Sheikh, and E.P. Simoncelli, “Image quality assessment: From error visibility to structural similarity”, IEEE Trans. Image Process., vol. 13, no. 4, pp. 600-612, April 2004. G.S. Watson, “Smooth regression analysis,” Sankhya, Ser. A, vol. 26, pp. 359-372, 1964. J. Wei, “Lebesgue anisotropic image denoising,” Int. J. Imaging Systems and Technology, vol. 15, no. 1, pp. 6473, 2005 J. Weickert, "Theoretical foundations of anisotropic diffusion in image processing," Computing, Suppl. 11, pp. 221—236, 1996. J. Weickert. Anisotropic Diffusion in Image Processing. European Consortium for Mathematics in Industry. B. G. Teubner, Stuttgart, 1998. L. Yaroslavsky and M. Eden, Fundamentals of Digital Optics, Birkhäuser Boston, Boston, MA, 1996. L. Yaroslavsky, “Local adaptive image restoration and enhancement with the use of DFT and DCT in a running window,” in Proc. SPIE Wavelet Applications in Signal and Image Process. IV, vol. 2825, pp. 1-13, 1996. L. Yaroslavsky, Digital picture processing–an introduction. New York: Springer-Verlag, 1985. L. Yaroslavsky, K. Egiazarian, and J. Astola, “Transform domain image restoration methods: review, comparison and interpretation,” Proc. SPIE, vol. 4304 Nonlinear Image Process. Pattern Anal. XII, San Jose, CA, pp. 155-169, 2001. S. Zimmer, S. Didas, and J. Weickert, “A rotationally iInvariant block matching strategy improving image denoising with non-local means,” in Proc. 2008 Int. Workshop on Local and Non-Local Approximation in Image Processing, LNLA 2008, Lausanne, Switzerland, August 2008.