WWW 2012 – LSNA'12 Workshop
April 16–20, 2012, Lyon, France
From Network Mining to Large Scale Business Networks Daniel Ritter SAP AG Dietmar-Hopp-Allee 16 69190 Walldorf, Germany
[email protected]
ABSTRACT
1.
The vision of Large Scale Network Analysis (LSNA) states on large amounts of network data, which are produced by social media applications like Facebook, Twitter, and the competitive domain of biological networks as well as their needs for network data extraction and analysis. That raises data management challenges which are addressed by biological, data mining and linked (web) data management communities. So far, mainly these domains were considered when identifying research topics and measuring approaches and progress. We argue that an important domain, the Business Network Management (BNM), representing business and (technical) integration data, implicitely linked and available in enterprises, has been neglected. Not only do enterprises need visibilities into their business networks, they need ad-hoc analysis capabilities on them. In this paper, we introduce BNM as domain, which comes with large scale network data. We discuss how linked business data can be made explicit by what we called Network Mining (NM) from dynamic, heterogeneous enterprise environments to combine it to a (cross-) enterprise linked business data network and state on its different facets w.r.t large network analysis and highlight challenges and opportunities.
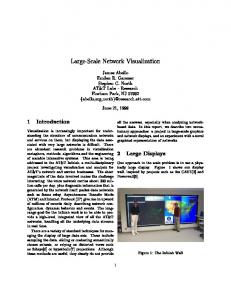
Nowadays enterprises are part of value chains consisting of business processes with intra and inter enterprise stakeholders. To remain competitive, enterprises need visibility into their business networks and ideally into relevant parts of partner and customer networks and processes. However, currently the visibility often ends at the borders of systems or enterprises. Business Network Management (BNM) helps to overcome this situation and allows companies to get insight into their technical, social and business relations. As part of BNM, Network Mining (NM) identifies relevant data hidden within heterogeneous and distributed systems within complex enterprise landscapes to computationally link it into business and (technical) integration networks. In addition, NM computes semantic correlation between entities of both perspectives. The linked real-world data is then captured in network-centric models as in [27, 28]. For instance, Fig. 1 shows participants in a sample business (process) network of a (cross-) enterprise partner network. The participants represent business artifacts within an enterprise, that are related to participants within a partner network. The participants and relationships are considered complex and contain the underlying business processes which specify e.g. a business document or goods exchange between related participants. Mining and inference of different perspectives on real-world enterprise networks results into large scale (hyper-) networks which require analysis for network optimization and operation. That means, a business network consists of (cross-) enterprise networks with different dimensions from the physical over logical hosts, (technical) integration, business to social media networks from the linked (web) data community. Following the vision of [4], it spans a giant global graph, or semantic web, while adding partially private and public linked enterprise data. In this paper, we define a new linked data and LSNA domain, i.e. BNM, by showing how business and (technical) integration data within the enterprise can be made explicit by Network Mining (NM). Since visibility into partner networks can make enterprises not only more competitive, but enlarges the networks, we show the need for large scale network data management and analysis. For that, we introduce relevant research questions and comprehensively describe them by stating on real-world enterprise data and use cases. Then we discuss the most relevant challenges based on our NM system and set them into context with state-of-the art research up to our knowledge. In section 2 a definition of business and integrtion networks is given and section 3 introduces the concept of Busi-
Categories and Subject Descriptors C.2 [Computer-Communication Networks]: General, Network Protocols, Network Operations; D.2.8 [Software Engineering]: Management, Software Architectures; H.2.8 [Database Management]: Database Applications—Data Mining; I.2.4 [Artificial Intelligence]: Knowledge Representation Formalisms and Methods; J. [Computer Applications]: General, Administrative Data Processing, Social and Behavioral Sciences, Computers in other Systems; K.6 [Management of Computing and Information Systems]: General, System Management
Keywords Large scale Network Analysis, Linked (Business) Data, Business Network Management, Network Mining, Business Network Virtualization
Copyright is held by the International World Wide Web Conference Committee (IW3C2). Distribution of these papers is limited to classroom use, and personal use by others. WWW 2012 Companion, April 16–20, 2012, Lyon, France. ACM 978-1-4503-1230-1/12/04.
989
INTRODUCTION
WWW 2012 – LSNA'12 Workshop
April 16–20, 2012, Lyon, France
Figure 1: Sample (cross-) enterprise Business Network showing business participants, denoted as nodes, and business document exchange as edges. Enterprises are characterised by their roles they play within a process ness Network Virtualization. Based on that, section 4 introduces NM. BNM is defined in section 5. Section 6 gives some insights into challenges and opportunities. We conclude with related work, draw conclusions and outline future research.
2.
and system management solutions, which allow to operate these systems, their software and lifecycle (Category VII). Since Fig. 2 still depicts a traditional network, the introduction of cloud or linked data applications will lead to new relationships, i.e. message flows, across the beyond traditional networks. BNM should address both the traditional and these ”new” networks. The knowledge about business as well as (technical) integration networks, leads to a definiton of a network where participants represent nodes and relationships between participants denote edges. Examples for participants are applications based on integration or business information. Relationships stand for integration or business documents as well as semantic relations between participants. Participants play roles within the network, which are defined by their relationships. Roles can be retailer, mediator or contact person. Content of different kind, like social media models, process logs, is defined by participants. When the content is shared via relationships, it is protected by access control mechanisms, as references are by privacy control. The sample networks hint on a conceptual model which covers the definition of a business network and allow for new model creation within the research area. An example for such a network-centric modeling approach is represented by previous work [27, 24]. In practice, there is another important perspective on the network resources, which is about the hardware or logical systems, e.g. server nodes, paravirtualization. This itself is a new research domain, which gains speed with the need to provide an overview on physical and logical nodes within companies addressed by the IT service management [25] and virtualization community [8]. From the business network point of view, the insight into a layer beneath the (technical) integration network adds value to link participants on
BUSINESS NETWORK DEFINITION
The business network shown in Fig. 1 is a conceptual view on how business-related participants exchange business documents and thus interrelate within and accross enterprises. The underlying business processes are actually implemented within the applications and integration capabilities of the enterprises denoting a more technical network, called integration network. Hence, the definition of the network for enterprises usually consists of a network of applications and integration middleware for internal business processes related to a network of applications and integration middleware for external processes interacting with business partners like suppliers, transport carriers, dealers. A generalized view of such a network is shown in Fig. 2. When looking at an enterprise landscape, the systems within the (technical) integration network can be classified into different categories based on the integration content and the role they play. The classification provides insight into the capabilities and complexity of the network and allows to manage business processes, contextualized visualization and operation on the network. These categories span from applications with embedded integration or even mediation capabilities, like proxies, enterprise services, composite applications or applications with service adapation (Categories I+II), over standalone Enterprise Service Bus (ESB) or middleware instances with flexible pipeline processing, e.g. mapping, routing and connectivity for legacy systems (Category III+IV), to Business to Business (B2B) gateways for cross-enterprise document exchange (Categories V+VI)
990
WWW 2012 – LSNA'12 Workshop
April 16–20, 2012, Lyon, France
Figure 2: Sample (technical) Integration Network showing logical systems as participants with embedded integration capabilities and standalone middlewares as well as B2B gateways
4.
physical or logical nodes for visualizing and operating business networks.
3.
BUSINESS NETWORK MINING
Network Mining (NM) is the discipline that covers the discovery, extraction and domain specific analysis of relevant data from dynamic, distributed and heterogeneous enterprise landscapes. Within the landscapes the data is automatically discovered. The resulting raw material is transformed into a model suitable to cover all aspects and allow inference on the captured ”as-is” state of the network. This step is related to BNV level one, since the raw data is translated into a virtual, domain-independent representation according to the conceptual model. Discovering the data relevant for BNV aims to construct a real-world, ”as-is” view of the network. Since the discovery process is guided to a specific set of information, the probability of discovering the relavant information increases even in complex, heterogeneous landscapes. This information can be categorized into at least three sets of information related to: business applications, integration content developed for integrating business applications and business processes executed within and across business applications. These sets of information are referred to as information models, representing the content within the conceptual model. Relevant linked web data could be content as part of these information models. The process of discovering the network requires exploring the system landscape based on the structure of information outlined in the information models and analysis to find similarity and relationships within information. The exploration in the network starts from the integration technology as it acts as an mediator between applications, thus has meta-data about the integration endpoints of the application. As shown in Fig. 3, the raw data can be used to conduct three types of network mining. The first type of network mining is discovery. A discovery technique takes
VIRTUALIZED BUSINESS NETWORK
Business Network Virtualization (BNV) is the process of combining network resources and network functionality into a single, software-based administrative entity called (virtual) business network. Within business networks, this allows for efficient utilization, manageability and regulatory compliance. For (technical) integration networks, we distinguish several levels of virtualization and their options. They conceptually ground definition of Business Network Mining denoted in Fig. 3 for better understanding. The first level specifies the retrieval and interpretation of integration content as well as operation information, which can be extended as second option by runtime artifacts. Therefore integration artifacts are implemented in domain or vendor specific tools, but displayed as business network. The integration or business exceptions are fixed within these tools. To bring this to the second level, design time and operation integration content is encapsulated and generated from the business network. For instance, when the business network is made visible, integration artifacts are defined on the network and deployed back to the specific integration technology. Based on level 2, the integration content are enriched by information flow models. These models allow a drill-down to the interface, binding or processing level of the integration technology. As second option to level 3, the integration flow models are interpreted and executed in one system integrated in the heterogeneous integration technology runtimes.
991
WWW 2012 – LSNA'12 Workshop
April 16–20, 2012, Lyon, France
Figure 3: Network Mining as discipline that discovers raw data from arbitrary data sources, checks the compliance of real-world network models and allows to enhance or instrument the source software stacks the domain-specific raw data from the software and hardware systems and produces a model by using a priori information. The raw data mainly covers meta-data and data, which can be categorized according to the application and integration technology (see section 2) and their capabilities can be short noted as connectivity and interface details (all cat.), operational data (all cat.), mapping (cat. II, III, V), routing (cat. II, III, V), system centric processes (cat. III, V). According to that, the raw data consists of all kinds of information like interfaces, events, communication protocols and reliability policies, operational data like monitoring logs, alerts, and many more. This manifold information has different qualities, which have to be kept in mind when transforming the raw data into inference models. These qualities can be roughly categorized as static or dynamic. The static information is mainly configuration or system landscape data, i.e. from sources that are setup once and not changed very often. Examples for dynamic data are monitoring or runtime data from middleware or integration systems and log files, events. These sources capture the system status in realtime. They produce large amounts of data over time and therefore need special treatment, but help to identify actually used artifacts. As part of NM, the BNV produces a model by applying domain-specific knowledge and a priori information. BNV describes the process of combining data from the landscapes and network functionality into a single, software-based administration entity, called (virtual) business network. The second type of NM is conformance. Here, an existing network model is compared with raw data from the network. Conformance checking can be used to check if reality, as recorded in the software and hardware stacks, conforms to the model and vice versa. This applies to different types of models, like middleware and application. The conformance checking does specify a contract or framework for
the re-deployment and enhancement of the domain-specific content. The third type of nework mining is enhancement, which covers re-deployment. Here, the idea is to extend or improve an existing network model using custom information about the actual business network from domain experts, integration architects and business specialists. Whereas conformance checking measures the alignment between model and reality, this type aims at changing or extending the ”asis” model. For instance, the ”as-is” model of the network can be refined and extended by introducing new relationships on the network, which results in an integration channel re-deployment within the specific middleware. This corresponds to levels two and three of BNV as defined in section 3, which is the most difficult part of NM and requires a bijective mapping between domain-specific and the (virtual) business network model. In case of external linked data, redeployment would mean e.g. to post messages into social media or add new connections to the profile. Network Mining systems are able to cover different complementing perspectives, e.g. business process, (technical) integration, social, orgranizational. These perspectives are then interrelated and represent the complete knowledge in a large network structure.
5.
BUSINESS NETWORK MANAGEMENT
The idea of Business Network Management (BNM) is to discover, make visible, monitor (operate) and improve realworld business networks and underlying processes by extracting knowledge from various sources readily available in today’s (information) systems. The automated data discovery, conformance checking and enhancement is done by NM resulting in a (virtual) network model. This data is input to inference mechanisms which derive the real ”as-is” business network and later a business network spanning accross enterprises. With that, BNM aims to ease the end-to-end lifecycle behind integration developments and allows collab-
992
WWW 2012 – LSNA'12 Workshop
April 16–20, 2012, Lyon, France
oration on different information for faster execution. The network gives a generalized view of an enterprise integration and business landscape. Today this challenge is addressed by documentation and systems management, but leaves manual work for IT administrators to gather a consistent view of the network. The basic steps within BNM are depicted in Fig. 4. The real ”as-is” network is computed based on the data from NM and visualized showing views on business and (technical) integration networks as well as their semantic relationships, e.g. process implemented by application. Domain experts work on these views by contextualizing, enriching and adapting the network to their needs, e.g. label or group entities. Thereby the experts analyze the ”as-is” network and enhance it by e.g. adding new entities. The enhanced network is closer to the ”to-be” network, which influences the general ”to-be” business process picture derived from BPM or Process Mining (PM) [2, 1]. For that, feedback from the operation on the network, e.g. monitoring, is taken into account.
6.
integration aspects accross enterprise boundaries. Still the data exclusively comes from within the companies. Since research programs make the global information space of huge amounts of linked information and its semantics tangible, enterprises require relationships between their linked data and the data available in the web. However, even in crossenterprise networks, the data mainly comes from inside the enterprises. Linked web information should be made available and visualized at the fingertips of people working on different aspects within the value chains of enterprises. Nowadays, more and more companies gain interest in publishing their linked data to partners, customers and sometimes even to the web. The latter is important for e.g. hiring, sustainability compliance, legal or governmental regulations. On the other hand, people in the web would like to query information about enterprises to e.g. news, jobs, share holder interests but also visibility in manufacturing or transport processes like tracking or sustainable process verification like ”where does my product come from” and ”when can I rate it to tell my friend on social media”. Therefore a new kind of applications could work on the data and unravel new areas of innovation and new directions in research. From the BNM perspective, external linked data will represent further network perspectives parallel to or accross existing views. One of the major challenges of combined web and enterprise linked data is security. This covers technical protocols for secure data transmission and access control, privacy control, user management, mapping and propagation. Even in the area of analysis on large scale networks, privacy should not be violated. Further areas of interest are the combination of data discovery patterns and support for interleaving reasoning and data sharing.
CHALLENGES AND OPPORUNITIES
The BNM domain grounds a novel approach to semantic web and linked data as well as brings up challenges for the research on large scale networks. To make the impact and contribution to this domain clearer, the challenges and opportunities from different directions are subsequently discussed starting from existing work.
(Cross-) Enterprise Business Networks. BNM provides an important bridge between NM, Business Process Management (BPM) and Process Mining (PM) [1, 2] as well as network operation and analysis. Although visibility into the enterprise’s business network is valuable, BNV level 1, these networks usually consist of several thousand integration related and business process participants, not mentioning the social aspects of the network, as well as several ten or hundred thousand relationships and other integration or business artifacts like interfaces, business terms etc. Semantic links are used to contextualize the different network perspectives, i.e. connect network perspectives, which leads to even larger, more complex, (hyper-) networks with multirelational edges. When the computed ”as-is” networks are enhanced by further domain specific artifacts, the depth of the networks grows. Possible extension like BNV levels 2 and 3 require even more data for (re)-deployment cases and (end-to-end) process monitoring on the network requires huge amounts of instance data correlated to the network perspectives. Since BNM does aim for visibility into partner networks along the supply chain, cross enterprise networks combine these perspectives to a Giant Global Partner Graph, similar to [4]. That becomes relevant because enterprises understood that they have to work with partners and even competitors closely, i.e. having insight into their networks and thus processes, in order to remain cometitive. That does also include access to all kinds of linked (web) data, which let them react faster to changes in their eco-system and conect them to relevant information.
Network Access. For the analysis of the large scale network data, information has to be represented and made accessible efficiently to external programs. The storage of the source data or intermediate results might become necessary when working with large network structures or in case ad-hoc analysis is not practical. The representation of the data should be expressive for the respective domain, e.g. business, integration and social data, and should allow for analysis, e.g. inference, lineage, semantic computations. Especially in the semantic web [36] and linked (web) data [6, 7] domains, the Resource Definition Framework (RDF) is highly used for that. Systems like RDF3X [23] support RDF-data representation and efficient query, inference and analysis. These approaches are powerful, yet for some applications to fine granular and thus unpractical from an information representation point of view. Since a graph-based storage and representation of the network is more natural, other approaches from NOSQL database vendors like InfoGrid [17], HyperGraphDB [18] and Noe4j [22] argue to represent the network data for analysis as (hyper) graph and offer embedded algorithms for traversal and analysis support. Especially in the social media domain these approaches have gained momentum. However, most of them just started to allow more advanced query, traversal and analysis capabilities. To access the network data, mostly local APIs within the host language and (remote) Restful-style APIs [15, 16, 38, 37, 35]. Most popular examples are the Facebook Graph API [12, 14] and protocol [13, 19], Rexter [26] or Hyper-
Linked (Web) Data. When the business network of an enterprise is made visible, it shows the ”as-is” situation of business process and
993
WWW 2012 – LSNA'12 Workshop
April 16–20, 2012, Lyon, France
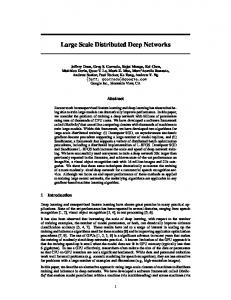
Figure 4: Business Network Management cycle showing influencing and contributing domains to the ”as-is” network computation towards a ”to-be” network enhancement GraphDB [18]. The HyperGraphDB approach is conceptually grounded on [3], which discusses graph models and their evolution. In the area of network data analysis, [31, 30] have introduced a formalization of graph traversal, which was applied to areas like recommender systems or other linked (web) data domains. For the BNM requirements, like business near exchange models such as network-centric Business Process Modeling Notation (BPMN) [24], a Network Integration Model [27, 28] is chosen as business network representation. For the data access, an efficient and intuitive API is used which allows to query, traverse and analyze business networks [29] and find entry points for analysis in it. For instance, Fig. 5 shows an excerpt of the (technical) integration network of a real-world enterprise landscape (name not stated) in our Business Network Center (BNC). The perspective shows a high-level view on the network with complex participants and edges, that resolve via drill-in. Some of the participants are already automatically grouped (light boxes) by information from NM. For that, only cat. III configuration data and the corresponding runtime artifacts are active. Neither business nor any social network nor linked (web) data discovery nor corrlelation between these network perspectives are active. Yet the network indicates the complexity and spanning it will get, when all aspects are considered. Hence, computation of relevant entry points, e.g. building sub-networks, and visual queries are required.
immediately. For a more structured viszualization of the complete network structures, orthogonal graph layout algorithms, as in [9], could be helpful. These approaches typically transform the layout generation to a Max-Flow-MinCut problem on planar graphs to calculate the orientation and position of the nodes and the routing of the edges. However, these techniques have to be extended for generated or manually added, nested grouping of participants (see Fig. 5). Therefore the nested groups, e.g. geographical and organizational units, could be seen as participants for which the node orientation and edge routing is computed and then inherited for the deeper nesting levels. In general, there is also the aspect of network esthetics, e.g. for BPMN [10], which is not practically interesting for large scale network analysis. For large scale network analysis a decent visualization becomes important if the algorithms require user input. That might be the case for stochastical techniques like Hidden Markov Model (HMM) [5] or other learning techniques that require training or feedback loops.
7.
RELATED WORK
Related work is conducted in the area of Process Mining (PM) initiated by Wil van der Aalst et al. [1, 2], which is a relatively young research discipline that sits between computational intelligence and data mining. It has similar requirements for data discovery, conformance and enhancement. However, its approach and goals are different. PM strives to derive Business Process Management (BPM) models from process logs. From that, models are automatically generated and checked. PM as well as BNM complement BPM by making it visible through automated discovery and in case of BNM to set the business processes in a broader context to each other. Similar to Process Mining, Semantic Business Process Management (SBPM) [21] strives to mine business processes semantics mechanically. For that, an ontological approach [20, 11] is combined with Semantic Web Services (SWS) and BPM. As in the Process Mining case, SBPM and Business Network Management are complementing approaches with combinable technology stacks. Gaining insight into the network of physical and logical nodes within companies could be a future extension of BNM, but is not primarily relevant for visualizing and operating
Network Visualization. When looking at the (technical) integration network in Fig. 5, one get an impression on how complex and difficult manual analysis of the network might become. A structured, intuitive and configurable visualization of large networks does not only give insight in these networks, but also allows manual support of analysis on the networks. For the visualization aspect, hyperbolic viewers like the Star Tree system [33] allows contextualized browsing on the whole tree. However, tree-based systems are not pracicaly usable for networks. A different approach is followed in the Social Network Analyzer (SNA) system [34], which allows to traverse the graph manually by only showing a specific number of transitive neighbour participants. Although that allows seamless browsing through the network, the limited view on the whole network let the user loose its context
994
WWW 2012 – LSNA'12 Workshop
April 16–20, 2012, Lyon, France
Figure 5: Business Network Center showing a part of a real-world enterprise landscape discovered by Business Network Mining tool and infered by Business Network Management system
Acknowledgments
business networks. This domain is mainly addressed by the IT service management [25] and virtualization community [8]. The linked (web) data research, conducted by Bizer, and Berners-Lee et al. [6, 7], shares similar approaches and methodologies, which have so far neglected linked data within enterprises.
8.
We thank A. Bhatt, C. Liebig and Dr. J. Ackermann for valuable discussions as well as G. Rothermel for sponsorship.
9.
REFERENCES
[1] van der Aalst, W., et al.: Process Mining Manifesto. Technical Report, IEEE Task Force, 2011. [2] van der Aalst, W.: Process Mining: Discovery, Conformance and Enhancement of Business Processes, 2011. [3] Angeles, R., Gutierrez, C.: Survey of Graph Database Models. In: ACM Computing Surveys, Vol. 40, No 1, Article 1, 2008. [4] Berners-Lee, T.: Giant Global Graph. Decentralized Information Group Breadcrumbs, p. 6–11, 2007. [5] Bergamaschi, S., Guerra, F., Rota, S., Velegrakis, Y.: A Hidden Markov Approach to Keyword-Based Search over Relational Databases. ER 2011, Br¨ ussel, 2011. [6] Bizer, C. Heath, T., Berners-Lee, T.: Linked Data – The Story so Far. International Journal on Semantic Web and Information Systems, Volumn 5, Issue 3, p 1–22, Elsevier, 2009. [7] Bizer, C.: The Emerging Web of Linked Data. IEEE Intelligent Systems, 24(5):87-92, 2009. [8] Chowdhury, N.M.M.K., Boutaba, R.: Network virtualization: state of the art and research challenges. Communications Magazine, IEEE, 2009. [9] Effinger, P.: Automatic Layout of Business Processes. Master Thesis, University of T¨ ubingen, 2008.
DISCUSSION AND FUTURE WORK
In this paper we introduced a linked data domain tailored for large scale networks analysis. We showed how the concepts of Business Network Virtualization is combined with Network Mining aspects towards a Business Network Management. Based on that, we discussed challenges and opportunities by giving directions to existing work. We showed an excerpt of a real-world (technical) integration enterprise network in our Business Network Center to illustrate how systems for large network visibility and analysis could look like. Besides the topics discussed in section 6, future work will be conducted in discovering, infering and making visible further aspects of business networks. Thus letting them grow to cross-enterprise partner networks in one dimention and towards BPM and Business Network Virtualization in the other dimension.Operating the business network is the next logical step towards real time analytics as well as the analysis of query patterns on the network.
995
WWW 2012 – LSNA'12 Workshop
April 16–20, 2012, Lyon, France
[10] Effinger, P.: Layouting Patterns with BPMN Semantics. In: 3rd International Workshop on BPMN, Luzern, 2011. [11] Filipowska, A. Hepp, M., Kaczmarek, M., Markovic, I.: Organisational Ontology Framework for Semantic Business Process Management. 12th International Conference, Business Information Systems (BIS), Poznan, 2009. [12] Graph API, Facebook Inc., 2011, http://developers.facebook.com/docs/reference/api/ [13] Graph Protocol, Facebook Inc., 2011, http://developers.facebook.com/docs/opengraph/ [14] Fetterman, D.: Data Grows Up: The Architecture of the Facebook Platform. In: Spinellis, D et al. (eds.) O’Reilly Media, Inc, pp. 89–109, 2009, O’Reilly Media, Sebastopol (2009). [15] Fielding, R. T.: Architectural Styles and the Design of Network-based Software Architectures. PhD thesis, University Of California, Irvine (2000). [16] Fielding, R. T., Taylor, R. N.: Principled Design of Modern Web Architecture. ACM Transactions on Internet Technology 2(2), 115–150 (2002). [17] Infogrid Web Graph Database. Infogrid, November 2011. URL http://infogrid.org/. [18] Iordanov, B.: HyperGraphDB: A Generalized Graph Database. International Workwshop on Graph Database (IWGD), JiuZhaiGou Valley, China (2010). [19] Hagen, A.: The Open Graph Rotocol Design Decisions. International Semantic Web Conference (ISWC), Shanghai (2010). [20] Hepp, M., Roman, D.: An Ontology Framework for Semantic Business Process Management. Wirtschaftsinformatik, 2007, p. 423–440. [21] Hepp, M., Leymann, F., Dominigue, J., Wahler, A., Fensel, D.: Semantic Business Process Management – A Vision Towards Using Semantic Web Services for Business Process Management. IEEE International Conference on e-Business Engineering (ICEBE), Beijing, 2005. [22] Neo4j Graph Database. Neo Technology, January 2012. URL http://neo4j.org/. [23] Neumann, T., Weikum, G.: The RDF-3X Engine for Scalable Management of RDF Data. MPI-I-2009-5-003, 2009. [24] OMG: BPMN: Business Process Modeling Notation 2.0. Object Management Group (2011).
[25] O’Neill, P., et al.: Topic Overview – IT Service Management. Technical Report, Forrester Research, 2006. [26] Rexster. Rexster, May 2011. URL https://github.com/tinkerpop/rexster/wiki/. [27] Ritter, D., Bhatt, A.: Modeling Approach for Business Networks with an Integration and Business Perspective. ER 2011 Workshops, Br¨ ussel, 2011. [28] Ritter, D., Ackermann, J., Bhatt, A., Hoffmann, F. O.: Building a Business Graph System and Network integration Model based on BPMN. In: 3rd International Workshop on BPMN, Luzern, 2011. [29] Ritter, D., Herrmann, C.: A Graph API for Complex Business Network Query and Traversal. 6th International Conference on Information Systems, Technology and Management (ICISTM), Grenoble, 2012. [30] Rodriguez, M. A., Neubauer, P.: A Path Algebra for Multi-Relational Graphs. International Workshop on Graph Data Management (GDM), Hannover (2011). [31] Rodriguez, M. A., Neubauer, P.: The Graph Traversal Pattern. Graph Data Management: Techniques and Applications eds. S. Sakr, E. Pardede, IGI Global (2011). [32] Rozinat, A., van der Aalst, W.: Conformance Checking of Processes Based on Monitoring Real ˘ S95, 2008. Behavior. Information Systems, 33(1):64ˆ aA¸ [33] SAP AG: Inxight SmartDiscovery Server. http://inxightfedsys.com/products/vizserver/default.asp, SAP AG, 2011. [34] SAP AG: Social Network Analyzer. http://sna-demo.ondemand.com, SAP AG, 2012. [35] Sletten, B.: Resource-Oriented Architectures: Being ”In The Web”. In: Spinellis, D. et al. (eds.) O’Reilly Media, Inc, pp. 89–109, 2009, O’Reilly Media, Sebastopol (2009). [36] W3C: Semantic Web. http://www.w3.org/standards/semanticweb/, 2012. [37] Webber, J., Parastatidis, S., Robinson, I: REST: in Practice: Hypermedia and Systems Architecture. , O’Reilly & Associates, Sebastopol (2010). [38] Wilde, E., Pautasso, C. (eds): REST: From Research to Practice. Springer, Heidelberg (2011).
996