SOMine Viscovery [www.eudaptics.com] was used as the analytical software tool for the analysis of the correlation of variables illustrated in the previous model.
Frost Prediction Characteristics and Classification Using Computational Neural Networks Philip Sallis1, Mary Jarur2, and Marcelo Trujillo2 1
Geoinformatics Research Centre, School of Computing and Mathematical Sciences, Auckland University of Technology, New Zealand 2 Escuela de Computación e Informática, Facultad de Ingeniería Universidad Católica del Maule, Chile
Abstract. The effect of frost on the successful growth and quality of crops is well understood by growers as leading potentially to total harvest failure. Studying the frost phenomenon, especially in order to predict its occurrence has been the focus of numerous research projects and investigations. Frost prone areas are of particular concern. Grape growing for wine production is a specific area of viticulture and agricultural research. This paper describes the problem, outlines a wider project that is gathering climate and atmospheric data, together with soil, and plant data in order to determine the inter-dependencies of variable values that both inform enhanced crop management practices and where possible, predict optimal growing conditions. The application of some novel data mining techniques together with the use of computational neural networks as a means to modeling and then predicting frost is the focus of the investigation described here as part of the wider project. Keywords: Frost Prediction, Data Mining, Neural Networks.
1 Introduction The effects of climate variation impacts on all forms of agriculture and vegetation. Due to the recent focus by many scientists and growers on the phenomenon known as ‘global warming’, reliable means for predicting climate change has gained relevance and importance. Viticulture is considered as a prime area for study because grapevine crops are among the most sensitive of any to climate or environmental variation. The use of contemporary methods for mining data and knowledge discovery to classify and quantify the variables that are identified as being critical for the production of robust computational models is seen as both appropriate and necessary for this problem domain. This paper describes early results from work in frost prediction being undertaken by academic researchers at Auckland University of Technology in New Zealand, Universidad Catolica del Maule in Chile and Universidad de Talca, Chile. The Geoinformatics Research Centre at Auckland University of Technology in New Zealand, is working with scientists and industry in New Zealand, Chile, Uruguay, the United States (Sth California) and Japan to gather a large and complex M. Köppen et al. (Eds.): ICONIP 2008, Part I, LNCS 5506, pp. 1211–1220, 2009. © Springer-Verlag Berlin Heidelberg 2009
1212
P. Sallis, M. Jarur, and M. Trujillo
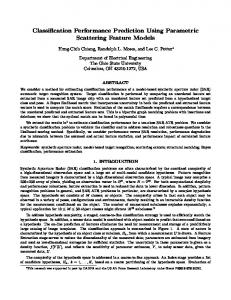
mixed data set that contains climate and atmospheric data, soil and plant data and human sensory perception data in order to ascertain the dependencies that exist between a large number of variables that effect the growth quality of grapes and production quality of wine. This project known as Eno-Humanas (see www.goeinformatics.org) began in August 2007, so is in the early stages of placing sensors in numerous locations and establishing the infrastructure for data collection and processing within a methodology that seeks to correlate precise and imprecise data to produce scenarios for optimal grape growing conditions and also predicts certain factors that influence growth and production [1],[2],[3],[4]. The effects of climate variation impacts on all forms of agriculture and vegetation. Because of the recent focus by many scientists and growers on the phenomenon known as ‘global warming’, reliable means for predicting climate change has gained in relevance and importance especially in Viticulture as grapevine crops are among the most sensitive of any to climate or environmental variation. Many of the previous studies [5], [6] that model and then predict phenomena of frost occurrence and impact consider only the available variables; usually temperature, humidity, wind velocity and precipitation. Some also include atmospheric pressure [7],[8]. It usually depends on the historical data that is held and the types of meteorological stations that are available. With this data it is possible to establish some indicators through various combinations of the variables that intervention should occur. See [9],[10],[11] for descriptions of these studies. In the research described in this paper, some derived values, especially the calculation of dew point (the point in time just before frost falls) are used and the tendency (such as a falling barometer and cloud cover, which determines solar intensity) are included to enrich the combinatorial analysis of the data. We are using Computational Neural Network (CNN) methods to assist with the analysis and modeling of this problem. CNN technologies enable us to develop highly non-linear mathematical models with a relatively low level of computational complexity. With this model and data processing we can analyse large data sets still retain the integrity between the dependent variables while we construct scenarios for different result outcomes. The complexity of data dependencies is represented by a network of relationships, which we can ‘train’ to adapt to new data as it is ingested into the model without losing the intrinsic value of the variable dependencies. By reducing the relationship complexities we can reach a network size that is deeper in ‘meaning’ than the superficial data set might reflect and thus, we discover the extent to which the dependencies (factors relating to frost prediction in this case) really exist. The identification (or classification) of the variables present in such a model, using the Perceptron Multi-layer (MLP) method, is not in itself a sufficient analytical framework for complex data sets such as for the frost prediction problem. Using Kohonen’s SelfOrganising Map (SOM) techniques in conjunction with MLP does establish an appropriate level of participation by the variables in the phenomenon being studied. In this respect, we have used Neucom [www.kedri.aut.ac.nz] to implement a combinatorial approach to building the final model from the findings we have obtained through other data mining techniques. We propose this as a robust analytical platform for application to the frost prediction problem. The World Map in Fig. 1 below shows the climate change potential for frost occurrence based on temperature variation related to latitude. This is an example of the
Frost Prediction Characteristics and Classification Using CNNs
1213
need to collect data from numerous locations and to compare it with other atmospheric and environmental data. Note the similarity between the latitude range 40-50oS as for Chile and New Zealand. The temperature at 10oC is present in both locations but varies in the same latitude spectrum for other longitudinal points around the globe. Most of these are located over the ocean. An interesting comparison is with Sth California, which is 10oC higher (20oC) at Latitude 30oN and Nth California, which is similar to Chile and New Zealand with 10oC at Latitude 40-50oN.
Fig. 1. Wine producing region of the world and climate change. Source: www.thirtyfifty.co.uk/ spotlight-climate-change.asp.
2 Climate Sensor Data for Analysis Using CNN For this early-stage study, data has been made available from the meteorological service collected for 2007 from the Region of O’Higgins in Chile (Fig. 2), provided by CRIA (Regional Information Center Agrometerológica) of the Ministry of
Fig. 2. A map of Chile indicating the O’Higgins Region, which is dominated by vineyards. The city of Santiago, which lies in a basin between high mountains and therefore, has a different climate, is 90kms to the North of this Region.
1214
P. Sallis, M. Jarur, and M. Trujillo
Agriculture of Chile. Using this data we can graph the weather trends and the following results (Fig. 3 and 4) relating to frost occurrence can be seen. Later in the research, it is intended to use comparative data from the network of weather stations set up by the Geoinformatics Research Group from Auckland University of Technology established in NZ, Chile, Uruguay, Southern California and Japan. If the temperature is graphed 5 days prior to an event of frost, as shown in Fig. 3, there is a clear downward trend. Considering this, a first approximation to a prediction model of frost will take 48 hours prior to the event, and only until 3 pm. Temperature 25,0
Temp. °C
20,0 15,0 10,0 5,0 0,0 -5,0 1
7
13
19
25
31
37
43
49
55
61
67
73
79
85
91
97 103 109 115
Temp. °C each hour Frost 1
Frost 2
Frost 3
Fig. 3. Temperature measurements for 5 days, including three frost events where it is possible to observe a trend. In the dotted circle, there is a frost event.
Considering the suggestion proposed by Trought et al. [12] some results are shown below (Figure 4) of the last 48 hours till 3 pm prior to an event occurrence of frost. These results are graphed using the temperature and humidity variables only.
100 90 80 70 60 50 40 30 20 10 0
100 90 80 70 60 50 40 30 20 10 0 1
4
7
10 13 16 19 22 25 28 31 34 37 40 43 46 49 Temperature
Humidity
1
4
7
10 13 16 19 22 25 28 31 34 37 40 43 46 49 Temperature
Humidity
Fig. 4. Temperature and Humidity previous for two cases of frost. There are 48 data points until 3 p.m. in the period.
It can be seen here that it is not sufficient to only consider the variables of humidity and temperature for the prediction process and we propose therefore, to consider the dependency of other variables, such as precipitation, atmospheric pressure and wind velocity.
Frost Prediction Characteristics and Classification Using CNNs
1215
3 Data Dependency and Clustering As stated in the paragraph above, to establish the relationship and dependency (correlation) between climatic variables that are preparing to establish a model to predict the frost is a highly complex. This article aims to establish a method to study the dependencies between variable value data (hence correlations) using neural networks, data mining techniques and SOM. This combinatorial approach will establish relations in the variables that will enable an analytical framework and methodology to be developed for work with those meteorological variables most relevant in accordance with a MultiLayer Perceptron as shown in the generalized work flow model shown in Fig. 5 below.
WEATHER DATA
CLUSTERING NEURAL NETWORK
CLASSIFICATION NEURAL NETWORK
…
Fig. 5. Concept Proposal for the analysis of Weather Data using Self-Organizing Maps (SOM) in order to develop a Computational Multilayer Perceptron (MLP) model for Frost Prediction
SOMine Viscovery [www.eudaptics.com] was used as the analytical software tool for the analysis of the correlation of variables illustrated in the previous model. We considered all the variables that are available to perform the analysis, i.e. temperature (in ºC), RH (relative humidity%), wind speed (wind velocity km / hr), wind direction, wind speed (velocity) and dew point (at º C). In this way the data can be analyzed (and correlated where possible) from different perspectives. The analysis of data is from the months of May and October.
Fig. 6. SOM analysis of date, temperature, relative humidity, dew point, wind velocity and direction
1216
P. Sallis, M. Jarur, and M. Trujillo
A first step in the analytical approach described, is to consider the data by its date stamp, which includes day and time as a concatenated unique key (Date). This can be seen in Fig. 6. In this first depiction it is possible to establish the relationship between temperature and dew point within the low temperatures (blue zone); low temperatures (frost events) are associated with very low wind speed. In order to determine a better defined clustering areas of low temperatures, we resorted to eliminating of some variables, such as the date in (Fig. 7a) and wind speed (Fig. 7b).
(a)
(b)
Fig. 7. SOM analysis of (a) temperature, relative humidity, dew point, wind velocity and direction; (b) date, temperature, relative humidity, dew point, wind direction
Fig. 8. SOM of hour, temperature, relative humidity, dew point, wind velocity and direction
A second analysis of the data relating to the time constraints (in hours). without date. From the analysis of Fig. 8 we can see that selected areas of the coldest (blue zone in the table of temperature, such as low as 1.1 º C) and based on this selection we analysed the hours in which frost occurred. This yields a histogram that is shown in Fig. 9a where schedules are established as a high probability of frost at 3,5 and 7am. The fig. 9b and 9c show histograms with the inclusion of the variables of humidity and wind direction.
Frost Prediction Characteristics and Classification Using CNNs
1217
Hour histogram
Frecuenc y
20 0 Hour (0-23)
Frecuency
Humidity histogram 100 50 0 0
40
50
60
70
80
85
90
95
100
Humidity %
350
320
280
240
200
160
120
100
80
40
0
Frecuency
Wind dir e ction his togr am
20 15 10 5 0
Dir e ction °
Fig. 9. Histogram analysis for (a) hour, (b) humidity and (c) wind direction for cold temperatures
After eliminating the wind speed factor, it is easier to identify classes (clusters) as is depicted in the SOM (Figure 10) below.
Fig. 10. SOM analysis considering the following variables: hour, temperature, relative humidity, dew point, wind direction
1218
P. Sallis, M. Jarur, and M. Trujillo
A third approach is to separate the data by time of day regardless of the other date and then to observe its correlation with each of the individual variables. The analysis represented here in Figure 11 relates to the third hour of increased frequency of frost, at the times of 3, 5 and 7 a.m.
Fig. 11. Preliminary clustering analysis of weather data using SOM of 7, 5 & 3 am
The dependency between the dew point and the temperature variables can be observed in the fig. 6,7,8 and 9 in cold zone (blue zones). In order to compare the results from our analysis using the SOM output exported to a graphing tool for trend depiction, we processed the data relating to humidity (as an example) using data mining software called Mineset [www. Xxxx], which produced exactly the same statistical results thus, confirming our assumptions. The graphical depictions from Mineset are as shown in Fig. 12 below.
Fig. 12. MineSet [Vero Insight, http://www.vero-insight.com/]
The advantage of using the Mineset software after conducting the prior SOM analysis, is the better visualization it provides. However, when we are scaling the data in the preliminary analytical stage, Mineset can also assist with a visual representation, which makes the task of data preparation and understanding of the dynamics of
Frost Prediction Characteristics and Classification Using CNNs
1219
the data relationships considerably easier. These visualizations can be as histograms, scattergrams, three-dimensional (splat) diagrams or tree structures. These are all able to be animated in order to dynamically observe the data relationship distributions.
Fig. 13. Histogram, tree and network depiction examples from Mineset
4 Results and Conclusions In summary from this work so far, have seen the following results: • a correlation between the minimum temperature and dew point so we assume it is necessary to establish their relationship in the hours prior to the dew point event and therefore, we can eliminate one of them to simplify the actual prediction model. • the wind speed in hours of cold is very low, so the ‘critical time’ prediction model can discard this variable unless a velocity in excess of the threshold level is recorded. An alarm can be set in the software analyzing the logged data, which can in turn inform the neural network and ingest this data into the scenario at the time. • the wind direction in times of frost comes mainly from the South - East, namely the influence of the mountain range (Los Andes) in the valley of the Region of O’Higgins in Chile. This will be interesting to compare with the influence of the Southern Alps in New Zealand and similar geospatial factors for other locations in the future. • the use of visualization software tools such as Viscovery and Mineset provides an analytical richness to the data processing task but also potentially could provide a meaningful depiction of the results for use in commercial operations such as in the vineyard. It should be noted that one disadvantage of this preliminary study is the small amount of data available (only 1 year), so it is necessary to add more data to take more robust conclusions. This study focused on the relationship of the variables in the hours of greatest cold (frost), so the next step is to filter the data by studying the cases of 24 hours prior to a frost and establish the relationship between the weather variables. This is in order to
1220
P. Sallis, M. Jarur, and M. Trujillo
generate a prediction model of a robust and reasonable complexity. There are also some indications observed here of the importance of cloud cover at times of extreme cold. Another component of the Eno-Humanas project is using image-processing techniques for this aspect of pattern recognition that we assume will add additional information to the model described here and being further developed as data is collected.
References 1. Sallis, P.J., Shanmuganathan, S., Pavesi, L., Jarur, M.: A system architecture for collaborative environmental modelling research. In: Samari, W.W., McQuay, W. (eds.) The 2008 International Symposium on Collaborative Technologies and Systems (CTS 2008), Irvine, California, pp. 39–47. IEEE, New Jersey (2008) 2. Shanmuganathan, S., Sallis, P.J., Pavesi, L., Jarur, M.: Computational intelligence and geo-informatics in viticulture. In: Al-Dabass, D., Turner, S., Tan, G., Abraham, A. (eds.) Proceedings of the Second Asia International Conference on Modelling & Simulation, Kuala Lumpur, Malaysia, pp. 480–485. IEEE computer society, Los Alamitos (2008) (CD version) 3. Shanmuganathan, S., Ghobakhlou, A., Sallis, P.: Sensors for modeling the effects of climate change on grapevine growth and wine quality. In: Proceeding of the 12th WSEAS International Conference on CIRCUITS (part of the 12th WSEAS CSCC Multi conference), Heraklion, Crete Island, Greece, pp. 315–321 (2008) (invited paper) 4. Sallis, P.J., Shanmuganathan, S., Pavesi, L., Jarur, M.: Kohonen Self-organising maps in the mining data mining of wine taster comments. In: Zanasi, A., Almorza Gomar, D., Ebecken, N.F.F., Brebbia, C.A. (eds.) Data Mining IX, Data Mining, Protection, Detection and other Security Technologies 2008, Cadiz, Spain, May 26-28 (2008); ISBN: 978-184564-110-8, ISSN(print): 1746-4463, ISSN(online): 1743-3517; Transactions on information and Communication Technologies, 40, 125–139, WIT press (2008) 5. Ghielmi, L., Eccel, E.: Descriptive Models and Artificial Neural Networks for Spring Frost Prediction in an Agricultural Mountain Area. Computers and Electronics in Agriculture 54, 101–114 (2006) 6. Prabha, T., Hoogenboom, G.: Evaluation of Weather Research and Forecasting model for two Frost Events. Computers and Electronics in Agriculture 64, 234–247 (2008) 7. Snyder, R.L., de Melo-Abreu, J.P., Matulich, S. (eds.): Frost Protection: Fundamentals, Practice, and Economics. FAO Environmental and Natural Resources Series, Rome, Italy, vol. 1/2, 10 (2005) 8. Ovando, G., Bocco, M., Sayago, S.: Neural Networks for Modeling Frost Prediction. Agric. Téc. 65(1), 65–73 (2005) 9. Temeyer, B.R., et al.: Using Artificial Neural Network to Predict Parameters for Frost Deposition on Iowa Bridgeways. In: Proceedings of the 2003 Mid-Continent Transportation Research Symposium, Iowa (2003) 10. Robinson, C., Mort, N.: A Neural Network Solution to the Problem of Frost Prediction. In: UKACC International Conference on Control. Control 1996, UK, pp. 136–139 (1996) 11. Paras, et al.: A Feature Based Neural Network Model for Weather Forecasting. In: Proceedings of World Academy of Science, Engineering and Technology, vol. 23 (2007) 12. Trought, M.C.T., Howell, G.S., Cherry, N.: Practical Considerations for Reducing Frost Damage in Vineyards, Report to New Zealand Winegrowers (1999)