Jethro Shell, Student Member, IEEE, Simon Coupland, Member, IEEE, Eric Goodyer. AbstractâWireless Sensor Networks (WSN) can produce decisions that are ...
Fuzzy Data Fusion for Fault Detection in Wireless Sensor Networks Jethro Shell, Student Member, IEEE, Simon Coupland, Member, IEEE, Eric Goodyer Abstract— Wireless Sensor Networks (WSN) can produce decisions that are unreliable due to the large inherent uncertainties in the areas which they are deployed. It is vital for the applications where WSN’s are deployed that accurate decisions can be made from the data produced. Fault detection is a vital pursuit, however it is a challenging task. In this paper we present a fuzzy logic data fusion approach to fault detection within a Wireless Sensor Network using a Statistical Process Control and a clustered covariance method. Through the use of a fuzzy logic data fusion approach we have introduced a novel technique into this area to reduce uncertainty and falsepositives within the fault detection process.
I. I NTRODUCTION Technology is becoming increasing ubiquitous in our lives with advances in digital electronics, wireless communications and electro-mechanics forming new and innovative technologies. Wireless Sensor Networks (WSN’s) are an integral part of this new technological development. WSN’s are primarily a large number of sensor nodes which are densely deployed either inside or very close to a phenomenon that requires measurement [1]. Each node consists of a micro-sensor, lowpower signal processor, an ability for local computation, and low-cost wireless networking [15]. Due to the nature of the devices structure and device to device interaction, robustness is a major issue. Wireless data delivery is inherently faulty and uncertain. Nodes can suffer from misbehaviour and failures resulting in data readings being faulty, inconsistent or unreliable. Wireless Sensor Networks, by there very nature, are also deployed into harsh environments. The conditions that the hardware sensor endures may be extreme (underground within mines, deployed within metropolitan networks, underwater monitoring for tsunami detection and animal monitoring are just some [14]). A product of the surrounding conditions can be sensors capturing and transmitting unreliable data and unpredictable network alterations occurring [14]. The nature of WSN applications entails that fault detection is vitally important. Sensors are deployed into highly sensitive application areas that require accurate data recording. WSN’s have been utilised and developed within a multitude of security platforms [8], Intelligent Homes [7], military applications [3], [17] and within the Health-care sphere [22], [20], [9]. As a result, the detection of faults can be vital to the successful operation of the WSN and can be fundamental to the decisions made on the data received. Many techniques have been used within sensor techniques to increase reliability and isolate faulty readings, however this area of research has not been conclusively investigated. Jethro Shell, Simon Coupland and Eric Goodyer are with the Centre for Computational Intelligence, De Montfort University, Leicester, LE1 9BH, United Kingdom. Email: {jethros, simonc, eg}@dmu.ac.uk.
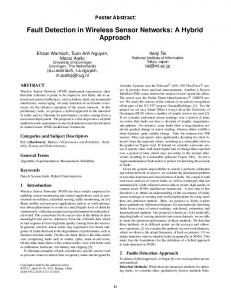
Within this paper we investigate the use of classical techniques for the identification of faults within a defined real world data set. The techniques are taken from both a process control background, and are based upon the use of fusing clustered data. To be able to cope with the uncertainty of the data produced by WSN’s and the inflexibility of the statistical methods, we have looked to fuse these approaches through the use of a data driven fuzzy logic rule based system. The results of this paper show that through the use of a fuzzy fusion method, the fault detection can become extremely precise with the quantity of false-positives presented being greatly reduced as opposed to the use of a classical technique in isolation. To simulate the use of a fuzzy fusion method, a dataset was sought to model the application. The data used is based upon information collected from 54 sensors deployed in the Intel Berkeley Research Laboratory between the 25th February and the 5th April, 2004. The network used XBow Micra2dot weatherboard based nodes to record time-stamped temperature, humidity, light and residual power data of each unit [16]. The layout of the nodes can be seen in Figure 1.
Fig. 1: Diagram of Intel Laboratory Showing Placement of Wireless Sensor Nodes from [16]. Due to the size of the original dataset (over 2.3 million readings) a manageable dataset was formed. The data was segmented into a single days time-stamped temperature reading and formed around a cluster of nodes. The cluster was based on a single sensor node. From this point onwards this node will be referred to as the Cluster Head (CH). The construction of a specific algorithm to choose a CH and define clusters is beyond the scope of this paper. For this specific experiment a CH was chosen at random from within the network. The members of the cluster where based upon a radius of 4.25m around the CH. To produce a cluster of 5 nodes, sensors in significant proximity to corners or walls of the room were isolated. A single CH was chosen for the simulation, node 2, with the cluster incorporating nodes 1,3,4
and 37. The rest of this paper is structured as follows: Section II highlights previous research in the application of rule based fuzzy data fusion. Section III presents an overview of the implementation of classical methods used to evaluate the dataset. Section IV discusses the process of implementing the fuzzy fusion method within the context of the dataset and its results. The paper culminates with section V which summarises the conclusions found and section VI which discusses areas of future work. II. A PPLICATIONS OF RULE -BASED F UZZY DATA F USION The use of a rule based fuzzy data fusion approach to improve performance, increase fault detection or gain extra validity within data processing is widely acknowledged. Methods have been implemented within a number of different application fields and across varying domains. Stover et al [18] highlighted the use of fuzzy logic techniques for the use in data fusion. Within Pennsylvania State University they produced a general purpose fuzzy logic architecture for control of sensing resources, fusion of data for tracking, automatic object recognition, control of system resources and elements, and automated situation assessment. This was then applied to an autonomous vehicle [18]. Sensor data fusion has also been identified as a method for improving the performance of localisation methods. The combination of sensor information from a number of differing sources can provide an overall picture of the locality. A considerable amount of research has been carried out in this area within mobile robotics with the use of fuzzy logic. Jetto et al [5] propose a fuzzy logic adaptation of a Kalman filter to improve the localisation of a mobile robot through the use of fusion of odometric and sonar sensors. Within this paper they proposed a heuristic approach to the formation of the fuzzy logic system as opposed to a data driven model, basing it upon the expertise of the filter designer. Fuzzy logic based sensor fusion has a number of applications in the health-care sector. With the advent of greater ubiquity of technology and the necessary expansion of Assisted Living environments, the monitoring of patients outside of hospitals is vastly becoming the norm. Medjahed et al [11] evaluate the use of a fuzzy logic based system for the telemonitoring of elderly people in a home environment. The system is proposed to detect distress situations using a rule based system. As with the previously discussed system, the rules are based upon an expert system to formulate the membership functions. The ability for fuzzy logic to manage uncertainty and imprecision has also been used within image recognition. Barra and Boire [2] proposed the use of a three-step fusion scheme based upon a rule based fuzzy logic method to automate the segmentation of the sub-cortical brain structure. The fuzzy system is based upon the aggregation of imprecise expert data and previously acquired images in order to form a more defined and less uncertain interpretation. In this instance we can see that Barra and Boire utilised a
combination of a data and expert driven approach in the formation of the fuzzy system. III. C LASSICAL A PPROACHES TO FAULT D ETECTION Fault detection and error analysis are areas of research that span numerous application arenas. Within this paper we will look at two classical approaches that have produced methods to analyse error. A. Statistical Process Control The concept of variation can form the background to understanding whether a process is acting in a controlled manner or not. It is this basis that Statistical Process Control (SPC) has at its foundation. Originally created as a means of controlling production in a manufacturing plant, SPC has progressed into many other areas (management, health-care, education, politics etc.) [4]. The structure of SPC has entailed that its methodology has been applied to many areas of fault and anomaly detection. Ye et al [23] utilised a system based on the SPC methodology to assist within the architecture of a distributed, host based Intrusion Detection System (IDS). Within this system an SPC based Shewhart control chart based on a chi-square distance metric was used for anomaly detection. Thomson et al [19] similarly used a Statistical Process Control method to provide fault detection in a sensed environment. The application of SPC within a combined heat and power (CHP) unit allowed for the system to autonomously distinguish between random and assignable deviations through the application of control limits based on estimates of the standard deviation. Through its use in varying application domains it is evident that SPC has a number of tools available for the the detection of faults, one of which is the use of a control chart. A control chart is a specific type of run chart that can indicate through the setting of thresholds and analysis of data, if a process is stable or if the recorded variation is out of control. This is summarised through the use of the terms [13]: • Common Cause Variation - Variation that is inherent in the process • Special Cause Variation - Variation that is due to real changes in the process To analyse the defined dataset for faults a model was produced that incorporated a control chart. Through the identification of Special Cause Variation we were able to highlight changes within the dataset that fell outside of the control limits of the system. To form this model, a simulation was produced using the defined dataset from a single 24 hour period. In this initial experiment, the focus of the fault detection was placed on the CH. As a result the dataset was reduced to include only this node. Within the SPC approach the decisions are based upon past experience, so a quantity of previous data was accumulated to calculate the limits to base such decisions upon [21]. So as to be able to fully absorb the dataset a sliding time window was used incorporating 30 data points,
Fault Detection using Statistical Process Control 30
lower limit temp upper limit
Degree Celsius
25
Beginning of Fault Detection using SPC 19.6
lower limit temp upper limit
19.4
Degree Celsius
creating a dynamic subgroup at each individual data point. To summarise this data, the mean was taken of the subgroup at each individual time interval. Upper and lower threshold limits were defined for each data point based on the dynamic subgroup. The limits were defined by the mean of the subgroup combined with ±3 standard deviations (σ). The resulting output can be seen in Figure 2.
19.2 19 18.8 18.6 18.4 18.2 18 17.8 02:00 02:30 03:00 03:30 04:00 04:30 05:00 05:30 06:00 06:30 07:00 07:30
Time (Hr:Min)
20
Fig. 3: Beginning of Fault Detection using SPC.
15 10 5 0 02:00 04:00 06:00 08:00 10:00 12:00 14:00 16:00 18:00 20:00 22:00 00:00
Time (Hr:Min) Fig. 2: Fault Detection using Statistical Process Control. The Statistical Process Control method demonstrated fault detection in a number of areas of the dataset. A significant number of faults were shown to occur at the beginning and end of the set. These incidents of Special Cause Variation fell outside the thresholds by a small margin of error. It is evident that a lower standard deviation of the subgroup, and so the narrowing of the threshold scope, results in a higher likelihood in the highlighting of erroneous readings. It is also believed that a high proportion of the results are false positives. It can be seen in Figure 3 that whilst the results are outside of the threshold values, the variation is still within the expected range of the values for Common Cause Variation. The static nature of the SPC method is unable to cope with the uncertainty within the real world sensor records. The variation generated within the dataset was beyond the capacity of the SPC approach to interpret effectively. However, the data driven and experience orientated approach was able to provide a foundation for further developments. B. Cluster-Based Covariance The use of covariance for sensor fusion is a well defined process. Kalman Filters are used within many applications to fuse data and remove noise or uncertainty. The use of a covariance measure within this process is essential. Additionally, Covariance Intersection (CI) is an approach used for combining two or more estimates of variables when correlation between them is unknown [10], [6]. Within this paper, we present a modification of a covariance fusion method, namely a Clustered Covariance Mean
Fusion (CCMF) technique. The formation of the algorithm is based upon the use of calculating the covariance between available nodes within the cluster and the Cluster Head (CH). The formula for the covariance is: cov(x, y) =
Σni=1 (xi − x ¯)(yi − y¯) n
where :• x is the CH current temperature value • y is the node current temperature value • n is the sample quantity (10) To construct a view of the relationship between the CH and the cluster, a mean value is taken of all the covariance readings for each time-stamp. This can be calculated as: n ¯ t = Σi=1 cov(CH, N Ni ) CH n
where :• t is the individual time stamp • CH is the cluster head value • N N is a single node value • n is the number of available nodes in the cluster A threshold was set against the mean covariance to identify incidents of error. As the process is based upon a mean result, a tolerance of −0.1−04 was built into the value to factor in any inverse movement from a single node. This can be shown as: � ¯ is ≥ −0.1−04 0 if CH event(t) = ¯ is < −0.1−04 1 if CH A mean movement of the nodes in a positive direction indicates that a variation in the readings of the CH is reciprocated by the cluster group. A negative reading infers that the cluster temperature readings are moving in the opposing direction or are stable whilst the CH is fluctuating. The results of the simulation using the defined dataset can be seen in Figure 4.
0.2
Covariance
produced by the Wireless Sensor Network, would be able to supply a fault detection methodology able to reduce falsepositives and assist in the essential decision making process.
0.15
IV. F UZZY F USION FOR FAULT D ETECTION WITHIN W IRELESS S ENSOR N ETWORKS
0.1 0.05 0 -0.05 -0.1 -0.15 02:00 04:00 06:00 08:00 10:00 12:00 14:00 16:00 18:00 20:00 22:00 00:00
Time (Hr:Min) Fig. 4: Fault Detection using CCMF.
Through analysis of the data it is evident that there are a cluster of faults that are detected within three distinct segments of the time sequence. These segments are replicated within the SPC results but in a greater and less defined nature. Overall the CCMF approach produces a reduced number of instances of erroneous readings in comparison to the SPC method although correlations between the sets of results can be seen. The CCMF method shows peaks of results around similar time-stamps to that of the SPC result. There is an extremely strong correlation at a single time-stamp. A noticeable drop occurs in the CCMF measurement coupled with a dramatic shift outside of the SPC thresholds at timestamp 8:02:17. This coincides with the temperature dropping to a recording of 3.4068◦ C. This is deemed to be a very defined fault in the sensor reading. As the CCMF approach uses the readings from surrounding nodes any variation in a single node is incorporated into the covariance reading. Whilst the impact of this is reduced through the use of the mean of the covariance of the cluster nodes, this method is still impacted by this process. The CCMF is prone to issues when only a single node is used in the covariance calculation. This can occur if the time interval generates only a single node covariance with the Cluster Head (CH). If the CH has a stable temperature and there is variation within the single node, a negative CCMF value would be produced. Overall the CCMF approach is able to produce fault detection based on the status of the nodes surrounding a single node. In this way it differs from the SPC approach as it is able to take into account locality and node-to-CH relationship. SPC, however utilises a data driven knowledge based approach formed from information gathered from data within the system itself. Both methods are able to supply a separate view of the issues that are encountered within the system, additionally both have failings that result in falsepositives being produced. The combining of these methods and the incorporation of a process to deal with the uncertainty
Within this paper we present a Fuzzy Data Driven Fusion (FuzzyDDF) method for the analysis of fault detection within a Wireless Sensor Network dataset. To produce this fusion method, a combination of the SPC and CCMF methods highlighted previously were used together to produce a new detection technique. Using the same simulation software that was produced for the SPC and CCMF approaches, a simulation was modelled in combination with the use of Matlab software to produce the FuzzyDDF process. The basis for FuzzyDDF was a fuzzy logic system, used to fuse the outputs of both the Statistical Process Control (SPC) method and the Clustered Covariance Mean Fusion (CCMF) technique. To form the dataset necessary to construct the fuzzy logic system, the SPC and CCMF outputs for a single 24hr period were taken. These results were combined to form a single dataset. The integration of the data was based upon sequential time-stamped SPC readings and the nearest comparable CCMF result within a 30 second time frame. The construction of the fuzzy logic system was handled with use of the Matlab suite of software. Each of the two inputs were constructed in separate ways due to the nature of their implementation and impact upon the system as a whole. The SPC method utilises an approach that sets dynamic thresholds based on the data. As a result, each of the Membership Function (MF) for the SPC would equally need to be dynamic for each input. The MF’s for the SPC were defined as Low (Sigmoidal), Medium (Gaussian) and High (Sigmoidal). Each are defined by the use of the mean of the rolling 30 piece sample taken. They were then formed using the standard deviation (σ) of the sample. The Low MF was defined as −3σ and High MF was defined as +3σ. Figure 5 shows the MF’s for this fuzzy logic system. Low
1
Degree Of Membership
Covariance Mean Measurement
Fault Detection using CCMF
High
Medium
0.5
3σ
0 −3σC
C
+3σC
SPC Value at Time (t)
Fig. 5: Statistical Process Control Membership Functions. The CCMF was specified using a rigid system. Three MF’s
were defined as Low (Sigmoidal), Medium (Gaussian) and High (Sigmoidal). Unlike many of the systems outline in Section II, FuzzyDDF uses a data driven approach to define the rules within the fuzzy system. The overall rules for the Fuzzy system were constructed as: Rules # 1 2 3 4 5 6 7 8 9
Antecedents SPC Input CCMF Input Low Low Low Medium Low High Medium Low Medium Medium Medium High High Low High Medium High High
Consequents Fault Detected Very High Medium High Low Low Very Low Very High Medium Very High
TABLE I F UZZY S YSTEM RULES FOR F UZZY DATA D RIVEN F USION .
Based on the rules outlined in Table I, the output produced was formed using 5 Membership Functions (MF). These consisted of Very Low (Sigmoidal), Low (Gaussian), Medium (Gaussian), High (Gaussian) and Very High (Sigmoidal). Following a defuzzification process, an overall Fault Detection Degree of Membership was produced. The overall results of these findings can be seen in Figure 6. Fault Detection using Fuzzy Data Driven Fusion Method Degree of Membership
1 0.9 0.8 0.7 0.6 0.5 0.4
information than either the SPC or CCMF techniques. As a result informed decisions can be made from the data that is supplied to a finer granularity. To set a crisp output from the FuzzyDDF results, a threshold was set for the Degree of Membership at 0.9. As a result, a single very distinct point of fault detection was highlighted by this approach. This point concurred with the SPC and CCMF systems that highlighted a fault at timestamp 8:02:17. It can be inferred from these results that by fusing the SPC and CCMF techniques, fewer faults were detected. A more stable dataset was depicted by FuzzyDDF as the uncertainty inherent within a WSN was removed by the fuzzy system. Lower thresholds were shown to identify similar results to those identified at a threshold of 0.9, however the reduction of the threshold value produced greater false-positives. Results taken at a threshold of 0.6 showed a number of falsepositives. In comparison to the classical methods in isolation this reduced threshold only identified 2.46% of the results incorrectly. The SPC approach identified 78.45% of the timestamps as false-positives with the CCMF method producing a result of 12.88%. The differing quantities of false-positives detected by the three methods tested within this paper are shown within Table II. Time 02:00:00 04:00:00 06:00:00 08:00:00 10:00:00 12:00:00 14:00:00 16:00:00 18:00:00 20:00:00 22:00:00 00:00:00 Total:
SPC
CCMF
95 79 52 0 0 1 80 157 137 130 128 0 859
3 4 9 3 2 12 11 10 15 42 30 0 141
FuzzyDDF Threshold 0.6 0 0 0 17 5 0 5 0 0 0 0 0 27
FuzzDDF Threshold 0.9 0 0 0 0 0 0 0 0 0 0 0 0 0
0.3
TABLE II
0.2
FALSE -P OSITIVE R ESULTS FOR FAULT D ETECTION T ECHNIQUES .
FuzzyDDF FuzzyDDF Threshold
0.1 02:00 04:00 06:00 08:00 10:00 12:00 14:00 16:00 18:00 20:00 22:00 00:00
Time (Hr:Min)
Fig. 6: Fault Detection using Fuzzy Data Driven Fusion Method. Overall the results were shown to be united in a focused pattern between a Degree of Membership of 0.3 and 0.5. The results produced two very distinctive peaks at timestamps 08:02-09:31 and 14:20-14:47. These fault detection spikes can be associated with decreases in either the CCMF value or higher variations in the SPC reading. However due to the fusion approach, the uncertainty in the readings is factored into the system. It is evident from these results that the FuzzyDDF method is able to supply a greater depth of
It was identified within the dataset that there is only a single true faulty event at time-stamp 8:02:17 1 . This is identified by all three systems, however it is evident that in the case of the SPC and CCMF methods this was coupled with a high number of false-positives. V. C ONCLUSIONS This paper has demonstrated the use of a novel fuzzy data driven fusion method in the context of Wireless Sensor Networks. The methodology was to combine the use of two classical approaches, Statistical Process Control (SPC) and a clustered covariance approach. In combining these methods, the technique was able to isolate instances of failure within 1 In
this context an event is defined based upon the analysis of the dataset.
the defined data set with fewer perceived instances of falsepositives and a higher degree of accuracy than classical methods alone. The use of SPC was shown to highlight faults in a number of areas across the data set. Whilst the simplistic nature of this approach allows for its adoption into a high number of applications, when applied to uncertain and noisy data its lack of complexity produces a high number of false-positives. The use of a covariance based method highlighted a change in the possible approach to fault detection within Wireless Sensor Networks (WSN’s). By fusing a number of sensor readings from nodes surrounding a cluster head, this approach gave a methodology based on the use of additional sensor information fusion based on locality and time. As with the SPC technique, a high number of false-positives were produced as a result of the inflexibility in the nature of the thresholds that are set. VI. F UTURE W ORK In order to enhance the work carried out in this paper the developments already produced within the simulated environment are to be replicated within an experimental real world sensor network. We believe that through the creation of a controlled real world setting a “ground truth” can be established in which uncertain events such as false-positives and false-negatives (events that lacked in the dataset analysed within this work) can be injected. This will allow for a more vigorous analysis of the proposed technique. Further, utilising this experimental network we will look towards developing a comparison with an expert based system as this will offer a true comparison to the level of consistent detection shown by the fuzzy fusion approach. Additionally within this paper there is a large scope for the extension of methods discussed to advance the complexity of the overall methodology. There is scope to investigate the use of other Fuzzy Logic Systems (FLS) such as Type2 fuzzy sets, specifically the use of interval type-2 fuzzy sets as they are able to minimise the effects of uncertainty within rule based fuzzy systems[12]. There is also scope to add levels to the complexity of the fused classical methods. The Statistical Process Control method used can be deemed to have been simplistic in nature. The use of methods such as Cumulative Sum (CUSUM) and Exponentially Weighted Moving Average (EWMA) could add greater depth to the fusion methodology. ACKNOWLEDGEMENTS The authors would like to thank MIT Computer Science and Artificial Intelligence Laboratory for the provision of the Wireless Sensor Network dataset used in this work. R EFERENCES [1] IF Akyildiz, W. Su, Y. Sankarasubramaniam, and E. Cayirci. Wireless sensor networks: a survey. Computer networks, 38(4):393–422, 2002. [2] V. Barra and J. Y. Boire. Automatic segmentation of subcortical brain structures in mr images using information fusion. Ieee Transactions On Medical Imaging, 20(7):549–558, July 2001.
[3] T. Bokareva, W. Hu, S. Kanhere, B. Ristic, N. Gordon, T. Bessell, M. Rutten, and S. Jha. Wireless sensor networks for battlefield surveillance. In Proceedings of Land Warfare Conference 2006. Citeseer. [4] L.A. Doty. Statistical process control. Industrial Press Inc., 1996. [5] L. Jetto, S. Longhi, D. Vitali, et al. Localization of a wheeled mobile robot by sensor data fusion based on a fuzzy logic adapted Kalman filter. Control Engineering Practice, 7:763–771, 1999. [6] SJ Julier and JK Uhlmann. A non-divergent estimation algorithm in the presence of unknowncorrelations. In American Control Conference, 1997. Proceedings of the 1997, volume 4, 1997. [7] C.D. Kidd, R. Orr, G.D. Abowd, C.G. Atkeson, I.A. Essa, B. MacIntyre, E. Mynatt, T.E. Starner, W. Newstetter, et al. The aware home: A living laboratory for ubiquitous computing research. Lecture notes in computer science, pages 191–198, 1999. [8] Y.Y. Li and L.E. Parker. Intruder detection using a wireless sensor network with an intelligent mobile robot response. In IEEE SoutheastCon. Citeseer, 2008. [9] D. Malan, T. Fulford-Jones, M. Welsh, and S. Moulton. Codeblue: An ad hoc sensor network infrastructure for emergency medical care. In International Workshop on Wearable and Implantable Body Sensor Networks, volume 5. Citeseer, 2004. [10] C. Martin, E. Schaffernicht, A. Scheidig, and H.M. Gross. Multi-modal sensor fusion using a probabilistic aggregation scheme for people detection and tracking. Robotics and Autonomous Systems, 54(9):721– 728, 2006. [11] H. Medjahed, D. Istrate, J. Boudy, and B. Dorizzi. A fuzzy logic system for home elderly people monitoring (EMUTEM). In Proceedings of the 10th WSEAS international conference on Fuzzy systems, pages 69–75. World Scientific and Engineering Academy and Society (WSEAS), 2009. [12] J.M. Mendel and R.I.B. John. Type-2 fuzzy sets made simple. IEEE Transactions on Fuzzy Systems, 10(2):117–127, 2002. [13] J.S. Oakland. Statistical process control. Butterworth-Heinemann, 2007. [14] Daniel Minder Pedro Jose Marron, Stamtis Karnouskos. Research Roadmap on Coopearting Objects. Technical report, CONET consortium, 2009. [15] GJ Pottie and WJ Kaiser. Wireless integrated network sensors. Communications of the ACM, 43(5):51–58, 2000. [16] Madden Samuel. Intel lab data, Jun 2004. ´ L´edeczi, G. Balogh, B. Kusy, A. N´adas, [17] G. Simon, M. Mar´oti, A. G. Pap, J. Sallai, and K. Frampton. Sensor network-based countersniper system. In Proceedings of the 2nd international conference on Embedded networked sensor systems, pages 1–12. ACM New York, NY, USA, 2004. [18] J. A. Stover, D. L. Hall, and R. E. Gibson. An autonomous fuzzy logic architecture for multi-sensor data fusion. IEEE TRANSACTIONS ON INDUSTRIAL ELECTRONICS, Vol. 43 No.3:143150, 1996. [19] M. Thomson, PM Twigg, BA Majeed, and N. Ruck. Statistical process control based fault detection of CHP units. Control Engineering Practice, 8(1):13–20, 2000. [20] Q. Wang, W. Shin, X. Liu, Z. Zeng, C. Oh, B.K. AlShebli, M. Caccamo, C.A. Gunter, E. Gunter, J. Hou, et al. I-Living: An open system architecture for assisted living. Citeseer, 2006. [21] D.J. Wheeler and D.S. Chambers. Understanding statistical process control. Addison-Wesley, 1990. [22] A. Wood, G. Virone, T. Doan, Q. Cao, L. Selavo, Y. Wu, L. Fang, Z. He, S. Lin, and J. Stankovic. ALARM-NET: Wireless sensor networks for assisted-living and residential monitoring. University of Virginia Computer Science Department Technical Report, 2006. [23] N. Ye, S.M. Emran, X. Li, and Q. Chen. Statistical Process Control for Computer Intrusion Detection. In discex, page 0003. Published by the IEEE Computer Society, 2001.