IEEE TRANSACTIONS ON POWER DELIVERY, VOL. 27, NO. 4, OCTOBER 2012
1885
Fuzzy Dynamic Thermal Rating of Transmission Lines Hamid Shaker, Student Member, IEEE, Mahmud Fotuhi-Firuzabad, Senior Member, IEEE, and Farrokh Aminifar, Member, IEEE
Abstract—Dynamic thermal rating (DTR) of transmission system facilities is a way to maximally realize the equipment capacities while not threatening their health. With regards to transmission lines, the allowable current of conductors is forecasted based on the environmental situations expected in some forthcoming time periods. Due to the fact that weather conditions continuously vary, sampling points are very limited against many line spans, and the measurements have an inherent error, uncertainties must be appropriately included in the DTR determination. This paper adopts the fuzzy theory as a strong and simple tool to model uncertainties in the DTR calculation. Since DTR intends to determine the line capacity for some periods ahead, the capability of fuzzy computation in predicting future phenomena is very fruitful here. In the proposed model, variables, such as ambient temperature, wind speed, wind direction, and solar hour angle are assumed to be fuzzy numbers. Numerical simulations are provided based on inputs taken from real databases and reasonable assumptions as well. The results obtained support the validation and efficiency of the proposed model. Index Terms—Dynamic thermal rating (DTR), fuzzy theory, steady-state heat balance, transmission capability.
NOMENCLATURE Projected area of conductor to the sun per unit length . Solar azimuth constant (in degrees).
Thermal conductivity of the air at temperature . Latitude of the line (in degrees). Number of spans of the line. Day of the year. Convective heat loss rate per unit length (in watts per meter). Radiated heat loss rate per unit length (in watts per meter). Solar heat gain rate to the conductor per unit length (in watts per meter). Total solar radiated heat flux rate at sea level and elevation corrected, respectively . AC resistance of the conductor at temperature . Ambient and conductor temperature, respectively . Wind speed (in meters per second).
Conductor diameter (in millimeters).
Azimuth of the sun and the line, respectively (in degrees).
Altitude of the sun and its respectively (in degrees).
Solar absorptivity of the conductor (0.23,0.91).
,
of fuzzy number
Elevation of conductor above sea level (in meters).
Fuzzy cosine function of
Conductor allowable current (in amperes).
Fuzzy sine function of
Allowable current of span and the line, respectively (in amperes).
Lower bound of
.
Upper bound of
.
Wind direction factor.
. . .
Solar declination (in degrees).
Manuscript received June 25, 2011; revised December 30, 2011 and February 25, 2012; accepted March 14, 2012. Date of current version September 19, 2012. Paper no. TPWRD-00545-2011. H. Shaker was with the Department of Electrical Engineering, Sharif University of Technology. He is now with the Electrical and Computer Engineering Department, University of Calgary, Calgary, AB T2N 1N4 Canada (e-mail:
[email protected]). M. Fotuhi-Firuzabad and F. Aminifar are with the Department of Electrical Engineering, Center of Excellence in Power System Management and Control, Sharif University of Technology, Tehran 11365-11155, Iran (e-mail:
[email protected];
[email protected]). Digital Object Identifier 10.1109/TPWRD.2012.2193672 0885-8977/$31.00 © 2012 IEEE
Emissivity on conductor’s surface (0.23, 0.91). Angle between wind and axis of the conductor (in degrees). Density of the air (kg/m ). Effective angle of incidence of the sun’s rays (in degrees). Membership function of fuzzy number
.
1886
IEEE TRANSACTIONS ON POWER DELIVERY, VOL. 27, NO. 4, OCTOBER 2012
Dynamic viscosity of the air (Pa-s). Solar hour angle (in degrees). Solar azimuth variable.
I. INTRODUCTION
F
OLLOWING the recent power system restructuring, competitive electricity markets play a vital role in the operation of power systems. The advent of energy trading between market entities along with the ever demand increase bring about overloaded conditions on transmission systems. Accordingly, upgrading the transfer capability of transmission systems is indispensable. Constructing new lines and realizing the maximum capacity of existing lines are two possible solutions. The latter solution, in contrast to the former, which is very costly and timeconsuming, has appealed a great interest in recent years. In this sense, application of flexible ac transmission system (FACTS) devices and dynamic thermal rating (DTR) of congested transmission lines are recognized as most effective and promising solutions. Thermal line rating is computed given the worst weather conditions such as a very low wind speed and a high ambient temperature and often kept constant during a season or even a year [1], [2]. These conservative assumptions restrict the ability of line carrying capacity whenever the weather condition is less stressful. To this end, using real-time meteorological data in the computation of line’s capacities would improve the operating efficiency of transmission networks. This notion is the main idea behind DTR. The concept of dynamic rating was proposed by Davis in 1977 and its formulation was developed and compared with controversial rating method in a series of papers [3]–[6]. In the proposed approach, instead of nominal rating of a line, the allowable current capability of the line’s conductors was estimated for limited time periods ahead. This estimation is based on the real-time weather conditions around the line’s conductor including the temperature, the wind speed and its direction, and the heat of solar radiations. Increasing the loadability of transmission system, in addition to the normal operating condition, would improve the tolerability of the system during the event of N-1 contingencies. Accordingly, the operators are enabled to reliably serve load points and efficiently secure financial profits, particularly at the event of contingencies [7]. On the other hand, if the weather condition is worse than those assumed for determining the nominal rating of the line, we can protect the line conductors from overheating and serious damages. As yet, a number of models have been proposed to evaluate the thermal behavior of a conductor. In these models, heat balance equations of the line’s conductor are employed to estimate its temperature in various conditions. These equations are applied using real-time monitoring of weather conditions to determine the dynamic rating of the line. In [2], thermal balance equations of the conductor were used for thermal line uprating by the temperature of the conductor and weather monitoring. To handle uncertainties of the wind
speed and direction in power line ampacity prediction, [8] applied Nusselt number by using time series stochastic modeling in convective heat loss rate assessment of the conductor. Besides, application of dynamic rating and its field studies were discussed in [9]–[11]. In [12], real-time monitoring of a HV transmission line was applied through a new method based on the sag monitoring of the line. Reference [13] discussed the real-time monitoring of the conductor’s conditions and its importance for assessing the real-time rating. In addition, a DTR system was presented in [14] which uses real-time weather information for the optimization of transmission path utilization under N-1 contingency conditions. Moreover, DTR models and monitoring by means of different equipment were discussed in [15]. In [16], another set of equations based on a scaling factor was utilized for assessing the dynamic rating of the lines. Reference [1] used some differential equations for estimating the DTR of the line for reducing the calculation time. In [17], a new method designated as Affine arithmetic has been proposed that is based on least squares of inaccuracies for entering errors in calculations. In addition, the effects of meteorological data and measurement time intervals on the performance of DTR calculations were analyzed in [18]. A great deal of uncertainty exists in the measurements required for DTR. Among them are measurement inherent errors, few sampling points assigned for several line spans, and the weather continuous changes. In order to achieve more realistic estimation of the line rating, one should consider uncertainties in the calculation. Probabilistic tools, although are appropriate for representing the uncertainties associated with the parameters, are rather limited due to either necessity of having a given standard probability distribution for the uncertain parameter or the computational burden imposed [17]. Moreover, when the dynamic rating is calculated for the instant of measurements, it would not be necessarily valid for duration between current and next instants of measurements. Uncertainties associated with the problem parameters are accommodated in the calculation. Among the variables, the wind speed is recognized as the most variant one. To characterize the wind uncertainty, fuzzy modeling is adopted as the most powerful approach. Meteorological variables such as wind speed and ambient temperature could be properly described by fuzzy sets [19]. Thus, based on the requirements described above, this paper attempts to fulfill DTR calculation of transmission lines through the fuzzy theory. Reference [20] uses fuzzy reasoning to optimally control thermal overloading of transmission lines. Besides, a fuzzy-based control system for transmission line ampacity calculation was previously proposed in [19]. Meanwhile, the future forecasting of the weather conditions is considered during the DTR calculation. This feature makes possible longer intervals of the weather condition sampling preserving accuracy of the results. Numerical simulations are conducted based on data partially taken from real databases and remaining assumed in reasonable ranges. Both fuzzy and crisp analyses are carried out to illustrate the efficiency of the proposed methodology. Rather comprehensive discussions are raised to justify the applicability of the method in real cases. The rest of this paper is outlined as follows. In Section II, the standard method to assess the thermal rating of overhead
SHAKER et al.: FUZZY DYNAMIC THERMAL RATING OF TRANSMISSION LINES
1887
transmission lines is reviewed. In Section III, following a brief introduction of general notions of fuzzy theory, DTR calculation is performed by fuzzifying the formulations. Numerical analyses and concluding remarks are given in Sections IV and V, respectively.
putational efficiency is an important issue associated with fuzzy analyses. Kaufman and Gupta showed that the computation for fuzzy analyses could be reduced by composing membership functions into and conducting mathematical operations on these intervals [23]. Each fuzzy number is shown by its , which is defined by (3).
II. THERMAL RATING ASSESSMENT OF OVERHEAD LINE
(3)
A. Heat Balance of Overhead Line’s Conductor Thermal behavior of bare overhead line’s conductor can be described under steady-state conditions of wind speed and its direction, ambient temperature, solar radiation, and electric current of the conductor [17], [21]. Equation (1) denotes the heat balance equation of the conductor (1) Therefore, the maximum allowable current capacity of the conductor under given weather conditions is as follows: (2) The allowable temperature of the conductor is likely different for steady-state and dynamic conditions. Associated with each condition, nonidentical allowable currents are thus obtained. It is worth noting that because the line comprises many spans and their conditions are not the same, the allowable current of each span may differ from that of the others. Logically, the lowest value of allowable currents calculated for all spans is adopted as the line rating. B. Assessment of Heat Loss Rates The convective heat loss rate of a conductor is estimated with the maximum , , and , which are valid in low, high, and zero wind speeds, respectively. They are a function of wind speed and direction, air and conductor’s temperature, dynamic viscosity and density of the air, and the conductor’s diameter. More explanations of the equations can be found in [21]. Radiated heat loss rate of the conductor is a function of conductor’s diameter, ambient and conductor’s temperature, and . The darker surface of the conductor absorbs more heat; hence, its radiated heat decreases. is in the range of (0.23,0.91) depending on the condition of the conductor surface. For more descriptions, see [21]. C. Assessment of Solar Heat Gain Rate The solar heat varies in different seasons and times of the day. Its energy depends on , , , and . is normally assumed to be equal to . is in the range of and lies in the range of (0,90) . The heat flux density of the sun depends on solar altitude, atmosphere clarity, and . Reference [21] describes the related equations. III. FUZZY MODEL OF OVERHEAD LINE DYNAMIC RATING A. Basics of Fuzzy Numbers In this section, some major properties of fuzzy numbers are explained and the others can be found in [22]–[24]. The com-
Here, we show
of fuzzy number
by (4)
Once s of a fuzzy number are determined, we can apply all fuzzy calculations and then compute final results associated with s. 1) Defuzzification of Fuzzy Numbers: In order to utilize the fuzzy results in practical activities, they usually must be converted into crisp numbers. In this sense, a variety of methods exist. Some of them are magnitude [25], distance [26], Centroid point [27], and expected value [28]. The one employed in this paper is Centroid point shown by (5) where and are, respectively, minimum and maximum limits of that have a nonzero membership grade of fuzzy number . B. Proposed Model As noted earlier, the thermal rating of overhead lines is influenced by various parameters whose uncertainties are to be considered by fuzzy numbers. Accordingly, the calculation initiates by the fuzzification of input parameters. The air temperature is a parameter to be shown by a fuzzy number. It may change during different time periods. In addition, the respective measuring devices have also inherent inaccuracies. The convective heat loss rate is in terms of many variables where only the wind speed, its direction, and undergo changes during the period of capacity estimation. Other parameters as a function of are pendent variables. Also the radiated heat loss rate is a function of . For estimating the solar heat flux rate, the only parameter that has sensible changes is and consequently modeled by a fuzzy number. The atmosphere clearance and surface of the conductor do not have noticeable variations; hence, they are assumed constant during the period of estimating dynamic rating. Other variables are not independent since they are functions of . It should be noted that longer time periods necessitate a wider membership function for fuzzy . Thus, four fuzzy numbers associated with , , , and must be determined. Their membership functions are shown by , , , and , respectively. The rest of this calculation is to determine coefficients of equations presented in [21]. Thereafter, the fuzzy model of allowable current capability of the line is computed. Fuzzy membership function of line’s rating is applicable if a fuzzy load flow
1888
IEEE TRANSACTIONS ON POWER DELIVERY, VOL. 27, NO. 4, OCTOBER 2012
is used [28], [29]. Otherwise, the final solution is defuzzified. These steps are explained in the following subsections. 1) Fuzzy Model of Air Density: Sum or multiplication of a crisp number with a fuzzy one does not change the shape of membership function of the fuzzy number [23]. So
where is crisp and obtained as
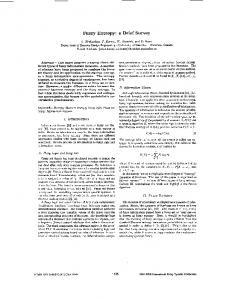
(6) is fuzzy. Then, fuzzy air density is Fig. 1. Membership function of the fuzzy wind direction factor.
(7) That (8) And is a crisp number. 2) Fuzzy Model of Air Dynamic Viscosity: There is a positive power 1.5 in equation. As this function is monotonically increasing [21], the power is directly applied to the membership function of [23].
fuzzy , may be less than 0.4 or greater than 1. To overcome this deficit, once the membership function was calculated, it is cut at the desired crisp range. For example, if the triangle fuzzy is (30, 45, 60), the crisp for 30 and 60 is 0.774 and 0.916, respectively, which are the minimum and maximum possible . Thus, we would cut the membership function of out of the [0.744, 0.916]. Fig. 1 shows the calculated range of fuzzy in [0.55, 1.16] by the dotted line. The modified fuzzy number is shown by the solid line, which is only between 0.774 and 0.916. 5) Fuzzy Model of Convective Heat Loss Rate: In this section, for the sake of simple representation, and are shown by and , respectively. Therefore (12)
(9) 3) Fuzzy Model of Air Thermal Conductivity: As implied earlier, positive powers 1 and 2 are directly implemented to
(13) Since
(14)
(10) 4) Fuzzy Model of Wind Direction Factor: The effect of trigonometric functions on the of a fuzzy number has been discussed in [23]. After determining fuzzy numbers of , , and , the fuzzy wind direction factor is estimated by
is always positive, we have
(15) and
(16) (11) The calculations just shown require more discussions. is in the range of [0, 90] and crisp monotonically increases in this range. Thus, the range of all possible crisp wind direction factors would lie on [0.4, 1]. However, when applying fuzzy mathematics, the range of final fuzzy results does not commonly lie in the crisp acceptable range. This indicates that the resulting
, , and should be adopted The maximum value of as the total convective heat loss rate (i.e., ). Since , , and are calculated as fuzzy numbers, the fuzzy maximum operator [22], [23] yielding (17) is applied
(17)
SHAKER et al.: FUZZY DYNAMIC THERMAL RATING OF TRANSMISSION LINES
1889
6) Fuzzy Model of Radiated Heat Loss Rate: For calculating the radiated heat loss rate, the only fuzzy variable is . Therefore, we have
Equation (26) is conditional. The appropriate amount of is utilized with respect to , , and . For every value of , is estimated using the technique proposed in [21]. The in (26) should be positive or negative throughout its domain; otherwise, we must reform its membership function. Since the solar radiation before and after noon is symmetrical (regardless of the effects of clouds and air pollution), we shift all numbers to one side of zero. For example, for , we reform it to either or [0,1]. If variations are not symmetrical with respect to zero, we have to create a stepped membership function so that the membership degrees are proportionally selected based on weights equal to the absolute value of each number within the time duration. Considering these assumptions
(18)
of
7) Fuzzy Model of Heat Gain Rate of the Sun: The is shown by
cut
(27)
(19) Since the probability of each moment of the time is equal for all durations, the cut of is considered by a rectangular membership function with the membership degree equal to 1 for all moments of its duration. In the preceding sections, and were used as fuzzy trigonometric functions implemented on the desired cut. Thus, the cut of is calculated as follows:
(20) Since apply it to the
is monotonically increasing, we directly cut. Hence
As in the range of [0, 90] is positive, calculated as follows:
cut of
and (28) Finally, we can calculate
of
as follows: (29)
In (29), it may encounter to negative values for . In such a case, similar to modifying the membership function of , the membership function of is cut in undesired (negative) ranges. 8) Fuzzy Model of Overhead Line Allowable Current: From (2), the fuzzy allowable current of the overhead line associated with spans equipped with measurements is calculated as expressed by
(21) is (30) The ultimate step is to apply a fuzzy minimum operator on fuzzy allowable current of all spans. That is (31) (22)
and (23) Also, for
(24) and
(25)
The formulations developed in this paper are very comprehensive and applicable for all shapes of membership functions including triangular, Gaussian, Z shape, S shape, trapezoidal, rectangular and others representing a fuzzy number. Selection of appropriate membership functions are done based on subjective knowledge of the practitioners, historical recorded data, the accuracy of measuring devices, weather conditions, and weather forecasts during each period. It is worth noting that the sensitivity of solution to membership functions decreases with shortening the evaluation periods. This observation is due to the fact that fewer changes in weather conditions are expected. IV. NUMERICAL EXAMPLE A. Dynamic Thermal Rating Assessment of an Arbitrary Transmission Line
Therefore
(26)
An overhead transmission line with only one measurement station is assumed here and calculation of its dynamic rating
1890
IEEE TRANSACTIONS ON POWER DELIVERY, VOL. 27, NO. 4, OCTOBER 2012
Fig. 2. Air temperature over the measurement horizon
.
Fig. 4. Wind direction over the measurement horizon (in degrees).
Fig. 5. Fuzzy number of DTR at hour 10 with a 30-min time interval. Fig. 3. Wind speed over the measurement horizon (in meters per second).
during 10 hours of a day is interested. The line has the following characteristics:
East-Northeast Clear air The static rating of this line is calculated at C and 0.6 m/s that is equal to 945 A. The station is assumed to be located in Yazd, Yazd Province, Iran, and calculations are done for Oct. 1, 2009, that is, the 274th day of the year (i.e., 274). In this day, sunrise and sunset are respectively at 5:46 and 17:38 and the noon is at 11:42. Therefore, the duration of the day is 11:52 h. Each day is 180 solar degrees. Thus, associated with each official hour, we have 15.17 of solar hour. As an instance, at 11:42 is zero and at 10 A.M. it is 1.7 15.17 25.79 . Figs. 2–4 show variations of , , and within 10 h from 10 A.M. to 8 P.M. The measurement errors of and are 0.1 C and 0.2 m/s, respectively. The error of is 1 . Assume that a complete forecasted weather condition is available for the former period that dynamic rating is of interest. Thus, the membership function for all parameters but is made by a trapezoidal shape. The domain of the membership function is equal to the possible range of the corresponding parameter. The upper base length of the trapezoid is selected from all measured and forecasted values of
that parameter and its center is the mean value of all measured quantities. The dynamic rating of the line is estimated using both fuzzy and crisp methods and the results obtained are compared with each other and with the nominal rating. Three various time intervals of 0.5, 1, and 1.5 h are assumed for the DTR evaluation. The membership function of each parameter is constructed based on its changes within the former period. Since the line under study has only one measurement station, the fuzzy number of its dynamic rating is the allowable current of the span on which the measurement station is installed. Fig. 5 shows a sample fuzzy thermal rating for hour 10 with the time interval of 30 min. It shows that the possible thermal rating of the line lies between 1025 to 1460 A, which is greater than the static rating. The flat top of the membership function is due to using rectangular membership function for . Interpretation of this fuzzy number is up to the operators. They can use 1025 A as the line’s rating in the most conservative manner, or use the defuzzified number. Meanwhile, they might use this fuzzy number for the fuzzy load dispatch, which is described in [29]. For the sake of comparison between the crisp and fuzzy-based assessments, the fuzzy results should be defuzzified. Figs. 6–8 illustrate three ratings for the line (i.e., real-time DTR, crisp DTR, and fuzzy DTR. The real-time DTR is a hypothetical value calculated based on measurements captured in real time). The crisp and fuzzy DTRs are computed based on the crisp and fuzzy calculations. Remind that static rating of the line is equal to 945 A. As shown in the figures, in this case, the dynamic rating of the line is always greater than its static rating. In some periods of the time, the DTR is nearly twice the static rating. Obviously, utilizing DTR capabilities would be very necessary for relieving the transmission system congestion. The revenue
SHAKER et al.: FUZZY DYNAMIC THERMAL RATING OF TRANSMISSION LINES
1891
TABLE I ABSOLUTE PERCENTAGE CHANGE IN THE CRISP DTR
TABLE II ABSOLUTE PERCENTAGE CHANGE IN THE FUZZY DTR Fig. 6. Line DTRs assuming 30-min time intervals.
Fig. 7. Line DTRs assuming 1-h time intervals.
more far from the real-time DTRs. However, the distance in the crisp analysis is approximately twice that of the fuzzy modeling and this situation might be harmful for the transmission conductors. This situation is demonstrated in Fig. 8, which has 1.5-h time interval. This shortcoming forces the operator to shorten the sampling duration. However, since the fuzzy method incorporates uncertainties and its obtained results are more robust, having even long time intervals does not cause a serious concern. B. Robustness of the Models
Fig. 8. Line DTRs assuming 1.5-h time intervals.
obtained by the promotion of market efficiency justifies the return of investment. As demonstrated in the figures, the fuzzy model considers the changes of parameters during each period and leads to a value close to the average in the corresponding time period. When the real-time DTR is increasing, the fuzzy DTR is greater than the crisp one and by the contrast whenever the real-time DTR is decreasing, the fuzzy DTR is less than the crisp result. In crisp DTR, it is, however, shown that in some moments (i.e., first and last time intervals of all three cases), the estimated DTR is too high. This situation could be threatening for the line’s safe operation. Furthermore, in some other cases, such as intervals 18 and 17:30 in Figs. 7 and 8, respectively, the estimated crisp DTR is too low, which causes underestimating of the actual rating and losing some revenue in congestion circumstances. Accordingly, it is evident that the fuzzy model outperforms the crisp analysis since it accounts for all changes of the line rating in each period. Referring to Figs. 6–8, one can deduce that longer periods of evaluation would result in fuzzy and crisp DTR estimations
In order to further assess the robustness of the fuzzy DTR model, we consider four case studies. In Cases 1 to 3, it is assumed that the measurement error of the air temperature, the wind speed, or the wind direction is 10 times of that in the base case, respectively. That is, the sensitivity of the solution in terms of just one parameter is of interest. In Case 4, the measurement errors associated with all of these three variables are supposed to be 10 times of those in the base case. The crisp and fuzzy DTRs associated with the aforementioned case studies are calculated and the percentage changes are outlined in Tables I and II. The results obtained cannot only reveal the most influencing parameter but also make the comparison of the crisp and fuzzy models’ robustness possible. Referring to both Tables I and II, one can evidently conclude that the strongest impact on the line rating is observed in Case 2 where the wind speed is assumed to be more uncertain. A comparison of Cases 2 and 4 illustrates that in Case 4, although all three parameters are assumed to have wider fuzzy memberships, the uncertainties act in a somewhat compensating manner makes the resulting DTR less far from that of the base case. The robustness of fuzzy calculation with respect to the variations of input parameters is also well recognized through results shown in Tables I and II. The maximum value of changes with respect to the actual real-time thermal rating in the crisp DTR is about 45% while the mean value is equal to 18.1%. These measures associated with the fuzzy DTR are 2% and 0.59%, respectively. These observations indicate that the estimation made by fuzzy analysis is more reliable and closer to the actual quantities. In other words, greater measurement errors do not strongly change the fuzzy results, but cause a huge change in crisp calculations. For example, the average calculation error of case 1 is 6.7 in crisp calculation, while it is almost zero for the fuzzy method. Furthermore, the measurement devices applicable to
1892
IEEE TRANSACTIONS ON POWER DELIVERY, VOL. 27, NO. 4, OCTOBER 2012
implement a DTR plan could be cheaper with less accuracy degree. V. CONCLUSION In this paper, the DTR of the transmission line was calculated using the fuzzy method. The numerical analyses were conducted comparing the results obtained by crisp and fuzzy modeling. It was shown that the fuzzy method could effectively model the measurement inaccuracies and condition changes during the evaluation period. Incorporating these features makes the results more close to the real-time DTR. Accordingly, the proposed method was recognized to be capable of outperforming the similar crisp assessment. It was illustrated that due to more robustness of the fuzzy evaluation, the time interval between successive measurements could be rather long without sacrificing the solution acceptable accuracy. However, note that such observation is just valid when a good weather forecast is available. These adjustments would be case dependent owing to the influencing environmental factors associated with a line at hand. This paper investigated the DTR problem with a component-based viewpoint. Further studies focusing on the impacts of DTR on the power system operation, control, and planning would be very appreciable by the power engineering community. Using DTR leads to have a better estimation of the actual thermal rating of the transmission system. This feature could be implemented in power system security and reliability analysis; consequently, more realistic outcomes are expected to be achieved in the measures of these studies. The economic issues, such as cost-effective planning scenarios and return of investment, would be accordingly probed in a more precise manner. ACKNOWLEDGMENT The collaboration of the Yazd Meteorological Organization in preparation of the weather data is acknowledged. REFERENCES [1] M. Miura, T. Satoh, S. Iwamoto, and I. Kurihara, “Application of dynamic rating to increase the available transfer capability,” Elect. Eng. Jpn., vol. 166, no. 4, pp. 40–47, Mar. 2009. [2] P. M. Callahan and D. A. Douglass, “An experimental evaluation of a thermal line uprating by conductor temperature and weather monitoring,” IEEE Trans. Power Del., vol. 3, no. 4, pp. 1960–1967, Oct. 1988. [3] M. W. Davis, “A new thermal rating approach: The real-time thermal rating system for strategic overhead conductor transmission lines. Part I, general description and justification of the real-time thermal rating system,” IEEE Trans. Power App. Syst., vol. PAS-96, no. 3, pp. 803–809, May 1977. [4] M. W. Davis, “A new thermal rating approach: The real-time thermal rating system for strategic overhead conductor transmission lines. Part II, steady state thermal rating,” IEEE Trans. Power App. Syst., vol. PAS-96, no. 3, pp. 810–825, May 1977. [5] M. W. Davis, “A new thermal rating approach: The real-time thermal rating system for strategic overhead conductor transmission lines. Part III: Steady state thermal rating program continued—Solar radiation considerations,” IEEE Trans. Power App. Syst., vol. PAS-97, no. 2, pp. 444–455, Mar. 1978. [6] M. W. Davis, “A new thermal rating approach: The real-time thermal rating system for strategic overhead conductor transmission lines. Part IV: Daily comparisons of real-time and controversial thermal ratings and establishment of typical annual weather models,” IEEE Trans. Power App. Syst., vol. PAS-99, no. 6, pp. 2148–2192, Nov. 1980.
[7] K. Hur, M. Boddeti, N. D. R. Sarma, J. Dumas, J. Adams, and S. Chai, “High wire act: ERCOT balances transmission flows for Texas-size savings using its dynamic thermal ratings application,” IEEE Power Energy, vol. 8, no. 1, pp. 37–45, Jan./Feb. 2010. [8] J. F. Hall and A. K. Deb, “Prediction of overhead transmission line ampacity by stochastic and deterministic models,” IEEE Trans. Power Del., vol. 3, no. 2, pp. 789–800, Apr. 1988. [9] S. D. Foss and R. A. Maraio, “Dynamic line rating in the operating environment,” IEEE Trans. Power Del., vol. 5, no. 2, pp. 1095–1105, April 1990. [10] D. A. Douglas and A. A. Edris, “Real time monitoring and dynamic thermal rating of power transmission circuits,” IEEE Trans. Power Del., vol. 11, no. 3, pp. 1407–1418, Jul. 1996. [11] D. A. Douglass and A. A. Edris, “Field studies of dynamic thermal rating methods for overhead lines,” in Proc. IEEE T&D Conf. Rep., New Orleans, LA, Apr. 7, 1999, vol. 2, pp. 642–651. [12] R. G. Olsen and K. S. Edwards, “A new method for real-time monitoring of high-voltage transmission-line conductor sag,” IEEE Trans. Power Del., vol. 17, no. 4, pp. 1142–1152, Oct. 2002. [13] T. O. Seppa, “Increasing transmission capacity by real time monitoring,” in Proc. Power Eng. Soc. Winter Meeting, New York, Aug. 7, 2002, vol. 2, pp. 1208–1211. [14] O. A. Ciniglio and A. K. Deb, “Optimizing transmission path utilization in Idaho power,” IEEE Trans. Power Del., vol. 19, no. 2, pp. 830–834, Apr. 2004. [15] D. A. Douglass and R. Adapa, “Dynamic thermal ratings monitors and calculation methods,” in Proc. Inaugural IEEE Power Eng. Soc. Conf. Expo., Durban, South Africa, Jul. 11, 2005, pp. 163–167. [16] M. M. Saied, “Assessing the dynamic rating of overhead transmission lines,” Eur. Trans. Elect. Power, vol. 17, no. 5, pp. 526–536, Sep. 2007. [17] A. Piccolo, A. Vaccaro, and D. Villacci, “Thermal rating assessment of overhead lines by Affine arithmetic,” Elect. Power Syst. Res., vol. 71, pp. 275–283, Jan. 2004. [18] J. Hosek, P. Musilek, E. Lozowski, and P. Pytlak, “Effect of time resolution of meteorological inputs on dynamic thermal rating calculations,” IET Gen. Transm. Dis., vol. 5, no. 9, pp. 941–947, Sep. 2011. [19] A. K. Deb, Power Line Ampacity System—Theory, Modeling, and Applications. Boca Raton, FL: CRC, 2000. [20] K. R. W. Bell, A. R. Daniels, and R. W. Dunn, “Alleviation of transmission system overloads using fuzzy reasoning,” Fuzzy Sets Syst., vol. 102, no. 1, pp. 41–52, 1999. [21] IEEE Standard for Calculating the Current-Temperature Relationship of Bare Overhead Conductors, IEEE Standard 738-2006, Jan. 2007. [22] G. J. Klir and B. Yuan, Fuzzy Sets and Fuzzy Logic Theory and Applications. Upper Saddle River, NJ: Prentice Hall, 1995. [23] A. Kaufmann and M. M. Gupta, Introduction to Fuzzy Arithmetic Theory and Application. New York: Van Nostrand Reinhold, 1991. [24] M. Hanss, Applied Fuzzy Arithmetic (An Introduction With Engineering Applications). Berlin, Germany: Springer-Verlag, 2005. [25] S. Abbasbandy and T. Hajjari, “A new approach for ranking of trapezoidal fuzzy numbers,” Comput. Math. Appl., vol. 57, no. 3, pp. 413–419, Feb. 2009. [26] C.-H. Cheng, “A new approach for ranking fuzzy numbers by distance method,” Fuzzy Sets Syst., vol. 95, no. 3, pp. 307–317, May 1998. [27] M. Ma, A. Kandel, and M. Friedman, “A new approach for defuzzification,” Fuzzy Sets Syst., vol. 111, no. 3, pp. 351–356, May 2000. [28] M. Jimenez, M. Arenas, A. Bilbao, and M. V. Rodriguez, “Linear programming with fuzzy parameters: An interactive method resolution,” Eur. J. Oper. Res., vol. 177, no. 3, pp. 1599–1609, Mar. 2007. [29] A. Ebrahimi, M. Ehsan, and V. Tahami, “Multicriteria load dispatch with fuzzy constraints,” J. Intell. Fuzzy Syst., vol. 2, no. 4, pp. 315–323, 1994. Hamid Shaker (S’12) received the B.Sc. degree in electrical engineering from Isfahan University of Technology, Isfahan, Iran, in 2007, the M.Sc. degree in electrical engineering from Sharif University of Technology, Tehran, Iran, in 2009, and is currently pursuing the M.Sc. degree at the University of Calgary, Calgary, AB, Canada. His research interests include fuzzy-based modeling and dynamic transmission rating as well as wind power modeling. Mahmud Fotuhi-Firuzabad (SM’99) is a Professor and Head of the Electrical Engineering Department, Sharif University of Technology, Tehran, Iran. He is also an Honorary Professor in the Universiti Teknologi Mara (UiTM), Shah Alam, Malaysia. Farrokh Aminifar (M’11) is a Postdoctoral Fellow with the Electrical Engineering Department, Sharif University of Technology, Tehran, Iran.