MATEC Web of Conferences 200, 00012 (2018) IWTSCE’18
https://doi.org/10.1051/matecconf/201820000012
FUZZY PERFORMANCE MEASUREMENT SYSTEM FOR THE MAINTENANCE FUNCTION NAJI Mehdi Amine1, a, MOUSRIJ Ahmed1 1
Industrial Management and Innovation Laboratory; Faculty of Science and Technology, Hassan 1st Settat University, Morocco
Abstract. Maintenance aims to sustain the manufacturing process by ensuring that the production tools are well managed. However, modern production means are more automated and therefore more complex, so they require a performing maintenance for which planning and implementation are increasingly difficult. This paper, therefore, emphasizes the elaboration of a maintenance performance measurement system. Therefore, for an appropriate and reliable performance evaluation, we adopt a multi-level multi-criteria approach where every criterion influencing the maintenance performance either indirectly or directly are specified. Thereafter, indicators for the specified criteria would be measured using fuzzy logic to overcome limitations due to lack of available resources and data. For a global maintenance measurement, the elementary measurements will be aggregated into a total measurement through a multiple-criteria decision-making method such as MACBETH.
1 Introduction To remain in a competitive position, the manufacturing systems must be more productive, effective and economical [1]. However, the complexity of these manufacturing systems, the large diversity of manufactured products and the uncertainty of the production environment are behind critical dysfunctions. These malfunctions and failures negatively affect production capacity, production quality and cost, as well as potential health and safety risks and accidents to personnel, plants and the environment [2]. This is the reason behind maintenance, which is no more restricted to repair facilities, but rather involves preventing their dysfunction [3-4]. Consequently, maintenance is now a vital element in the global business success for any manufacturing company [5]. Therefore, a performing maintenance became a necessity and not a possibility. Achieving the required performance begins with its measurement as without it there are practically any indications of improvement [6]. A performance measurement system is a management tool that allows a company to evaluate how its activities are effective and efficient [7]. This tool is structured in a multi-criteria approach, including a combination of performance indicators selected according to the company's objectives [8]. The main challenge when measuring maintenance performance is defining and choosing indicators that reflect the corporate strategy and provide quantitative feedback on the maintenance strategies performance [9]. Indeed, a suitable indicator would track and control performance, assist identifying performance gaps, and continuous improvement [5]. Therefore, to make this a
system more useful, there is an obligation in defining the indicators to be measured, the way in which they should be evaluated and who is responsible for their implementation [10]. However, in an environment characterized by cost, time, resources and skill limitations, measuring the elementary performance is a big issue. For this reason, we propose that the fuzzy logic is used to quantify this elementary performance. Subsequently, by using the multi-criteria decision-making method MACBETH, the elementary performance measurements are aggregated into an overall measure that provides the total maintenance performance. Consequently, the suggested approach allows measuring the global performance and the local performances of the maintenance, as well as defining the necessary actions for a continuous maintenance performance enhancement.
2 Methodology 2.1. The identification of the elementary maintenance performance measurement indicators In order, to measure maintenance performance correctly, the strategic aspects are specified and aligned with the company's strategy. These strategic aspects are the financial aspect, the technical aspect, the internal process aspect, the support aspect, the human resources aspect and the health, safety and environment (HSE) aspect. Afterwards, they will be disaggregated until reaching elementary indivisible sub-criteria. This paper will focus
NAJI Mehdi Amine:
[email protected]
© The Authors, published by EDP Sciences. This is an open access article distributed under the terms of the Creative Commons Attribution License 4.0 (http://creativecommons.org/licenses/by/4.0/).
MATEC Web of Conferences 200, 00012 (2018) IWTSCE’18
https://doi.org/10.1051/matecconf/201820000012
Table 1 Satisfaction degrees
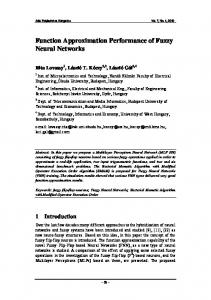
on financial performance measurement, which is presented in Figure 1. A similar methodology is used when assessing the other dimensions of the maintenance performance. CD1
Financial
F1
CD2 G M G G
CD3 G G G G
CI1 P M M M
CI2 P M P M
CIS1 P P M P
CIS2 VP VP P P
CIS3 P VP P P
CIS4 P P M M
F3 G M M G
F4 G G M G
CD2
After that, every linguistic term is assigned to the appropriate fuzzy number. In this study, the triangular fuzzy numbers are chosen for their simplicity [13-14-15]. p̃K is the triangular fuzzy number of a specific criterion Ci. p̃K = (LK , MK , R K ) with K = VP, P, M, G, VG and E where L and R are two points on the left and right of the triangular fuzzy number representing the interval [LK, RK]. Mk is the most possible value. The result is in the table 2.
CD3 CI1
F2
CI2
F3
CI3
F4
CD1 VG G G VG
K1 K2 K3 K4
CIS1 CIS2 CIS3 CIS4
Figure 1 Financial maintenance performance indicators. With F1 direct cost, F2 indirect Cost, F3 maintenance intensity and F4 capital replacement value. CD1 Internal labor cost, CD2 Subcontract cost, CD3 Maintenance material purchasing cost (spare part + consumable). CI1 training and learning costs, CI2 HSE related cost and CI3 unavailability cost. CIS1 palliative cost, CIS2 contractual penalty, CIS3 production losses, CIS4: Intermediate inventory cost.
Table 2 Triangular fuzzy number TFN Performance Satisfaction Degree Very poor VP Poor P Medium M Good G Very Good VG Excellent E
2.2. The elementary Performance Measurement using the Fuzzy Logic:
Triangular Fuzzy number (0, 0.35, 0.45) (0.35, 0.45, 0.5) (0.45, 0.6, 0.65) (0.6, 0.75, 0.8) (0.75, 0.85, 0.92) (0.9, 1, 1)
Then, each linguistic parameter is assigned with the corresponding triangular fuzzy number. The result is shown in Tables 3 and 4.
The fuzzy logic has been inserted by Zadeh (1965) [11], in order to overcome the complexity and fuzziness of the real systems, by representing them through linguistic values that will follow a mathematical treatment transformed into numerical ones [12].
2.2.2.Aggregation of the fuzzy numbers In order to get a consensus among the various evaluators, K K K K the satisfaction degrees P̃ i = (Li , Mi , R i ) K= 1,…..,n expressed by each evaluator on the evaluation criterion Ci should be aggregated into a unique TFN ̃ Pi = (Li , Mi , R i ) using equation (1) [16]:
2.2.1.Linguistic terms and triangular fuzzy number identification First, to measure elementary performance, it is necessary to construct the appropriate rating scale. This performance is from 0 to 1. The 0 is a complete dissatisfaction of the target, and the 1 is a complete satisfaction of the target. Then the interval [0, 1] will be subdivided into six subintervals. The interval [0, 0.45] denotes a very poor satisfaction (VP), [0.35, 0.5] denotes a poor satisfaction (P), [0.45, 0.65] a medium satisfaction M, [0.6, 0.8] a good satisfaction (G), [0.75, 0.92] a very good satisfaction (VG) and [0.9, 1] indicates an excellent satisfaction (E). Then for each criterion C i represented in Figure 1, decision-makers will linguistically express their satisfaction degrees regarding to the objective O i using a specific term. The result is reported in Table 1.
Li = min(LKi ) K
n
1 Mi = ∑ MiK k
(1)
k=1
(RKi ) {R i = max K
By using equation (1), the various fuzzy numbers expressed by the decision-makers will be aggregated into a single fuzzy number reflecting the satisfaction degree associated to each elementary sub criterion Cij. The result is shown in Tables 5 and 6.
Table 3 the associated triangular fuzzy numbers
K1 K2 K3 K4
CD1 (0.75, 0.85, 0.92) (0.6, 0.75, 0.8) (0.6, 0.75, 0.8) (0.75, 0.85, 0.92)
CD2 (0.6, 0.75, 0.8) (045, 0.6, 0.65) (0.6, 0.75, 0.8) (0.6, 0.75, 0.8)
CD3 (0.6, 0.75, 0.8) (0.6, 0.75, 0.8) (0.6, 0.75, 0.8) (0.6, 0.75, 0.8)
CI1 (0.35, 0.45, 0.5) (045, 0.6, 0.65) (045, 0.6, 0.65) (045, 0.6, 0.65)
CI2 (0.35, 0.45, 0.5) (045, 0.6, 0.65) (0.35, 0.45, 0.5) (045, 0.6, 0.65)
Table 4 the associated triangular fuzzy numbers
K1 K2 K3 K4
CIS1 (0.35, 0.45, 0.5) (0.35, 0.45, 0.5) (045, 0.6, 0.65) (0.35, 0.45, 0.5)
CIS2 (0, 0.35, 0.4) (0, 0.35, 0.4) (0.35, 0.45, 0.5) (0.35, 0.45, 0.5)
CIS3 (0.35, 0.45, 0.5) (0, 0.35, 0.4) (0.35, 0.45, 0.5) (0.35, 0.45, 0.5)
2
CIS4 (0.35, 0.45, 0.5) (0.35, 0.45, 0.5) (045, 0.6, 0.65) (045, 0.6, 0.65)
F3 (0.6, 0.75, 0.8) (045, 0.6, 0.65) (045, 0.6, 0.65) (0.6, 0.75, 0.8)
F4 (0.6, 0.75, 0.8) (0.6, 0.75, 0.8) (045, 0.6, 0.65) (0.6, 0.75, 0.8)
MATEC Web of Conferences 200, 00012 (2018) IWTSCE’18
https://doi.org/10.1051/matecconf/201820000012
Table 5 Aggregation of TFNs CIS1 (0.35, 0.48, 0.65)
CIS2 (0,0.37, 0,5)
CIS3 (0,0.41, 0,5)
CIS4 (0.35, 0.52, 0.65)
F3 (0.45, 0.68, 0.8)
F4 (0.45, 0.71, 0.8)
Table 6 Aggregation of TFNs CD1 (0.6, 0.8, 0.92)
CD2 (0.45, 0.71, 0.8)
CD3 (0.6, 0.75, 0.8)
̅ related to each evaluation ̃ In order to convert the TFN 𝑃 𝑖 ̅ ̃𝑖 will be deffuzzify by criterion Ci into crisp value. The 𝑃 the CFCS method (Converting the Fuzzy data into Crisp Scores) proposed by Opricovic [17]. In the presented study, the fuzzy logic is utilized for quantifying the elementary maintenance performance ̌𝑖 = (𝐿𝑖 , 𝑀𝑖 , 𝑅𝑖 ) is the related to the criterion Ci. So 𝑃 membership function of the elementary performance for the criterion Ci. Then: The normalization of the TFN:
1,00 0,78
0,80 0,60
𝑥𝑙 = 𝑥𝑚 =
Mi −𝑙𝑖𝑚𝑖𝑛 ∆𝑚𝑎𝑥 𝑚𝑖𝑛
𝑥𝑟 =
=
𝑥 𝑟𝑠 =
xr 1+xr − xm
=
F4
2.3. The overall maintenance performance measurement The evaluation criteria and aspects have a different effect on the performance. As a result, to identify the relative importance of each evaluation criterion and aspect, a multi-criteria decision-making MCDA method such as MACBETH is needed. Indeed, this method allows quantifying the relative weight of each criterion by using the comparative attractiveness of each criterion as expressed linguistically by the decision-makers [18]. To do this, the decision-makers will express the attractiveness relating to the evaluation criteria of the same hierarchical level. By using the MACBETH method and the M-MACBETH software, each criterion and subcriterion will be weighted. The weights Wi of F1, F2, F3, and F4 are shown in Figure 3.
=0
R i − 𝑙𝑖𝑚𝑖𝑛 =1 ∆𝑚𝑎𝑥 𝑚𝑖𝑛
=
CI2 CIS1 CIS2 CIS3 CIS4 F3
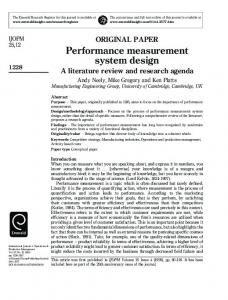
Figure 2 Financial elementary performances
Ri −Li
xm
0,51 0,32 0,35
CD1 CD2 CD3 CI1
Mi −Li
1+xm − xl
0,65 0,68 0,54 0,51 0,49
0,00
The Left and Right normalized value 𝑥 𝑙𝑠 and 𝑥 𝑟𝑠 : 𝑥 𝑙𝑠 =
0,73
0,20
∆𝑚𝑎𝑥 𝑚𝑖𝑛 = R i − Li Li − 𝑙𝑖𝑚𝑖𝑛 ∆𝑚𝑎𝑥 𝑚𝑖𝑛
0,68
0,40
𝑙𝑖𝑚𝑖𝑛 = Li
,
CI2 (0.35, 0.52, 0.65)
However, the elementary performance measurements are not suitable to provide a holistic maintenance performance assessment. Because of this, they must be aggregated to form a unified measure.
2.2.3.Defuzzification
𝑟𝑖𝑚𝑎𝑥 = R i
CI1 (0.35, 0.56, 0.65)
Mi −Li ri −2Li +Mi Ri −Li
2Ri −Li −Mi
The total normalized crisp value: 𝑥 𝑐𝑟𝑖𝑠𝑝 = [𝑥 𝑙𝑠 (1 − 𝑥 𝑙𝑠 ) + 𝑥 𝑟𝑠 𝑥 𝑟𝑠 ]/[1 − 𝑥 𝑙𝑠 + 𝑥 𝑟𝑠 ]
Finally, the crisp values Pi, which refer to the elementary performance of the criterion Ci: Pi = Li + 𝑥 𝑐𝑟𝑖𝑠𝑝 (Li − R i )
(2)
By using this defuzzification method, the aggregated fuzzy numbers will be converted into a performance expression. Therefore, we will get the elementary performance Pi for each Ci criterion. The result is displayed in figure 2. According to Figure 2, the best performances are P CD1 = 0.78 and PDC3 = 0.73. On the other hand, the poor performances are PCIS3 = 0.35 and PCIS2 = 0.32.
Figure 3 Financial criteria weighing using M-MACBETH.
After that, the overall maintenance performance is calculated through the aggregation of the elementary performance using the weighted arithmetic mean as in equation (3). 𝑛
𝑃𝑎𝑔 = 𝐴𝑔(𝑃1 , … , 𝑃𝑛 ) = ∑ 𝑊𝑖 𝑃𝑖 𝑖=1
3
(3)
MATEC Web of Conferences 200, 00012 (2018) IWTSCE’18
https://doi.org/10.1051/matecconf/201820000012
4. The result is displayed in figure 4. CD1 W = 0,44 P= 0,78 F1 W=0,38 P = 0,73
5.
CD2 W = 0,39 P= 0,68
Financial P = 0,62
CD3 W = 0,17 P= 0,73 CI1 W= 0,13 P= 0,54 F2 W= 0,31 P= 0,46
CI2 W= 0,35 P= 0,51
F3 W= 0,19 P= 0,65
CI3 W= 0,52 P= 0,41
F4 W=0,12 P= 0,68
6. CIS1 W= 0,38 P= 0,49 CIS2 W= 0,31 P= 0,32
7.
CIS3 W= 0,23 P= 0,35 CIS4 W=0,08 P= 0,51
8.
Figure 4 Aggregation of the elementary performances
9.
As a result, the overall maintenance financial performance is 0.62. In other words, the company has achieved 62% of its maintenance financial target. In addition, the weighting of the criteria by MACBETH allows to precisely identify the most critical improvement areas, in this study the performance of the direct cost and that of the indirect cost are the most critical. Therefore, these two criteria must be prioritized for further improvement.
10.
11. 12.
4 Conclusion 13.
The performance measurement system of the maintenance function introduced in this paper is elaborated through three sections. Since the first part defines and prioritizes the performance measurement indicators that are the most appropriate. The second section, by using the fuzzy logic the elementary performances are quantified trough a qualitative evaluation. Subsequently, in the third section, these elementary measures are aggregated to an overall maintenance performance measure. All of this will give the company a synthesized and further detailed visibility on both local and global performance for an optimal maintenance improvement.
14.
15.
16.
References 1.
2.
3.
C. Wang, S. Hwang, A stochastic maintenance management model with recovery factor. Journal of Quality in Maintenance Engineering, 10, 2: 154-65 (2004). A. Parida, U. Kumar, D. Galar, C. Stenström. Performance measurement and management for maintenance: a literature review. Journal of Quality in Maintenance Engineering, 21, 1: 2-33 (2015). A. Tsang. A strategic approach to managing maintenance performance. Journal of Quality in Maintenance Engineering, 4, 2: 87-94 (1998).
17.
18.
4
U. Kumar, D. Gal, A. Parida, C. Stenström, L. Berges, Maintenance performance metrics: a state-of-the-art review. Journal of Quality in Maintenance Engineering, 19, 3: 233-277 (2013). P. Muchiri, L. Pintelon, L. Gelders, H. Martin. Development of maintenance function performance measurement framework and indicators. International Journal of Production Economics, 13, 1: 295–302 (2011). A. Parida, T. Åhrén, and U. Kumar, U. Integrating maintenance performance with corporate balanced scorecard. Proceedings of COMADEM 2003: 53-59 (2003). A. Neely, M. Gregory, K. Platts. Performance measurement system design: a literature review and research agenda. International journal of operations & production management, 15, 4: 80-116, (2005). L. Berrah, G. Mauris, A. Haurat, L. Foulloy. Global vision and performance indicators for an industrial improvement approach. Computers in Industry, 43, 3: 211-225, (2000). C. Stenström, A. Parida, D. Galar. Performance indicators of railway infrastructure. The international Journal of railway technology, 1, 3: 1-18 (2012). K.Y, Kutucuoglo. J, Hamali. Z, Irani, J. M, Sharp. A framework for managing maintenance using performance measurement systems, International Journal of Operation and Production Management, 21, 1: 173-194 (2001). L. A, Zadeh. Information and control. Fuzzy sets, 8, 3: 338-353 (1965). B. Al-Najjar, I. Alsyouf. Selecting the most efficient maintenance approach using fuzzy multiple criteria decision-making. International journal of production economics, 84, 1: 85-100 (2003). M. Grabisch. The application of fuzzy integrals in multicriteria decision-making. European journal of operational research. 89, 3: 445-456 (1996). M. L. Tseng, J. H. Chiang, L. W. Lan. Selection of optimal supplier in supply chain management strategy with analytic network process and choquet integral. Computers & Industrial Engineering, 57, 1: 330-340 (2009). N. Yalcin, A. Bayrakdaroglu, C. Kahraman. Application of fuzzy multi-criteria decision-making methods for financial performance evaluation of Turkish manufacturing industries. Expert Systems with Applications. 39, 1: 350-364, (2012). A. Shemshadi, H. Shirazi, M. Toreihi, and M.J Tarokh. A fuzzy VIKOR method for supplier selection based on entropy measure for objective weighting. Expert Systems with Applications. 38, 10: 12160-12167 (2011). S. Opricovic, G.H. Defuzzification within a multicriteria decision model. International Journal of Uncertainty, Fuzziness and Knowledge-Based Systems, 11, 5: 635-652 (2003). C.A. Bana e Costa, J.C. Vansnick. Applications of the MACBETH approach in the framework of an additive aggregation model. Journal of Multi‐Criteria Decision Analysis, 6, 2: pp. 107-114 (1997).