As this sparsity is based on the KL-minimisation, it is probabilistic and ..... When new data is added to the training set we can not use the result we had from the inference ... Using previous results is only possible for regression [Williams ..... the likelihood model we are using, thus the particular likelihood will be left unspecified ...
Gaussian Processes - Iterative Sparse Approximations
´ Lehel Csato Doctor of Philosophy
ASTON UNIVERSITY March 2002 This copy of the thesis has been supplied on condition that anyone who consults it is understood to recognise that its copyright rests with its author and that no quotation from the thesis and no information derived from it may be published without proper acknowledgement.
ASTON UNIVERSITY
Gaussian Processes - Iterative Sparse Approximations
´ Lehel Csato Doctor of Philosophy, 2002 Thesis Summary In recent years there has been an increased interest in applying non-parametric methods to real-world problems. Significant research has been devoted to Gaussian processes (GPs) due to their increased flexibility when compared with parametric models. These methods use Bayesian learning, which generally leads to analytically intractable posteriors. This thesis proposes a two-step solution to construct a probabilistic approximation to the posterior. In the first step we adapt the Bayesian online learning to GPs: the final approximation to the posterior is the result of propagating the first and second moments of intermediate posteriors obtained by combining a new example with the previous approximation. The propagation of functional forms is solved by showing the existence of a parametrisation to posterior moments that uses combinations of the kernel function at the training points, transforming the Bayesian online learning of functions into a parametric formulation. The drawback is the prohibitive quadratic scaling of the number of parameters with the size of the data, making the method inapplicable to large datasets. The second step solves the problem of the exploding parameter size and makes GPs applicable to arbitrarily large datasets. The approximation is based on a measure of distance between two GPs, the KL-divergence between GPs. This second approximation is with a constrained GP in which only a small subset of the whole training dataset is used to represent the GP. This subset is called the Basis Vector, or BV set and the resulting GP is a sparse approximation to the true posterior.
As this sparsity is based on the KL-minimisation, it is probabilistic and independent of the way
the posterior approximation from the first step is obtained. We combine the sparse approximation with an extension to the Bayesian online algorithm that allows multiple iterations for each input and thus approximating a batch solution. The resulting sparse learning algorithm is a generic one: for different problems we only change the likelihood. The algorithm is applied to a variety of problems and we examine its performance both on more classical regression and classification tasks and to the data-assimilation and a simple density estimation problems.
Keywords: Gaussian processes, online learning, sparse approximations
2
Sz¨ uleimnek.
3
Acknowledgements
First and foremost I am grateful to my supervisor Manfred Opper for his unceasing enthusiasm, the sparkling discussions, the quick understanding of sometimes chaotic ideas, and the thorough explanations he gave me whenever I needed it. Being a member of NCRG was very stimulating and I profited a lot from the discussions during the three years spent at Aston. I acknowledge the financial support of NCRG for making possible my study. My fellow PhD students helped me adjust to life in England, in particular to the, put it mildly, unfavourable local climate. The lively discussions in the PhD lab are not forgotten. I thank my fellow course-mates, Mehdi Azzouzi, David Evans, Randa Herzallah, Lars Hjorth, Ragnar Lesch, Tony Schwaighofer, Renato Vicente, Wei Lee Woon and Sun Yi. For the remote support I thank to my family and to my friends without whom the completion of this thesis would have been much harder. In preparing this thesis I have been helped a lot by Dan Cornford and Wei Lee Woon who gave helpful comments on the grammatical aspects of the thesis. And finally, special thanks to Vicky Bond for her prompt replies whenever it was needed.
4
Contents
1 Introduction
9
1.1
Bayesian learning . . . . . . . . . . . . . . . . . . . . . . . . . . . . . . . . . . . . . . .
10
1.2
Gaussian Processes . . . . . . . . . . . . . . . . . . . . . . . . . . . . . . . . . . . . . .
11
1.3
Feature spaces . . . . . . . . . . . . . . . . . . . . . . . . . . . . . . . . . . . . . . . .
13
1.4
Sparsity . . . . . . . . . . . . . . . . . . . . . . . . . . . . . . . . . . . . . . . . . . . .
14
1.5
Structure of the thesis . . . . . . . . . . . . . . . . . . . . . . . . . . . . . . . . . . . .
14
1.6
Notations . . . . . . . . . . . . . . . . . . . . . . . . . . . . . . . . . . . . . . . . . . .
15
2 Gaussian Process Representation and Online Learning
17
2.1
Generalised linear models . . . . . . . . . . . . . . . . . . . . . . . . . . . . . . . . . .
18
2.2
Bayesian Learning for Gaussian Processes . . . . . . . . . . . . . . . . . . . . . . . . .
20
2.2.1
Exact results for regression . . . . . . . . . . . . . . . . . . . . . . . . . . . . .
21
2.2.2
Approximations for general models . . . . . . . . . . . . . . . . . . . . . . . . .
22
2.3
Parametrisation of the posterior moments . . . . . . . . . . . . . . . . . . . . . . . . .
25
2.3.1
Parametrisation in the feature space . . . . . . . . . . . . . . . . . . . . . . . .
28
2.4
Online learning for Gaussian processes . . . . . . . . . . . . . . . . . . . . . . . . . . .
30
2.5
The online learning algorithm . . . . . . . . . . . . . . . . . . . . . . . . . . . . . . . .
33
2.6
Discussion . . . . . . . . . . . . . . . . . . . . . . . . . . . . . . . . . . . . . . . . . . .
34
3 Sparsity in Gaussian Processes
35
3.1
Redundancy in the representation . . . . . . . . . . . . . . . . . . . . . . . . . . . . . .
36
3.2
Computing the KL-distances . . . . . . . . . . . . . . . . . . . . . . . . . . . . . . . .
39
3.3
KL-optimal projection . . . . . . . . . . . . . . . . . . . . . . . . . . . . . . . . . . . .
42
3.4
Measuring the error . . . . . . . . . . . . . . . . . . . . . . . . . . . . . . . . . . . . .
44
3.5
Sparse online updates . . . . . . . . . . . . . . . . . . . . . . . . . . . . . . . . . . . .
46
3.6
A sparse GP algorithm . . . . . . . . . . . . . . . . . . . . . . . . . . . . . . . . . . . .
47
Using a predefined BV set . . . . . . . . . . . . . . . . . . . . . . . . . . . . . .
48
3.6.1 3.7
3.8
Comparison with other sparse kernel techniques . . . . . . . . . . . . . . . . . . . . . .
49
3.7.1
Dimensionality reduction using eigen-decompositions . . . . . . . . . . . . . . .
50
3.7.2
Subspace methods . . . . . . . . . . . . . . . . . . . . . . . . . . . . . . . . . .
53
3.7.3
Pursuit algorithms . . . . . . . . . . . . . . . . . . . . . . . . . . . . . . . . . .
53
Discussion . . . . . . . . . . . . . . . . . . . . . . . . . . . . . . . . . . . . . . . . . . .
55
3.8.1
56
Further research directions . . . . . . . . . . . . . . . . . . . . . . . . . . . . .
5
Contents 4 Sparsity and the Expectation-Propagation Algorithm
57
4.1
Expectation-Propagation . . . . . . . . . . . . . . . . . . . . . . . . . . . . . . . . . . .
58
4.2
EP for Gaussian Processes . . . . . . . . . . . . . . . . . . . . . . . . . . . . . . . . . .
60
4.3
Relation between GP parametrisations . . . . . . . . . . . . . . . . . . . . . . . . . . .
63
4.4
Sparsity and Expectation Propagation . . . . . . . . . . . . . . . . . . . . . . . . . . .
64
4.5
Comparisons for regression . . . . . . . . . . . . . . . . . . . . . . . . . . . . . . . . .
67
4.6
The proposed algorithm . . . . . . . . . . . . . . . . . . . . . . . . . . . . . . . . . . .
68
4.7
Discussion and Further Research . . . . . . . . . . . . . . . . . . . . . . . . . . . . . .
69
5 Applications
70
5.1
Regression . . . . . . . . . . . . . . . . . . . . . . . . . . . . . . . . . . . . . . . . . . .
71
5.2
Classification . . . . . . . . . . . . . . . . . . . . . . . . . . . . . . . . . . . . . . . . .
74
5.3
Density Estimation . . . . . . . . . . . . . . . . . . . . . . . . . . . . . . . . . . . . . .
79
5.4
Estimating wind-fields from scatterometer data . . . . . . . . . . . . . . . . . . . . . .
85
5.4.1
Processing Scatterometer Data . . . . . . . . . . . . . . . . . . . . . . . . . . .
85
5.4.2
Learning vector Gaussian processes . . . . . . . . . . . . . . . . . . . . . . . . .
87
5.4.3
Measuring the Relative Weight of the Approximation
. . . . . . . . . . . . . .
89
5.4.4
Sparsity for vectorial GPs . . . . . . . . . . . . . . . . . . . . . . . . . . . . . .
90
Summary . . . . . . . . . . . . . . . . . . . . . . . . . . . . . . . . . . . . . . . . . . .
92
5.5
6 Conclusions and Further Research 6.1
93
Further Research Directions . . . . . . . . . . . . . . . . . . . . . . . . . . . . . . . . .
95
A Matrix inversion formulae
96
B Properties of zero-mean Gaussians
97
C Iterative computation of the inverse Gram matrix
98
C.1 Computing determinants . . . . . . . . . . . . . . . . . . . . . . . . . . . . . . . . . . .
99
C.2 Updates for the Cholesky factorisation . . . . . . . . . . . . . . . . . . . . . . . . . . .
99
D KL-optimal parameter reduction
100
D.1 Computing the KL-distance . . . . . . . . . . . . . . . . . . . . . . . . . . . . . . . . . 102 −1 C−1 D.2 Updates for S t+1 = (C . . . . . . . . . . . . . . . . . . . . . . . . . . . . 103 t+1 + K t+1 )
E Diagonalisation of matrix C
105
F Updates for the wind fields
107
G The Sparse EP algorithm
109
6
List of Figures
2.1
GP regression with RBF and polynomial kernels . . . . . . . . . . . . . . . . . . . . .
21
2.2
A graphical illustration of the online learning . . . . . . . . . . . . . . . . . . . . . . .
31
3.1
Projection in the feature space . . . . . . . . . . . . . . . . . . . . . . . . . . . . . . .
37
3.2
The evolution of the KL-divergences for the online training . . . . . . . . . . . . . . .
41
3.3
Parameter decomposition . . . . . . . . . . . . . . . . . . . . . . . . . . . . . . . . . .
43
3.4
Errors made by ignoring the covariance-term in the score . . . . . . . . . . . . . . . .
46
4.1
A graphical illustration of the expectation propagation algorithm . . . . . . . . . . . .
60
5.1
Regression results for the sinc function. . . . . . . . . . . . . . . . . . . . . . . . . . .
71
5.2
Regression results for the Friedman dataset. . . . . . . . . . . . . . . . . . . . . . . . .
73
5.3
Regression results for the Boston dataset. . . . . . . . . . . . . . . . . . . . . . . . . .
74
5.4
Sparse EP applied to Crab data. . . . . . . . . . . . . . . . . . . . . . . . . . . . . . .
75
5.5
Sparse EP applied to Sonar data. . . . . . . . . . . . . . . . . . . . . . . . . . . . . . .
76
5.6
Results for the USPS dataset for binary and combined classification. . . . . . . . . . .
77
5.7
Multiclass classification with rejecting the uncertain predictions. . . . . . . . . . . . .
78
5.8
The kernel used for density estimation. . . . . . . . . . . . . . . . . . . . . . . . . . . .
83
5.9
Results for the GP density estimation. . . . . . . . . . . . . . . . . . . . . . . . . . . .
84
5.10 The local “likelihoods” in the wind field model. . . . . . . . . . . . . . . . . . . . . . .
86
5.11 Updates for the vectorial GP . . . . . . . . . . . . . . . . . . . . . . . . . . . . . . . .
87
5.12 NWP wind-field prediction and sparse GP predictions. . . . . . . . . . . . . . . . . . .
88
5.13 Computing the relative weight of a GP approximation . . . . . . . . . . . . . . . . . .
89
5.14 The predicted wind-fields based on the sparse GP. . . . . . . . . . . . . . . . . . . . .
91
D.1
. . . . . . . . . . . . . . . . . . . . . . . . . . . . . . . . . . . . . . . . . . . . . . . . . 101
7
Declaration
This thesis describes the work carried out between October 1998 and March 2002 in the Neural Computing Research Group at Aston University under the supervision of Dr. Manfred Opper. This thesis has been composed by myself and has not, nor any similar dissertation, submitted in any previous application for a degree.
8
Chapter 1 Introduction
Advances in computing capabilities have allowed increasingly complex learning procedures to be implemented in practical scenarios. In recent years there has been a growing interest in more powerful but demanding methods such as sampling techniques, non-parametric algorithms, boosting, or nearestneighbour techniques. These methods are able to learn non-linear, i.e. more complex relationships in the data. Their limiting factor is the computational time: sampling techniques like Monte Carlo methods or particle filtering are costly since they require an extensive search in the parameter space when making predictions, leading to very long convergence times when applied for high-dimensional data sets. Non-parametric methods, like various kernelised algorithms, provide the solutions as function of all training data, in this case the required memory scales with the size of the data set, implying both a prolonged computation and large storage requirement. The ongoing interest in their application is justified by the good performance of the non-parametric methods for real tasks, see e.g. [Smola and Sch¨olkopf 2002], this performance usually being better then that of the semi-parametric neural networks [Haykin 1994]. However, the cost of an increased performance is the increased computational time, the basic (i.e. non-probabilistic) neural networks providing results in shorter time and without the need for an increased memory. The complexity and the computational cost of a learning algorithm is also increased if one uses Bayesian probabilistic methods. Bayesian learning is a probabilistic parameter estimation method that uses Bayes theorem both to infer the distribution of the parameters from the data and to obtain the probabilistic prediction corresponding to an example. In this thesis Bayesian learning is applied in the family of kernel methods: we study inference using Gaussian processes (GPs). GPs associate a random variable to each input location. For any finite set of inputs the associated random variables are jointly Gaussian. The GPs are thus random functions characterised by the mean and kernel functions. The kernel provides the covariance: each x, x ′ ). Using GPs requires the pair of random variables at input locations x and x ′ has covariance K0 (x manipulation of the covariance matrix for the whole training set. The scaling of the memory required for the GP is thus quadratic in the size of the training data. The main problem when using GPs in practise is, as with general kernel and non-parametric methods, the data dependent scaling of the parameter space, scaling that is quadratic in the case of Gaussian processes. This thesis addresses the problem of efficient representation of a GP. The proposed representation uses only a fraction of the training data, and the size of this subset can be fixed before learning. Fixing
9
Chapter 1. Introduction the size of this subset extends the applicability of GPs to arbitrarily large datasets. After an overview of Bayesian learning in the next section, we describe the application of this learning technique to GPs in Section 1.2. The problems faced when applying GPs to realistic data, and the solutions put forward in this thesis are also outlined.
1.1
Bayesian learning
The advantages of Bayesian methods over other methods stem from the probabilistic treatment of the problem. An immediate advantage is that we are able to estimate the uncertainty about a predicted output. To apply Bayesian learning we assume a probabilistic framework for the data: we consider the data likelihood. Let x i ∈ Rm be the inputs, y i ∈ Rd the outputs, and assume we have a set of N inputs-
x1 , y 1 ), . . . , (x xN , y N )}. The data is assumed to be conditionally independent with output pairs: D = {(x
a factorising likelihood:
θ) = P(D|θ
N Y
yi |x xi , θ ) P(y
(1.1)
i=1
where θ = [θ1 , . . . , θp ] is the set of parameters for the model. For Bayesian inference we need prior θ). Bayes’ rule is then knowledge about the parameters θ which is given via the prior distribution p0 (θ used to derive the posterior for θ : θ|D) = R ppost (θ
θ) p0 (θ θ) P(D|θ θ) p0 (θ θ) dθ P(D|θ
(1.2)
If we are looking for a single value of θ, then the most probable value, the maximum a-posteriori (MAP) estimate of the parameters is given by maximising the posterior in eq. (1.2). The priors over the parameters is the penalty term added to the cost function, the log-likelihood of the data, thus the MAP solution is equivalent to the regularisation framework for solving noisy problems [Tikhonov 1963; Poggio and Girosi 1990]. When using Bayesian methods we are not interested in a single value for the parameter θ but rather the entire probability distribution. This means that we have to evaluate the normalising integral from eq. (1.2) and represent, exactly or approximately, the whole distribution. The exact representation is feasible only for a restricted class of models like regression with Gaussian noise if we assume a Gaussian prior distribution. Generally, analytical results for the posterior exist only for likelihoods that are conjugate to the prior distribution [Bernardo and Smith 1994]. The exploitation of the full probabilities for general cases requires us either to sample from the posterior distribution, or to find appropriate approximations. Our main interest, irrespective of the model we are using, is in predicting the distribution of the output for an input x . For this we have to integrate over the posterior distribution for the parameter θ from eq. (1.2):
Z y|x x, D) = dθ θ P(y y|x x, θ ) ppost (θ θ|D). p(y
(1.3)
The presence of the normalisation integral as in eq. (1.2), means that computing the predictive distribution is also difficult and we need approximations within the Bayesian framework. The approximation considered in this thesis is Bayesian online learning [Opper 1996]. In this learning scheme the approximation to the posterior distribution is found by exploiting the factorising structure of the likelihood in eq. (1.1): the posterior is built by successive refinement steps, at each step
10
Chapter 1. Introduction including a single term from the product. These iterations still do not make the posterior tractable, but they can provide efficient approximations in a number of cases. The online approximation has a particularly appealing structure if we assume both the prior and the posterior distributions for the parameters are Gaussians [Opper 1998]: online learning retains the mean and covariance of the intractable posterior at each iteration. These statistics are computable for a variety of likelihoods. This simple structure is exploited in applying Bayesian online learning to inference using GPs.
1.2
Gaussian Processes
While Bayesian methods provide the posterior probability of the model parameters, the number of parameters and the prior for each parameter is generally fixed in advance. These characteristics cannot be changed during data processing. Consequently, we decide to use GPs which allow us to choose from a larger class of functions whilst retaining the probabilistic treatment. In Gaussian processes [Blight and Ott 1975; O’Hagan 1978; Wahba 1990; Williams and Rasmussen 1996], instead of specifying the particular parametric model, we encode all our prior belief about the parameters into a function class F and the prior probability of each function drawn from F . The
interest in GPs from the machine learning community was stimulated by the work of Neal [1997] who showed that using Gaussian prior distributions for the hidden-to-output weights of a two-layered
neural network, in the limit of infinitely many hidden neurons and a correspondingly scaled prior variances, is equivalent to a Gaussian process. The advantage of the functional specification (GPs) over the parametric one (neural networks) is that usually the function class is larger, giving us more flexibility in modelling, whilst over-fitting is avoided using the Bayesian framework. Probabilities for functions are translated to probabilities for random variables using a finite sample x1 , . . . , x N }. GPs assign to each x from the input set from the function at input positions X = {x
x1 ), . . . , f(x xN )]T is a random variable fx . The joint distribution of the random variables f X = [f(x Gaussian:
° ¯ 1 T −1 p0 (ffX ) ∝ exp − (ff − µ 0 ) K 0 (ff − µ 0 ) 2
(1.4)
xi , x j )}N x1 ), . . . , µ0 (x xN )]T with K 0 = {K0 (x ij=1 the positive definite covariance matrix and µ 0 = [µ0 (x is the mean function given a-priori. The function generating the covariance matrix is the positive definite kernel function: the matrix K 0 is a positive definite matrix for any choice of the input set X . y|x x, fx ). Bayesian To use GPs for inference, we condition the data likelihood on the GP as P(y
inference for the posterior process can be written similarly to the parametric case in eq. (1.2) from the previous section using the set of training inputs X . The predictive distribution for an unseen input
x , as in eq. (1.3) is:
Z N Y yi |x xi , fx i ) y|x x, fx , D) ∝ dffX p0 (fx , f X ) P(y y|x x, fx ) P(y p(y
(1.5)
i=1
where p0 (fx , f X ) is the joint Gaussian distribution of the random variables at the training and test locations, and marginalisation is done only with respect to f X . From the predictive distribution we see the problems we have to address when GP inference is used in practise:
11
Chapter 1. Introduction • For a data set of size N the computation of the predictive distribution requires the evaluation of an N-dimensional integral. When computing the posterior mean, we need to average N + 1 jointly Gaussian random variables. • When new data is added to the training set we can not use the result we had from the inference using the first N data points. Using previous results is only possible for regression [Williams
and Rasmussen 1996; Neal 1997], for other cases like classification or non-gaussian regression we have to re-estimate the predictive distribution when adding a new input. Both problems are a result of the non-parametric nature of GPs: the “parameters” to be learnt are the continuous mean and covariance functions which describe fx . To solve these problems, in this thesis we propose: • a general parametrisation of the posterior GP; • a Bayesian online algorithm [Opper 1998] for the GP parameters. Since we use GPs that are non-parametric, we expect that the number of our parameters will scale with the size of the data set. This scaling is obvious if we consider the MAP solution to the posterior of eq. (1.2) given by the representer theorem of Kimeldorf and Wahba [1971] (generalised by Sch¨olkopf et al. [2001]): for any log-likelihood function, the maximiser of the posterior eq. (1.2) is given in terms x, x ′ ) centred at the data points: of a linear combination of kernel functions K0 (x ^ x) = f(x
X
x, x i ) αi K0 (x
(1.6)
i
^ x) is given by the set of coefficients The importance of the representer theorem is that the solution f(x α = [αi ]T that are independent of the input x at which the value of the function is estimated. This theorem is the basis for the successful applications of the kernel methods [Smola et al. 1999; Sch¨olkopf et al. 1999] and support vector machines (SVMs) [Vapnik 1995]. From a Bayesian perspective, the drawback of the representer theorem is that it does not provide probabilistic estimates. Using the Bayesian framework, in Chapter 2 we give a parametrisation lemma that is similar to the representer theorem and provides a representation of the moments of the posterior GP. It is shown that the moments can be expressed, similarly to eq. (1.6), using combinations of the kernel function. For the first moment the parametrisation has the form given by the representer theorem, and additionally to eq. (1.6), we have the posterior kernel as: x, x ′ ) = K0 (x x, x ′ ) + Kpost (x
N X
x, x i )Cij K0 (x xj , x ′ ) K0 (x
(1.7)
ij=1
with “parameter” matrix C = {Cij } specifying the posterior kernel function. Estimation of the posterior kernel leads directly to estimating the uncertainty when making predictions. We consider approximations to the posterior process by keeping only the first two moments. Thus the representation lemma provides the parameters that represent the GP approximation to the posterior process. We can use now GPs as a latent process which will be approximated during learning. Predictions are based on the marginalisation of the approximated posterior process. If we assume factorising likelihoods, the prediction for x will only involve a single Gaussian random variable fx and combining with the likelihood function, requiring a one-dimensional integral.
12
Chapter 1. Introduction Approximating the underlying GP allows the modeller to assess the uncertainty of the predictions using Bayesian confidence intervals in the regression case, or to estimate the posterior class probabilities for classification. It also opens the possibility to treat other nonstandard data models like density modelling (Section 5.3) or inference of wind-fields [Nabney et al. 2000a; Berliner et al. 2000]) using GPs (Section 5.4). The GP approximation of the posterior process also allows the estimation of the marginal likelihood, leading to model selection. Although it is important, the model selection is not discussed in this thesis, being an area of further research.
1.3
Feature spaces
The MAP solution of eq. (1.6) provides an intuitive understanding of kernel algorithms and SVMs: to increase the degrees of freedom in these algorithms the inputs are first projected into a highdimensional feature space. A simple, usually linear, algorithm is employed therein to obtain the results. The key element of the design of such algorithms is that the results are written using only the scalar product between the feature space images of the inputs, thus the explicit projection into the feature space is never needed. The scalar products are replaced with a bivariate function, the kernel function of the GP; this way the feature space associated to a particular kernel need not even be finitedimensional (e.g. the feature space associated with an RBF kernel). This procedure of “kernelising” linear algorithms was frequently applied and the over-fitting due to the increased flexibility of the model was avoided by considering penalties on model complexity. The classical example of using kernels is for classification [Vapnik 1995]: the Support Vector Machines (SVMs). To illustrate the relation between the kernel function and the feature spaces, we use the eigenx, x ′ ) decomposition of the kernel function K0 (x x, x ′ ) = K0 (x
X
x)λi φi (x x ′) φi (x
(1.8)
i
x) are the eigenfunctions of the kernel and λi are the eigenvalues corresponding to φi (x x). The with φi (x kernel functions need to be positive definite, meaning that the summation is over a countable number of functions and λi > 0 [Mercer 1909] (or e.g. in Vapnik [1999]). Grouping the rescaled functions √ x) in a vector denoted φx leads to a space of features into which each input x is projected. We λi φi (x will use F to denote the feature space and φx will be the image of x .
x, x ′ ) becomes a scalar product in the Euclidean Using the feature space F , the kernel function K0 (x
feature space and eq. (1.8) is rewritten as:
x, x ′ ) = φxT φx ′ . K0 (x
(1.9)
With scalar products replacing the kernel functions in eq. (1.6), the MAP solution of the representer theorem is a scalar product between φx , the feature space image of the input and the MAP solution, an element of the feature space, written as in eq. (1.10). In Section 2.3.1 we show that the parametrisation lemma for GPs implies that the approximated posterior process is a normal distributions in the feature space F with mean and covariance µ =
X
(1.10)
αi φi
i
Σ = IF +
X ij
13
φi Cij φTj .
(1.11)
Chapter 1. Introduction where IF is the unit matrix, the prior distribution of the parameters in the feature space. The equivalence of the GPs with the normal distributions is explored in the thesis. Similarly to the design of kernel algorithms, we consider the fictitious feature space and the normal distribution of the parameters and express various quantities in terms of the kernel function and the parameters of the normal distribution.
1.4
Sparsity
The parametrisation lemma provides the approximated posterior process using the parameters αi and Cij , solving the problem of representing the functional entity concisely. A different issue, faced when implementing GP inference in practise, is the increasing number of parameters as the data size grows. For non-probabilistic kernel machines the scaling is linear: we need to store only αi . When computing these parameters, however, we need the whole kernel matrix and usually inversions for these matrices. This makes kernel methods computationally infeasible for large datasets: the time required to compute a general matrix inversion grows as N3 . The time requirement for GPs given by the parametrisation lemma is also cubic in the number of data points, resulting in the same limitation as the other kernel methods. The main contribution of this thesis is to provide a framework for a sparse parametrisation of GPs. The reduction of parameters is achieved by retaining only a subset of the inputs in the expressions of the posterior mean and kernel functions. This is achieved by minimising a distance between two GPs parametrised using a small number of basis vectors. Basis vectors in this thesis denote the input data that are retained in the sums of eqs. (1.6) and (1.7) after the algorithm finished. In Chapter 3 sparsity is combined with the Bayesian online learning to produce an efficient algorithm to infer the latent GP. The learning rules are such that the size of the basis vector set can be set in advance and the computing time is reduced to linear with respect to the data size: O(Np2 )
with p the cardinality of the basis vector set.
The sparse solution is similar to the result of the popular SVMs that also obtain an expansion of the result using a small set of support vectors. To get sparse solutions, in SVMs we need to solve a quadratic optimisation problem involving the whole data set, irrespective how sparse the final solutions are. In this thesis the iterative online algorithm eliminates the need to solve this demanding problem, reducing the computational requirement. The framework for sparsity does not make assumptions about the likelihood of the problem, thus the resulting algorithm is a general one, applicable for a large class of likelihoods.
1.5
Structure of the thesis
The thesis is organised as follows: Chapter 1 is this introductory chapter. Chapter 2 introduces Gaussian processes and the different approximation techniques employed for inference using GPs. The parametrisation lemma for the posterior process is provided and is applied to the Bayesian online learning of the GPs. Using the parametrisation, the equivalence of the GPs with normal distributions in the feature space is provided.
14
Chapter 1. Introduction Chapter 3 addresses the main problem faced by kernel methods: the scaling of the number of parameters with the data. The sparse Gaussian processes and the basis vectors used to represent them are introduced. The sparse approximation is combined with the online learning to yield an efficient algorithm for approximating the posterior GPs. Chapter 4 further improves on the sparse online algorithm. The online algorithm, where each input example could be processed only once, is extended to an iterative algorithm where the inputs can be processed arbitrarily many times, providing a more accurate approximation to the posterior process and at the same time retaining the sparse nature of the algorithm. Chapter 5 presents various applications of sparse GP inference. It starts with the regression case and examines the effect of sparsity on GP performance. This chapter then presents results for the classification using real data. The possibilities of applying the method to non-parametric Bayesian density estimation are studied. The final application considered in this thesis is the problem of wind-field estimation from scatterometer observations. Chapter 6 concludes this thesis by summarising the achievements and raises some important questions that need to be considered in the future. The details of calculations, to preserve the flow of the main ideas, are put in appendices.
1.6
Notations
We use bold lowercase letters for vectors and bold uppercase for matrices. Scalar quantities will be typeset in normal, such as the particular elements of a vector or matrix, thus a vector α = [α1 , α2 , . . . , αd ]T is a d-dimensional vector with corresponding components. We summarise the notation in the thesis: x – inputs from a d-dimensional space, usually Rn . y – the output corresponding to a given input x , it can be continuous or discrete. x1 , y1 ), . . . , (x xN , yN )} – the data set, P(D|θ) is the likelihood of the data given the parameters. D = {(x N – the number of examples, i.e. the size of the dataset. x, x ′ ) – the kernel function. K0 (x fx – the value of the random function at x . F – the feature space, given by the kernel. x) – the projection from the input space to the feature space. We will use φx i = φi to avoid φx = φ(x multiple indexes. iT h Φ = φ1 , . . . , φN – design matrix obtained by concatenating the feature vectors for all inputs.
θ – the model parameters.
µ , Σ – the mean and covariance of the parameters, they also denote the GPs in the feature space. α , C – the parameters of the mean and the covariance.
15
Chapter 1. Introduction BV – the set of “basis vectors”, the indexes of the data set kept by the GP learning algorithm. x1 , . . . , x N }. K N , Q N – the kernel or Gram matrix and its inverse for the input set {x
16
Chapter 2 Gaussian Process Representation and Online Learning Summary: Having an arbitrary likelihood and using Gaussian process priors, we show that the moments of the posterior process are expressible as a weighted sum of the prior kernels at the data location. This provides a representation for the posterior process exploited in the online learning setup where the first two moments of the posterior process are propagated sequentially to find an approximate solution to the problem. Modelling with Gaussian processes (GPs) has received increased attention in the machine learning community. A formal definition of the GPs is that of a collection of random variables fx having a (usually) continuous index where any finite collection of the random variables has a joint Gaussian x) = fx specified by the distribution [Cressie 1993]. The realisation of a GP is a random function f(x mean and covariance function of the GP. Inference with GPs is non-parametric since the “parameters” to be learnt are the mean and cox, fx ) variance functions describing fx . The function fx is used as a latent variable in a likelihood P(y|x which denotes the probability of an observable output variable y given the input x . For the inference using GPs, we only need to specify the prior mean and the prior covariance functions of fx , x, x ′ ) = Cov(fx , fx ′ ) [Wahba 1990]. The prior mean function is the latter is called the kernel K0 (x usually the zero function, thus the choice of the kernel fully specifies the GP. Having the training xn , yn )}N data {(x n=1 , the posterior process for fx is obtained from the prior and the likelihood using the Bayesian approach [Bernardo and Smith 1994; Williams 1999], as outlined in Section 1.2. There are two major obstacles in implementing this theoretically simple Bayesian inference: nonxi , x j ). In this chapter we consider Gaussianity of the posteriors and the size of the kernel matrix K0 (x the problem of representing the non-Gaussian posterior, and an intuitive KL-based approximation to reduce the size of the kernel matrix is proposed in Chapter 3. Obtaining analytical results in GP inference is precluded by the non-tractable integrals in the posterior averages, the normalisation from eq. (1.2). Various methods have been introduced to approximate these averages. A variety of such methods may be understood as approximations of the non-Gaussian posterior process by a Gaussian one [Jaakkola and Haussler 1999; Seeger 2000], for instance in [Williams and Barber 1998] the posterior mean is replaced by the posterior maximum (MAP) and information about the fluctuations are derived by a quadratic expansion around this maximum. The modelling approach proposed here is also an approximation to the posterior GP and uses the likelihood to obtain predictions. For this we need to represent the posterior GP using a finite number of parameters. This parametrisation is possible for the moments of the posterior process. Based on
17
Chapter 2. Gaussian Process Representation and Online Learning minimising a KL-distance, the parametrisation proposed for the posterior GP uses the form provided by the posterior mean and kernel functions. This form of the parametrisation does not depend on the likelihood model we are using, thus the particular likelihood will be left unspecified. Since we are propagating Gaussians, the framework presented suits unimodal likelihood functions. Using multimodal likelihoods, as in Section 5.4 is not theoretically difficult but the quality of approximation is poorer. This chapter starts by introducing GPs using generalised linear models, in Section 2.1 and the Bayesian learning applied to GPs in Section 1.2. We then deduce the parametrisation for the posterior moments, one of the main contributions of this thesis in Section 2.3. Based on the parametrisation we derive the online learning rules for approximating the posterior process in Section 2.4 and the chapter ends with a short discussion.
2.1
Generalised linear models
For an illustration of Bayesian learning from Section 1.1 we consider the problem of quadratic regression with additive Gaussian noise. This problem is analytically tractable and will be used in subsequent chapters to illustrate different aspect of the deduced algorithms. The likelihood for a single example is
· ¸ yi − f(x xi , θ)k2 ky y x θ P(y i |x i , ) ∝ exp − 2σ2
(2.1)
x, θ ) specifying the class of regressors to be used. with σ2 the variance of the noise and function f(x The prior over the parameters θ is Gaussian with zero mean and spherical covariance σ20 . Applying Bayes rule from eq. (1.3) leads to the posterior probability for the parameters θ : #² ± " 1 X σ2 2 2 θk θ|D) ∝ exp − 2 yi − f(x xi , θ )k + 2 kθ . p(θ ky 2σ σ0
(2.2)
i
x) is a linear combination of In generalised linear models [McCullagh and Nelder 1989] the function f(x x)}ki=1 , called the function dictionary: k functions {φi (x x) = f(x
k X
x) = θT Φx θi φi (x
(2.3)
i=1
x), . . . , φk (x x)]T . with model coefficients θ . We introduce the more compact vectorial notation Φx = [φ1 (x Since GPs can be obtained by a further generalisation step of the generalised linear models, we introduce the basic notation in this section; this notation is used in later chapters. The Gaussian data likelihood is the product of the individual likelihoods from eq. (2.1) and leads to a Gaussian posterior obtained by using eq. (2.2). To express the posterior, we group the values Φx 1 , . . . , Φx N ], introduce the bivariate of the dictionary function Φx for all data in the matrix Φ = [Φ Pk T ′ 2 ′ 2 x, x ) = σ0 l=1 φl (x x)φl (x x ) = σ0Φx Φx ′ , and build the N × N matrix K N = kernel function K(x
xr , x s )}N {K(x rs=1 . With these notations the mean and covariance of the posterior distribution, after an algebraic rearrangement of eq. (2.1), is: µθ = −
N X
σ20Φx r Crsy s = −σ20ΦCy (2.4)
rs=1
Σθ =
σ20I k
+
X
σ20Φx r CrsΦxTs σ20 = σ20I k + σ20ΦCΦ T σ20
rs
18
Chapter 2. Gaussian Process Representation and Online Learning ¡ ¢−1 y1 , . . . , y N ]T and C = − σ2I N + K N where we used the notation y = [y . The latter notation, used for the the posterior covariance, is rather complicated, but this is the form it appears later in this chapter (section 2.4, page 33) for the general non-parametric case. x) = y given the input x has Similarly to the posterior, the predictive distribution of the output f(x y|x x, D) = N (µy , σ2y ) with parameters also a Gaussian distribution, denoted p(y kxT Cy µy = x T µ θ = −k
(2.5)
σ2y = σ2 + x T Σθx = σ2 + k∗ + kxT Ckx
x, x 1 ), . . . , K(x x, x N )]T and k∗ = K(x x, x ) for the where σ2 is the noise variance and we used kx = [K(x kernel products. Note that σ20 was included into the kernel K, thus it is not explicit in eq. (2.5). General Gaussian processes are obtained from extending the Bayesian learning for the generalised linear models to a large set of basis functions. We can use arbitrarily large, even infinite dictionaries x)}∞ {φi (x i=1 in building the approximation from eq. (2.3). For the predictive distribution we only need
x, x ′ ), i.e. the covariance of the random variables f(x x) and f(x x ′ ): to specify the kernel function K(x x), f(x x ′ )i = K(x x, x ′ ) = hf(x
k X
x)φi (x x ′) σ2i φi (x
(2.6)
i=1
where we considered different variances σ2i for the random variables θi . We can choose the dictionary and the variances of the normal random variables freely, however x, x ′ ). In GPs we only consider the kernels and ignore this choice would only change the kernel K(x the possible dictionaries that might have generated it. Using the kernels provides larger flexibility: x, x ′ ) from eq. (2.6) converges, the dictionary is not important, it can be any as long as the sum K(x countable set. x, x ′ ) to be used as a kernel function is to generate a valid covariance matrix for The condition for K(x any input set X : the matrix K N is positive definite for arbitrary set of inputs, i.e. the kernel function
is positive definite. It has been shown that any positive definite kernel function can be written, using Mercer’s theorem [Vapnik 1995; Sch¨olkopf et al. 1999], in the form of eq. (2.6), thus they indeed can be viewed as being generated from a family of generalised linear models. The difference is that for kernels the size of the function dictionary does not need to be finite. Using infinite dictionaries, e.g. the dense family of RBF kernels, within the maximum likelihood estimation leads to over-fitting, this is not the case for the Bayesian parameter estimation method. In this case setting priors over the weights acts like regularisation [Tikhonov 1963; Poggio and Girosi 1990], preventing over-fitting. In the following we illustrate the decomposition of kernels into dictionary functions using two popular kernels: the polynomial and the radial basis kernel.
us first ® consider one-dimensional inputs and the dictionary for the generalised linear model be Let √ 2 x, x with random variables {θi }3i=1 all having zero means and unit variances. The random 1, 2x √ x + θ3x2 and we have the kernel as x) = θ1 + θ2 2x functions drawn from this model have the form f(x 2
2
x, x ′ ) = hf(x x)f(x x ′ )i = 1 + 2x xx ′ + (x xx ′ ) = (1 + xx ′ ) . K(x To find the functions and priors corresponding to the RBF kernels we will proceed in the opposite direction: we are considering the Taylor expansion of the exponential in the RBF kernel: ¶ µ 2 ¶ ∞ µ ∞ X xx ′ )n x + x ′2 X (x x − x ′ )2 (x x)φn (x x ′) x, x ′ ) = exp − = exp − σ2n φn (x = KRBF (x 2σ2 2σ2 n!(2σ2 )n n=0
19
n=0
(2.7)
Chapter 2. Gaussian Process Representation and Online Learning x) = exp(−x x2 /(2σ2 ))x xn and σ2n = 1/(n!2σ2 )n and we can indeed see that the RBF where we have φn (x kernel has a set of corresponding basis of functions with infinite cardinality. It is also obvious that by rescaling each component with σn , we have a spherical Gaussian prior for the parameter vector θ , a vector that will have infinitely many elements. It is important to mention that the decomposition of the kernels in pairs of feature spaces and associated scalar products is not unique. The quadratic polynomial kernel for example can be written © ª using a set of dictionary with four elements: 1, x , x , x 2 and requiring four random variables. Different embedding spaces for the RBF kernels can also be considered. For example a decompo-
sition to an orthonormal set of functions with respect to an input measure has been employed in Zhu et al. [1997]. The decomposition was used to prune the components of the infinite sum in eq. (2.6) to obtain a finite-dimensional linear model. The pruning considered only the most important dictionary functions and the result was a low-dimensional representation that kept as much information about the model as it was possible. In kernel methods the dictionary of the kernel defines the feature space F . Assuming we have k
x) = functions in the dictionary, the feature space is Rk and the projection function is defined by φ(x x), . . .]T . Using the projection function φ and the feature space F , φ(x x) = φx is the image of [σ1 φ1 (x the input x in the feature space and then the kernel function is x, x ′ ) = φxT φx ′ K(x
(2.8)
where we concatenate the outputs of the different φi -s into a vector. The kernel functions can then be viewed as scalar products of the projections from the input space to the feature space F and the
easiest way to gain insight into the kernel algorithms is by looking at the (usually) simpler linear algorithm in the feature space. The generalised linear model for the regression is tractable, however, the problem now is computational: usually the number of inputs is much higher than k, the number of parameters of the model.
This implies that a direct inversion of matrix C for computing the predictive distribution is inefficient. For the class of generalised linear models with finite dictionary there are efficient methods to find the predictive distribution, we can exploit that K N is not a full-rank matrix. For the non-parametric GPs, discussed next, the rank of KN generally equals the size of the data. This implies that matrix C cannot be inverted efficiently, and the problem of cubic computational time cannot be avoided.
2.2
Bayesian Learning for Gaussian Processes
x, x ′ ): an arbitrary sample f from In the following we will use GPs as priors with the prior kernel K0 (x x1 , . . . , x N ]T has a Gaussian distribution with covariance K X : the GP at spatial locations X = [x ° ¯ 1 (2.9) p0 (ff) ∝ exp − f T K X f . 2 Using f D = {f(x1 ), . . . , f(xN )} for the random variables at the data positions, we compute the posterior distribution as ppost (ff) =
R
dffD P(D|ff)p0 (ff, f D ) , hP(D|ffD )i0
(2.10)
where p0 (ff, f D ) is the joint Gaussian distribution of the random variables at the training and sample locations, hP(D|ffD )i0 is the average of the likelihood with respect to the prior GP marginal, p0 (ff).
20
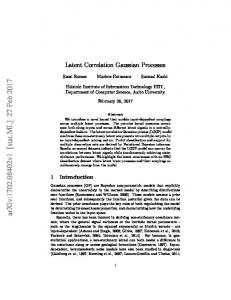
Chapter 2. Gaussian Process Representation and Online Learning Regression −− RBF kernels
Regression −− POL kernels of order 6 True function Training points Pred. Mean Pred. dev.
1.2 1 0.8
1 0.8
0.6
0.6
0.4
0.4
0.2
0.2
0
0
−0.2
−0.2
−0.4
−0.4
−0.6
−0.6
−0.8 −4
−3
−2
−1
0
1
2
3
True function Training points Pred. Mean Pred. dev.
1.2
−0.8 −4
4
−3
(a)
−2
−1
0
1
2
3
4
(b)
Figure 2.1: The mean function (thick dashed line) and the standard deviation (thin cont. line) of the posterior Gaussian process when presenting noisy samples (dots) of the sinc function (thick cont. line) using (a) RBF and (b) 6-th order polynomial kernels. The absence of the inputs in [2.5, 4] leads to higher uncertainty only for the RBF kernel. This is due to the localised nature of the RBF kernels: the further away from the origin, the higher the uncertainty in the predictions is. Computing the predictive distributions is the combination of the posterior with the likelihood of the data at x
Z
p(y) = dfx P(y|fx , x)ppost (fx ) =
R
dfx dffD P(y|fx , x )P(D|ffD )p0 (ffD , fx ) hP(D|ffD )i0
(2.11)
The analytic treatment is possible only for regression with Gaussian noise, which is presented next. The different approximation techniques to the posterior are given in Section 2.2.2
2.2.1
Exact results for regression
For regression we can immediately read from eq. (2.5) the predictive distribution corresponding to input x . It is a Gaussian with mean and covariance given by kxT Cy µx = −k σx2 = σ2 + k∗ + kxT Ckx
(2.12)
x) = [K0 (x x, x 1 ), . . . , K0 (x x, x N )]T , k∗ = K0 (x x, x ), where y is the vector of observed (noisy) outputs, k (x C = −(σ2I + K N )−1 with K N the kernel matrix of the data, and σ2 . This is the same as eq. (2.5) for the generalised linear models from Section 1.1. Figure 2.1 shows the result of the GP learning with a polynomial and an RBF kernel. The function we approximate is the noisy sinc function f(x) = sinc(x) + η (continuous line) where η is a zero mean Gaussian noise of variance σ2 = 0.2, noise variance assumed to be known. For this illustration we had equidistant inputs (dots) from the interval [−4, 2.5] and we plotted the mean and deviation of the predictive marginal distributions from the interval [−4, 4]. We see that due to the localised nature of the RBF kernels, the predictive uncertainty of the model is increasing in the regions where there are no input data (the right part of Fig 2.1.a). In contrast, when polynomial kernels are used, due to their non-localised kernel, the variance does not increase significantly outside the input region, providing a worse model. The differences can also be understood by comparing the supports for the two classes of kernels. Polynomial kernel has an infinite support, i.e. each data has effect over the
21
Chapter 2. Gaussian Process Representation and Online Learning whole input region. In contrast, the support of the RBF kernel is practically vanishing after a certain distance from the origin, depending on the value of the kernel parameters. This means that the RBF kernel is better suited to modelling the sinc function when the width of the RBF function being set appropriately. The 6-th order polynomial gives a crude estimation in this case. The GP regression is impossible for large datasets since the matrix C from eq. (2.12) has the number of columns and rows equal to the size of the dataset and we need an inversion to obtain it. Easing this computational load was considered by Gibbs and MacKay [1997]: the predictive mean from eq (2.12) was iteratively approximated using conjugate gradient minimisation of the quadratic form
1 u) = y T u + u T C −1u Q(u (2.13) 2 u) is quadratic, the conjugate gradient algorithm will converge to the with respect to u . Since Q(u Cy after N steps, and results at any previous stage constitute approximations to −C Cy true minima −C (again, due to the notation, C −1 is the known entity). A lower and an upper bound for the error based on eq. (2.13) has also been proposed, this gave a stopping criterion to the algorithm. Optimising simultaneously a pair of quadratic forms with a first one in eq. (2.13) and a second, slightly different u) = y T K Nu + 21 u T C −1K Nu was studied by Smola and Bartlett [2001]. The simultaneous function: Q∗ (u optimisation of the quadratic forms also provides a stopping criterion by combining the values of the two quadratic forms. The Bayesian committee machine [Tresp 2000] provides a different approach to avoid the inversion of large matrices. The assumptions made in this case is that the data is clustered into subsets D = {D1 , . . . , Dp }. In probabilistic terms this means that for any two subsets the conditional probabilities
of the outputs factorise, i.e. p(ffq |Di , Di+1 ) ≈ p(ffq )p(Di |ffq )p(Di+1 |ffq ), or practically that C has
a block-diagonal structure. This leads to p subproblems of smaller size and the combination of the
subproblems into predicting a unique value is done using Bayes’ rule. This approximation however might not perform well, since in large system there could be the case that, although the off-diagonal elements are not individually significant, the overall or cumulated effect cannot be neglected without a significant loss. In addition to the constraint imposed by large matrices for the regression case, a full Bayesian treatment of GPs using other likelihoods requires approximations to the models, presented next.
2.2.2
Approximations for general models
An approximation to the intractable posterior distribution is via sampling. Markov-chain Monte-Carlo methods have been used to sample from GP posteriors for regression and classification [Neal 1997]. Sampling was employed in the application of GPs for classification in “Bayes Point Machines” by Herbrich et al. [2001]: the resulting solution is the centre of mass of the version space, i.e. the space of all acceptable solutions for the classification. Sampling methods from a posterior obtained from a model inversion problem using Gaussian processes as priors has been considered [Nabney et al. 2000b] with the aim of finding the wind-fields underlying the scatterometer measurement (see Section 5.4 for details). The different sampling techniques are applicable to a large class of methods, however they are extremely time-demanding: the dimension of the space from which we are sampling is high, and in addition, it is hard to establish the convergence of algorithms. In what follows we will focus on analytic approximations.
22
Chapter 2. Gaussian Process Representation and Online Learning For classification, the logistic function is one possibility to be used in the likelihood x, fx ) = σ(fx ) = P(y = 1|x
1 1 + exp(−fx )
(2.14)
and this makes the GP posterior from eq. (2.10) analytically intractable. Several approximations have been thoroughly studied. A Laplace approximation around the MAP solution was suggested in [Williams and Barber 1998] where the Hessian and the approximation of the data likelihood led to the possibility of modifying the kernel function for the GP. A Laplace approximation and multiple iterations when predicting for an unknown value are also needed. A different approach is to use variational approximations to the logistic function to perform the required averages [Jaakkola and Haussler 1999; Gibbs and MacKay 1999]. The logistic function is approximated with exponentials having free variational parameters ξi for each input as £ ¤ σ(fi ) ≥ σ(ξi ) exp (fi − ξi )/2 + λ(ξi )(f2i − ξ2i )
with λ(ξ) a known function. Since the GP marginals are different for different inputs, the variational parameter ξi needs to be computed for each input. The approximation involves the optimisation with respect to the set of variational parameters ξi , a computationally demanding task, requiring iterative optimisation. For prediction, an additional optimisation with respect to a variational parameter ξx is required. Based on the variational methods, approximations can also be found via the minimisation of the θ) and q(θ θ) of the random KL divergence [Cover and Thomas 1991]. Having two distributions p(θ variable θ , the KL divergence is defined as Z
θ p(θ θ) ln KL(pkq) = dθ
θ) p(θ θ) q(θ
(2.15)
The KL divergence is used to approximate the posterior distribution arising from Bayes rule with a distribution belonging to a tractable class. The KL measure is not symmetric in its arguments, thus we have two possibilities to use it. Let p ^ denote the approximating distribution and ppost be the intractable posterior. Minimising KL(^ pkppost ) with respect to p ^ requires expectations to be carried only over the tractable distri-
bution p ^ ; this variational method in the context of Bayesian neural networks was called ensemble
learning [Hinton and van Camp 1993; Barber and Bishop 1998]. The KL distance is written as Z Z θp θ) ln p θ) − dθ p θ) ln ppost (θ θ) KL(^ pkppost ) = dθ ^ (θ ^ (θ ^ (θ (2.16) where the first term is the negative entropy term of the approximating distribution. The approximations usually belong to the exponential family, thus an exact integration is often possible. For mixture models the integration over the log-posterior is also intractable, a common substitution is made via the log-sum inequality, leading to an upper bound for the log-posterior [Singer and Warmuth 1998]. A variational approximation to the full posterior process was proposed by Seeger [2000] where the intractable posterior from eq (2.10) is approximated using a Gaussian with mean µ and a covariance P matrix Σ = D + i c ic Ti with D a diagonal matrix and c i additional parameters of the covariance [Bishop 1995]. This joint Gaussian distribution is for the parameters α of the MAP solutions the to posterior [Kimeldorf and Wahba 1971; Vapnik 1995] X x)MAP = xi , x ) f(x αi K0 (x i
23
(2.17)
Chapter 2. Gaussian Process Representation and Online Learning This equation is the posterior mean if GP priors are used (see [Opper and Winther 1999] and Section 2.3 for details), and efficient approximations within the mean-field framework were given [Csat´o et al. Q 2000]. The approximating distribution there was a factorising one i q(fi ) and the parameters for the individuals were obtained by computing the KL divergence between the posterior and the factorised
distributions, leading to approximations for the coefficients α from eq. (2.17). Additionally to the solution for the prediction problem, the variational framework provided bounds and approximations to the model likelihood, opening the possibility to optimise the hyper-parameters of the model. We can interchange the terms in the non-symmetric KL measure and try to optimise the “reversed” (compared to ensemble learning eq. (2.16)) KL divergence Z Z θ ppost (θ θ) ln ppost (θ θ) − dθ θ ppost (θ θ) ln p θ) KL(ppost k^ p) = dθ ^ (θ
(2.18)
The important difference compared to the measure in eq. (2.16) is that the approximating distribution appears only once and, more important, the averaging is done with respect to the exact posterior distribution. Analytic expression for the posterior is not available, generally this choice leads to equally difficult approximation problems. If one interprets the KL divergence as the expectation of the relative log loss of two distributions, this choice of divergence weights the losses with the correct distribution rather than with the approximated one. A second observation is that the variation of eq. (2.18) with respect to p ^ involves only the second term, the entropy of the posterior distribution (first term) being independent of the parameters used for approximation, whilst in the other case the entropy of the approximation needed to be considered. We will use this latter distance measure to approximate the intractable posterior. Since we are θ) will be Gaussian. dealing with Gaussian processes, hence normal distributions, the “tractable” p ^ (θ ^ ^ and Σ respectively, the KL divergence is Denoting the mean and covariance of p ^ with µ Z i h 1 ^ | + (θ ^ −1 (θ θ ppost (θ θ) ln |Σ θ −µ θ −µ ^ )T Σ ^ )T (2.19) dθ KL(ppost k^ p) = B + 2 where B is a constant that does not depend on the unknown parameters of p ^ . Differentiating eq. (2.19) ^ ^ and Σ gives us the mean and covariance of the intractable postewith respect to the parameters µ rior [Opper 1998], then setting the differentials to zero leads to Z θ θ ppost (θ θ) ^ = dθ µ Z ^ = dθ θ (θ θ −µ θ −µ θ) ^ )(θ ^ )T ppost (θ Σ
(2.20)
Thus, if the distance measure is chosen to be eq. (2.18), then the resulting approximation is the matching of the moments of the posterior process. However, the posterior distribution eq. (2.10) used for expressing posterior expectations in eq. (2.20) requires the evaluation of typically high dimensional integrals. This is also true for prediction, when we are interested in expectations of functions of the process at inputs which are not contained in the training set. Even if we had good methods for approximate integration, this would make predictions a rather tedious task. For a single data or if we can reduce our problem to one-dimensional integrals, there are several applicable approximations, both analytic and look-up table based. This has lead to the idea of online learning that iteratively approximates the posterior distribution by using a single data at every processing step [Opper 1996]. This iterative approximation to the posterior, also called projection to a tractable family, will be discussed in Section 2.4 later in this chapter.
24
Chapter 2. Gaussian Process Representation and Online Learning In the following the parametric model is replaced by the non-parametric GPs and the parameter x). The non-parametric case can be treated similarly to the parametric vector θ by a random function f(x one, we will refer to the non-parametric case as consisting of “any finite collection” of parameters. To apply the online learning for the non-parametric GPs, we need to find a convenient representation for the posterior moments. We will establish a “parametrisation” to the posterior moments that uses a number of parameters growing with the size of the data – this being the definition of non-parametric methods – presented next.
2.3
Parametrisation of the posterior moments
The predictive distribution of eq. (2.11), as it is presented, might require the computation of a new integral each time a prediction on a novel input is required. The following lemma shows that simple but important predictive quantities like the posterior mean and the posterior covariance of the process at arbitrary inputs can be expressed as a combination of a finite set of parameters which depend on the process at the training data only. Knowing these parameters eliminates the high-dimensional integrations when we are doing predictions. Based on the rules for partial integration we provide a representation for the moments of the posterior process obtained using GP priors and a given data set D. The property used in this chapter
x) with x ∈ Rd , based on the partial is that of Gaussian averages: for a differentiable scalar function g(x
integration rule [Gradshteyn and Ryzhik 1994], we have the following relation (Th. 1 on page 97): Z Z Z xp0 (x x) x g(x x) = µ dx xp0 (x x) g(x x) + Σ dx xp0 (x x) ∇g(x x) dx (2.21)
x) and its derivatives grow slower than an exponential to guarantee the existence where the function g(x of the integrals involved. We use the vector integral to have a more compact and more intuitive x) is the vector of derivatives. The vector µ is the mean and matrix Σ is the formulation and ∇g(x
covariance of the normal distribution p0 . To keep the text more clear, the proof is postponed to Appendix B. x) is a Gaussian and g(x x) is a likelihood. We The context in which eq. (2.21) is useful is when p0 (x
want to compute the moments of the posterior [Opper and Winther 1999; Csat´o et al. 2000]. For arbitrary likelihoods we can show that Lemma 2.3.1 (Parametrisation[Csat´ o and Opper 2002]). The result of the Bayesian update x, x ′ ) and data D = {(x xn , yn )| n = eq. (2.10) using a GP prior with mean function hfx i0 and kernel K0 (x 1, . . . , N} is a process with mean and kernel functions given by hfx ipost = hfx i0 + ′
′
N X
x, x i )q(i) K0 (x
i=1
x, x ) = K0 (x x, x ) + Kpost (x
N X
(2.22) ′
x, x i )R(ij)K0 (x xj , x ). K0 (x
i,j=1
The parameters q(i) and R(ij) are given by Z Z ∂ ∂P(D|ffD ) 1 = ln dffD p0 (ffD )P(D|ffD ) and dff p0 (ff) q(i) = xi ) Z ∂f(x ∂hfi i0 Z Z ∂2 P(D|ffD ) ∂2 1 dff p0 (ff) − q(i)q(j) = ln dffD p0 (ffD )P(D|ffD ) R(ij) = xi )∂f(x xj ) Z ∂f(x ∂hfi i0 ∂hfj i0 25
(2.23)
Chapter 2. Gaussian Process Representation and Online Learning R x1 ), . . . , f(x xN )]T and Z = dff p0 (ff)P(D|ffD ) is a normalising constant and the partial where f D = [f(x
differentiations are with respect to the prior mean at xi .
Proof. Using Bayes’ rule (eq. 2.10), the posterior process is p ^ (ff) = R
p0 (ff) P(D|ffD ) dff p0 (ff) P(D|ffD )
where f is a set of realisations for the random process indexed by arbitrary points from Rm , the inputs for the GPs. We compute first the mean function of the posterior process: R Z dffp0 (ff) fx P(D|ffD ) hfx ipost = dff p ^ (ff) fx = R dff p0 (ff) P(D|ffD ) Z 1 dfx dffD p0 (fx , f1 , . . . , fN ) fx P(D|f1 , . . . , fN ) = Z
(2.24)
where the denominator was denoted by Z, we used the vectorial notation f D = [f1 , . . . , fN ]T , and we x) = fx and f(x xi ) = fi . Observe that, irrespectively of the number also used the short notation f(x of the random variables of the process considered, the dimension of the integral we need to consider is only N + 1, all other random variables will be marginalised. We thus have an N + 1-dimensional integral in the numerator and Z is an N-dimensional integral. If we group the variables related to the data as f D = [f1 , . . . , fN ]T , and apply the property of Gaussian averages from eq. (2.21) (also eq. (B.1) x) by P(D|ffD ), we have from Appendix B) replacing x by fx and g(x µ Z 1 hfx i0 dfx dffD p0 (fx , f D ) P(D|ffD ) hfx ipost = Z ¶ Z N X x, x i ) dfx dffD p0 (fx , f D ) ∂i P(D|ffD ) K0 (x +
(2.25)
i=1
Σ in Theorem. 1). The variable fx where K0 is the kernel function generating the covariance matrix (Σ in the integrals disappears since it is only contained in p0 . Substituting back the normalising factor Z leads to the expression of the posterior mean as hfx ipost = hfx i0 +
N X
x, x i )qi K0 (x
(2.26)
i=1
where qi is read off from eq. (2.25) R dffD p0 (ffD ) ∂i P(D|ffD ) qi = R dffD p0 (ffD ) P(D|ffD )
(2.27)
It is clear that the coefficients qi depend only on the data, and are independent of the point x at which the posterior mean is evaluated. We will simplify the expression for qi by performing a change of variables in the numerator: fi′ = fi − hfi i0 where hfi i0 is the prior mean at x i and keeping all other variables unchanged fj′ = fj , j 6= i,
leading to the numerator
Z
′ ′ )∂i P(D|f1′ , . . . , fi′ + hfi i0 , . . . , fN ) dffD p0 (ffD
and ∂i is the differentiation with respect to the new variables fi′ . Since they are related additively, we can replace the partial differentiation with respect to fi′ with the partial differentiation with respect 26
Chapter 2. Gaussian Process Representation and Online Learning to the mean hfi i0 . Since the differentiation and integral operators apply for a distinct set of variables,
we can swap their order to have
Z ∂ ′ ′ ′ )P(D|f1′ , . . . , fi′ + hfi i0 , . . . , fN ) p0 (ffD dffD ∂hfi i0 where ∂/∂hfi i0 is the differentiation with respect to the mean of the prior GP at x i . We then perform
the inverse change of variables inside the integral and substitute back into the expression for qi Z ∂ Z dffD p0 (ffD )P(D|ffD ) ∂hfi i0 ∂ R = qi = ln dffD p0 (ffD )P(D|ffD ) . (2.28) ∂hfi i0 dffD p0 (ffD )P(D|ffD )
For the posterior covariance we follow a similar way. Using posterior averages, the kernel is expressed as: x, x ′ ) = hfx fx ′ ipost − hfx ipost hfx ′ ipost Kpost (x
(2.29)
and we can use the results from eq. (2.26) for the last term in the above equation. For the first average we apply the property of the Gaussian averages with g(ff, fx ′ ) = fx ′ P(D|ffD ) and using the posterior process from eq. (2.10), we have R dffD p0 (ffD , fx , fx ′ )fx fx ′ P(D|ffD ) R hfx fx ′ ipost = dffD p0 (ffD )P(D|ffD ) R X dffD p0 (ffD fx ′ ) ∂i (fx ′ P(D|ffD )) R x, x i ) K0 (x = hfx i0 hfx ′ ipost + dffD p0 (ffD )P(D|ffD ) x′
(2.30)
i∈D,i=x x
The summation in the second term is over the data set D and the second input index x ′ . The notation
∂i stands for the differentials with respect to fx i and fx ′ , the random variable fx ′ can be viewed as an additional data point at this stage. We split the sum in two parts, making explicit the term including x ′ , the derivative of g(ff, fx ′ ) with respect to fx ′ being P(D|ffD ) and cancelling the denominator, this leads to ′
x, x ) + hfx fx ′ ipost = hfx i0 hfx ′ ipost + K0 (x
X
x, x i ) K0 (x
i∈D
R
dffD p0 (ffD fx ′ ) fx ′ ∂i P(D|ffD ) R dffD p0 (ffD )P(D|ffD )
(2.31)
and we apply again Theorem 1 (eq. (2.21)) to each term of the sum where function g(ffD ) = ∂i P(D|ffD ); the last term is transformed as R R X X dffD p0 (ffD )∂j ∂i P(D|ffD ) dffD p0 (ffD )∂i P(D|ffD ) x ′, xj) R x, x i ) hfx ′ i0 R = + K0 (x K0 (x dffD p0 (ffD )P(D|ffD ) dffD p0 (ffD )P(D|ffD ) j∈D i∈D R R X X dffD p0 (ffD )∂i P(D|ffD ) dffD p0 (ffD )∂j ∂i P(D|ffD ) ′ x, x i ) R x, x i )K0 (x xj , x ) R hfx ′ i0 K0 (x + (2.32) K0 (x dffD p0 (ffD )P(D|ffD ) dffD p0 (ffD )P(D|ffD ) i∈D
i,j∈D
where the second line is just a rearrangement of the first one. All we have to do now is to substitute
back the resulting formulae in the equation for the posterior moment (2.29). Using qi from eq. (2.26) leads to the expression for the posterior kernel to x, x ′ ) = K0 (x x, x ′ ) + Kpost (x
N N X X
x, x i ) (Dij − qi qj ) K0 (x xj , x ′ ) K0 (x
(2.33)
i=1 j=1
where Dij is Dij =
1 Z
Z
dffD p0 (ffD )
27
∂2 P(D|fD ) ∂fj ∂fi
(2.34)
Chapter 2. Gaussian Process Representation and Online Learning and we can use the replacement in the differentiation where the random variable fx i is replaced with the prior mean hfx i i0 , using a similar procedure to that used for the first moment from eq. (2.27) to
eq. (2.28). Identifying Rij = Dij − qi qj leads to the required parametrisation in equation (2.23) from Lemma 2.3.1. Simplification of Rij = Dij − qi qj is made by changing the arguments of the partial derivative and using the logarithm of the expectation (repeating steps (2.27)–(2.28) made to obtain qi ), leading to
and this concludes the proof.
Z ∂2 Rij = ln dffD p0 (ffD )P(D|ffD ) ∂hfi i0 ∂hfj i0
(2.35)
The parametric form of the posterior mean, eq. (2.22), resembles the representation eq. (1.6) for other kernel approaches like the Support Vector Machines, that are obtained by minimising certain cost functions such as the negative log-posterior or the regularised linear models. These results are attractive, and they provide a representation for the solution of an optimisation problem that can be regarded as a maximum-likelihood solution (MAP) to the full Bayesian representation. While the latter representations are derived from the representer theorem of Kimeldorf and Wahba [1971] (generalised in [Sch¨olkopf et al. 2001]) our result from eq. (2.22) does, to our best knowledge not follow from this, but is derived from simple properties of Gaussian distributions. To have a probabilistic treatment for the problem, we need a representation for the full posterior distribution, and this has not been provided in the representer theorem. The representation lemma plays an important role in providing basis for the online learning, presented in Section 2.4. It also serves as a basis for the reduced representation (sparsity in Chapter 3) and, in addition to the non-probabilistic Support Vector Machines, in the applications we are able to compute the Bayesian error bars for the prediction. We also stress that the parameters q(i) and R(ij) have to be computed only once, in the training phase: they are fixed when we make predictions. The bad news is that the analytic computation of the parameters however is in most cases impossible. Apart from the lack of analytic tractability, the equations for the posterior moments require the computation of an integral having the dimension of the data. A solution to overcome the large computational difficulty is to build a sequential method for approximating the parameters, called online learning [Opper 1996; Opper 1998]. Before presenting the online learning for the GPs, let us describe a different perspective to the parametrisation lemma.
2.3.1
Parametrisation in the feature space
The parametrisation lemma provides us the first two moments of the posterior process. Apart from the Gaussian regression, where the results are exact, we can consider the moments of the posterior process as approximations. This approximation is written in a data-dependent coordinate system. We are using the feature space F and the projection φx of the input x into F . With the scalar product
from eq. (2.8) replacing the kernel function K0 , we have the mean and covariance functions for the
28
Chapter 2. Gaussian Process Representation and Online Learning posterior process as hfx ipost = hfx fx′ ipost = φxT φx ′ +
N X
i,j=1
N X
qi φxT φi
=
φxT
i=1
ÃN X
qi φi
i=1
φxT φi Rij φTj φx ′ = φxT IF +
!
N X
i,j=1
= φxT µF
(2.36)
φi Rij φTj φx ′ = φxT ΣF φx ′
This shows that the mean function is expressed in the feature space as a scalar product between two quantities: the feature space image of x and a “mean vector” µF , also a feature-space entity. A similar identification for the posterior covariance leads to a covariance matrix in the feature space that fully characterises the covariance function of the posterior process. The conclusion is the following: there is a correspondence of the approximating posterior GP with a Gaussian distribution in the feature space F where the mean and the covariance are expressed as µ F = Φq ΣF = IF + ΦRΦ T
(2.37)
with the concatenation of the feature vectors for all data. This result provides us with the interpretation of the Bayesian GP inference as a family of Bayesian algorithms performed in a feature space and the result projected back into the input space by expressing it in terms of scalar products. Notice two important additions to the kernel method framework given by the parametrisation lemma: • Bayesian learning algorithms for the GP imply the “estimation” of a Gaussian distribution in the feature space (we will present one in the next Section).
• The parametrisation from eq. (2.22) provides a structure for the covariance of the posterior process.
The main difference between the Bayesian GP learning and the non-Bayesian kernel method framework is that, in contrast to the approaches based on the representer theorem for SVMs which result in a single function, the parametrisation lemma gives a full probabilistic approximation: we are “projecting” back the posterior covariance in the input space. Also an important observation is that the parametrisation is data-dependent: both the mean and the covariance are expressed in a coordinate system where the axes are the input vectors φi and q and R are coordinates for the mean and covariance respectively. Using once more the equivalence to the generalised linear models from Section 2.2, the GP approximation to the posterior GP is a Gaussian µF , ΣF ). approximation to θ ∼ N (µ
A probabilistic treatment for the regression case has been recently proposed [Tipping 2001b] where
the probabilistic PCA method [Tipping and Bishop 1999; Roweis 1998] is extended to the feature space. The PPCA in the kernel space uses a simpler approximation to the covariance which has the form Σ = σ 2 I + ΦW Φ T
(2.38)
where the σ2 takes arbitrary values and W is a diagonal matrix of the size of the data. This is a special case of the parametrisation lemma of the posterior GP eq. (2.37). This simplification leads to a sparseness. This is the result of an EM-like algorithm that minimises the KL distance between the PN empirical covariance in the feature space i=1 φi φTi and the parametrised covariance of eq. (2.38), a 29
Chapter 2. Gaussian Process Representation and Online Learning more detailed discussion is delayed to Section 3.7. The minimisation of the KL distance can also seen as a special case of the online learning, that will be presented in the next section. In the following the joint normal distribution in the feature space with the data-dependent parametrisation from eq. (2.37) will be used to deduce the sparsity in the GPs.
2.4
Online learning for Gaussian processes
The representation lemma shows that the posterior moments are expressed as linear and bilinear combinations of the kernel functions at the data points. On the other hand, the high-dimensional integrals needed for the coefficients q = [q1 , . . . , qN ]T and R = {Rij } of the posterior moments are rarely computable analytically, the parametrisation lemma thus is not applicable in practise and more approximations are needed. The method used here is the online approximation to the posterior distribution using a sequential algorithm [Opper 1998]. For this we assume that the data is conditionally independent, thus factorising P(D|ffD ) =
N Y
P(yn |fn , x n )
(2.39)
n=1
and at each step of the algorithm we combine the likelihood of a single new data point and the (GP) prior from the result of the previous approximation step [Csat´o et al. 2000; Opper and Winther 2000]. If p ^ t denotes the Gaussian approximation after processing t examples, by using Bayes rule we have the new posterior process ppost given by ppost (ff) =
P(yt+1 |ff)^ pt (ff) hP(yt+1 |ffD )it
(2.40)
Since ppost is no longer Gaussian, we approximate it with the closest GP, p ^ t+1 (see Fig. 2.2). Unlike the variational method, in this case the “reversed” KL divergence KL(ppost k^ p) from eq. (2.18) is
minimised. This is possible, because in our on-line method, the posterior (2.40) only contains the likelihood for a single data and the corresponding non-Gaussian integral is one-dimensional. For many relevant cases these integrals can be performed analytically or we can use existing numerical approximations. In order to compute the on-line approximations of the mean and covariance kernel Kt we apply Lemma 2.3.1 sequentially with a single likelihood term P(yt |ft , x t ) at each step. Proceeding recursively, we arrive at x, x t+1 ) hfx it+1 = hfx it + q(t+1) Kt (x
x, x ′ ) = Kt (x x, x ′ ) + r(t+1) Kt (x x, x t+1 )Kt (x xt+1 , x ′ ) Kt+1 (x
(2.41)
where the scalars q(t+1) and r(t+1) follow directly from applying Lemma 2.3.1 with a single data xt+1 , fx t+1 ) and the process from time t: likelihood P(yt+1 |x ∂ lnhP(yt+1 |ft+1 )it ∂hft+1 it ∂2 = lnhP(yt+1 |ft+1 )it . ∂hft+1 it
q(t+1) = (t+1)
r
(2.42)
where “time” is referring to the order in which the individual likelihood terms are included in the approximation. The averages in (2.42) are with respect to the Gaussian process at time t and the
30
dKL
p^N−1
p^1
p0
ppost
(x N
(x1 , y1 )
ppost
,y N)
Chapter 2. Gaussian Process Representation and Online Learning
p^N
G
Figure 2.2: Visualisation of the online approximation of the intractable posterior process. The resulting approximated process the from previous iteration is used as prior for the next one. xt+1 )it . Note again, that these averages only require a derivatives taken with respect to hft+1 it = hf(x one dimensional integration over the process at the input xt+1 .
The online learning eqs. (2.41) in the feature space have the simple from Opper [1998]: hfx it+1 = hfx it + q(t+1) Σ t φt+1
Σ t+1 = Σ t + r(t+1) Σ t φt+1 φTt+1Σ t
(2.43)
and this form of the online updates will be used in Chapter 4 to extend the online learning to an iterative fixed-point algorithm. Unfolding the recursion steps in the update rules (2.41) we arrive at the parametrisation for the approximate posterior GP at time t as a function of the initial kernel and the likelihoods: hfx it
=
t X
x, x i )αt (i) = α Tt kx K0 (x
(2.44)
i=1
x, x ′ ) = K0 (x x, x ′ ) + Kt (x
t X
x, x i )Ct (ij)K0 (x xj , x ′ ) = K0 (x x, x ′ ) + kxT C tkx ′ K0 (x
(2.45)
i,j=1
with coefficients αt (i) and Ct (ij) defining the approximation to the posterior process, more precisely to its coefficients q and R from eq. (2.22) and equivalently in eq. (2.37) using the feature space. The coefficients given by the parametrisation lemma and those provided by the online iteration eqs. (2.44) and (2.45) are equal in the Gaussian regression case only. The approximations are given recursively as α t+1 = α t + q(t+1)s t+1 C t+1 = C t + r(t+1)s t+1s Tt+1
(2.46)
s t+1 = C tk t+1 + e t+1 xt+1 , x 1 ), . . . , K0 (x xt+1 , x t )]T and e t+1 = [0, 0, . . . , 1]T is the t + 1-th unit where k t+1 = kx t+1 = [K0 (x vector. We prove eqs. (2.44) and (2.45) by induction: we will show that for every time-step we can express the mean and kernel functions with coefficients α and C ,which are functions only of the data points
31
Chapter 2. Gaussian Process Representation and Online Learning x i and kernel function K0 and do not depend on the values x and x ′ at which the mean and kernel functions are computed. Proceeding by induction and using the induction hypothesis α 0 = C 0 = 0 for time t = 1, we have x1 , x ) (from α1 (1) = q(1) and C1 (1, 1) = r(1) . The mean function at time t = 1 is hfx i = α1 (1)K0 (x
x, x ′ ) = K0 (x x, x ′ ) + lemma 2.3.1 for a single data, eq. (2.41)). Similarly the modified kernel is K1 (x x, x 1 )C1 (1, 1)K0 (x x1 , x ′ ) with α and C independent of x and x ′ , thus proving the induction hypothK(x esis. We assume that at time t we have the parameters α t and C t independent of the points x and
x′
x and the mean and kernel functions expressed according to eq. (2.44) and (2.45) respectively. The update for the mean can then be written as hfx it+1
=
t X
xi , x )αt (i) + q(t+1) K0 (x
i=1
=
t X i=1
=
t+1 X
t X
x, x i )Ct (i, j)K0 (x xj , x t+1 ) K0 (x
i,j=1
x, x t+1 ) +q(t+1) K0 (x
x, x i ) αt (i) + q(t+1) K0 (x
t X j=1
x, x t+1 ) xj , x t+1 ) + q(t+1) K0 (x Ct (i, j)K0 (x (2.47)
x, x i )αt+1 (i) K0 (x
i=1
where α t+1 does not involve the input x and the update is as in eq. (2.46). Writing down the update equation for the kernels x, x ′ ) = K0 (x x, x ′ ) + Kt+1 (x "
t X
x, x i )Ct (ij)K0 (x xj , x ′ ) + K0 (x
i,j=1 t X
x, x t+1 ) + r(t+1) K0 (x
K0 (x xt+1 , x ′ ) + x, x ′ ) + = K0 (x
t+1 X
i,j=1
"
x, x i )Ct (ik)K0 (x xk , x t+1 ) K0 (x
i,k=1
x, x i ) Ct (ij) + r(t+1) K0 (x
Ã
t X
j,l=1
t X
t+1 X
à t X x, x i )Ct+1 (ij)K0 (x xj , x ′ ) K0 (x
x, x l )Ct (lj)K0 (x xj , x ′ ) K0 (x
xk , x t+1 ) + δi,t+1 Ct (ik)K0 (x
k=1
k=l
x, x ′ ) + = K0 (x
#
!
!
xj , x ′ ) xl , x t+1 ) + δj,t+1 K0 (x Ct (lj)K0 (x (2.48)
i,j=1
where in the elements of C t+1 are independent of x and x ′ and we can read off the updates for the elements of the matrix C t+1 easily. In summary, we have the recursions for the GP parameters in vectorial notation from eqs. (2.47) and (2.48). Replacing δi,t+1 with the t + 1-th unit vector e t+1 we obtain the recursion equations eq (2.46). To illustrate the online learning we consider the case of regression with Gaussian noise (variance σ20 ), presented in Section 1.1. At time t + 1 we need the one-dimensional marginal of the GP 32
Chapter 2. Gaussian Process Representation and Online Learning αt , C t ), the marginal being taken at the new data point x t+1 . This marginal is a parametrised with (α normal distribution with mean mt+1 = kTt+1αt and covariance σ2t+1 = k∗ + kTt+1Ctkt+1 . The next step is to compute the logarithm of the average likelihood 2
¢¤ (yt+1 − mt+1 ) 1 £ ¡ ¢ lnhP(yt+1 |fx t+1 , x t+1 )it = − ln 2π σ20 + σ2t+1 − ¡ 2 2 2 σ0 + σ2t+1
and the first and second derivatives with respect to the mean mt+1 give the scalars q(t+1) and r(t+1) : yt+1 − mt+1 σ20 + σ2t+1 1 =− 2 σ0 + σ2t+1
q(t+1) = r(t+1)
Cty t and Comparing the update equations with the exact results for regression, we have α t = −C C t = −(σ20I + K t )−1 , this is identical to the case of generalised linear models (section 2.1, eq. (2.4)). The iterative update gives an efficient approach for computing the inverse of the kernel matrix. This has been used in previous applications to GP regression [Williams 1996; Gibbs and MacKay 1997], the inductive proof uses the matrix inversion lemma and it is very similar to the iterative inversion of the Gram matrix, presented in detail in Appendix C. The online algorithm however, is applicable to a much larger class of algorithms, as detailed next.
2.5
The online learning algorithm
For the algorithm we assume that we can to compute or approximate the average likelihood required for the update coefficients q(t+1) and r(t+1) . The online algorithm is initialised with an “empty” set of parameters: all values of α and C are zero. Nonzero values for the parameters α and C at t + 1-th position will appear only at time t + 1, before that all coefficients from α and C at the t + 1-th position are zero. In implementations we can ignore the zero elements, and increase the parameters sequentially. The sequential increase of the parameters has also been proposed by [Jaakkola and Haussler 1999] for implementing regression and classification with Bayesian kernel methods. It is clear from the parameter update equations (2.46) that the t + 1-th unit vector e t+1 is responsible for extending the nonzero parameters. In the proposed online learning algorithm we initialise the GP parameters and the inverse Gram xt+1 , yt+1 ) the following matrix to empty values, and set the “time” counter to zero. Then for all data (x steps are iterated: 1. Compute the scalars q(t+1) , r(t+1) , and vectors k t+1 and s t+1 . αt+1 , C t+1 ). 2. Update the values of the GP parameters (α The problem with this simple algorithm is the quadratic increase of the number of parameters with the size of the processed data. In any real application we assume that the data lives on a lowdimensional manifold. The ever-increasing size of parameters is then clearly redundant, especially if the feature space defined by the kernel is finite-dimensional as is the polynomial kernel. In this case there would be no need to have a basis for any GP larger than the dimension of the feature space, this being addressed in Chapter 3.
33
Chapter 2. Gaussian Process Representation and Online Learning
2.6
Discussion
In this chapter we provided a general parametrisation for the moments of the posterior process using general likelihoods. The parametrisation lemma extends the representer theorem of Kimeldorf and Wahba [1971] to a Bayesian probabilistic framework. We provided a feature space view of the approximate posterior and showed that we can view it as a normal distribution for the model parameters in the feature space. Using the parametrisation lemma we deduced an online algorithm for the Gaussian processes. We use a complete Bayesian framework, to produce a sequential second order algorithm that is applicable to a wide class of likelihoods. Due to averaging with respect to a Gaussian measure, we are able to use even non-differentiable or non-continuous likelihoods like the step function for classification problems (will be discussed in details in Chapter 5). An important drawback of the online learning algorithm presented when applied for small datasets is the restriction of a single sweep through the data. This prevents us from getting improvements in the approximation by multiple processing the whole dataset, the benefit of the batch methods. This shortcoming of the algorithm will be addressed in Chapter 4, where we will discuss an extension to the basic online learning to allow multiple processing of each data point, proposed by Minka [2000]. If the data size increases indefinitely – in the case of real-time monitoring processes for example – the GPs presented are also not applicable in their present form: we are required to store all previously seen inputs. This quadratic scaling makes the machines on which the GP is implemented to run out of resources. With our aim the efficient representation, in Chapter 3 we give a framework for a flexible treatment of the GP. A subset of the inputs will be retained and we will develop updates that keep the size of the this set constant. We derive a rule to decide which input should be added or be left out from the GP, together with the possibility of removing data from the GP. All modifications are based on minimising the KL divergence in the family of GPs.
34
Chapter 3 Sparsity in Gaussian Processes Summary: Further approximations to GPs are considered. We deduce and minimise the KL-divergence between the original GP and a second, constrained GP. The constraints lead to sparsity. The quality of the approximation is examined using the KL-distance and a decision rule for deleting the data points is proposed. We then combine online learning, input removal, and computation of the error term to produce an algorithm that controls the size of the GP irrespective of the processed data size, this being the main contribution of the thesis.
The representer theorem of Kimeldorf and Wahba [1971] provides an analytic form to the MAP solution for a large class of likelihoods within the kernel framework, and in Chapter 2 a similar representation for the posterior process in the Bayesian framework was provided. However, when making predictions, these parametrisations require all data. The aim of this chapter is to propose a solution in which the prediction is given in terms of a subset of the data, which will be referred to as the set of Basis Vectors and the solution as sparse solution. Sparsity in non-parametric families is important since the typical data set size for real applications can be very large. Although theoretically attractive, due to their “non-parametric nature” the kernel methods are of restricted usage; they cannot be easily applied for extracting information from large datasets. This is illustrated for example by the quadratic scaling of the number of parameters with the size of the data set for the GP. Predictions involving a small subset of the original data were given originally for classification using the Support Vector Machines (SVM) [Vapnik 1995] and then extended to treat regression. These results are batch solutions that require an optimisation with respect to the full dataset. Usually there are efficient solutions to the problem when the data is small, but these solutions are not feasible for large datasets. In recent years iterative methods were developed that break down the optimisation problem into subproblems such as chunking [Osuna and Girosi 1999], or the sequential minimal optimisation [Platt 1999a]. These methods were developed to the SVMs with an ǫ-insensitive loss function for the regression and the classification case. The sparse representation in SVMs is a result of the non-differentiable nature of the cost functions, if we replace it for example with a quadratic loss function, the solution is not sparse any more. In this chapter we develop sparse solutions to arbitrary likelihoods in the Bayesian GP framework. To do x) of an input x in the feature space F . The projection of all data this, we first consider the image φ(x
points into F defines a data-manifold with a usually much smaller dimension than the dimension of the embedding space F . Nevertheless, since the data is more dispersed across the dimensions than
in the input space, the feature space projection gives more freedom for the linear algorithms to find
35
Chapter 3. Sparsity in Gaussian Processes a solution for the regression or classification case. This can be seen clearly when we perform linear regression in a feature space corresponding to an infinite-dimensional RBF kernel: we have an exact fit for arbitrary large data. Here we exploit the assumption that the data-manifold is of a much lower dimensionality than the data itself.1 A first constraint to the problem was the prior on the parameters or the prior GP in the Bayesian framework from Chapter 2. Here the Bayesian solution will further constrained: we impose the resulting GP to be expressed solely based on a small subset of the data, using the parametrisation given in eq. (2.22). The small subset is selected by sequentially building up the set of basis points for the GP representation. This set, which is of a fixed size, is called the set of “basis vectors” or BV set, is introduced
in the next section. This section also details previous attempts and an intuitive picture for the sparse approximation. We address the question of removing a basis vector that is already in the GP by computing the KL-distance between two GPs in Section 3.2. The KL-distance is computed using the equivalence of the GPs with the normal distribution in the feature space induced by the kernel. c that is The KL-distance is then used in a constrained optimisation framework to find a process GP the closest possible to the original one but has zero coefficients whenever the last BV is encountered.
The GP solution is independent of the order of the BV , meaning that any of the inputs can be put in the last position. We thus implement pivoting in the GP family parametrised in a data-dependent coordinate system. Sparsity using the KL-divergence and a constrained optimisation is presented in Section 3.3 with an estimation of the error in Section 3.4. A combination of the online GP updates from the previous chapter and the constrained optimisation results in the sparse online updates (Section 3.5). The theory is coalesced into a sparse online algorithm in Section 3.6. The subject of efficient low-dimensional representations in the framework of the non-parametric kernel method is under an intense study and we give an overview of the different approaches to sparsity in Section 3.7. We conclude the chapter with discussions and a list of possible future research directions.
3.1
Redundancy in the representation
We start the discussion about sparsity by having a closer look at the online learning algorithm introduced in Chapter 2. The algorithm adds a single input to the GP at each step, this addition implies the extension of the basis in which we expressed the GP, given in eq. (2.22). If the new input was in the linear span of all previous inputs, then the addition of a new vector in the basis is not necessary. Indeed, if we write φt+1 as φt+1 =
t X
e^i φi
(3.1)
i=1
and we substitute it in the update eq. (2.43) for the last feature vector, then an equivalent representation of the GP can be made that uses only the first t feature vectors. Unfortunately eq. (3.1) does not hold for most of the cases. Again, using as an example the popular RBF kernels, any set of distinct points maps to a linearly independent set of feature vectors. The feature space is a linear Hilbert space, and we use the linear algebra to decompose the new feature vector into (1) a component that 1 This is a reasonable assumption if we want to extract information from the data, or equivalently we want to have predictions based on the dataset. A uniform distribution of the data would be completely non-informative.
36
Chapter 3. Sparsity in Gaussian Processes
Φt+1
Φ1
L (Φ,...,Φ) 1 t
^ Φ t+1
Φt
Φres Figure 3.1: Visualisation of the projection. The new feature vector φt+1 is projected to the subspace ^ t+1 and its orthogonal residual φres . It is spanned by {φ1 , . . . , φt } resulting in the projection φ important that φres has t + 1 components, i.e. it needs the extended basis including φt+1 . is included in the subspace of the first t features and (2) one that is orthogonal to it and write φt+1 =
t X
e^t+1 (i)φi + γt+1 φres = e^t+1Φ t + γt+1 φres
(3.2)
i=1
where the first term is the orthogonal projection expressed in a vectorial form with the coordinates of the projection e^t+1 = [^ et+1 (1), . . . , e^t+1 (t)]T . All previous feature vectors have been grouped into the vector Φ t = [φ1 , . . . , φt ] and φres is the residual, the unit vector orthogonal to the first t feature ^ t+1 k2 with the norm in the feature vectors. The squared length of the residual is γt+1 = kφt+1 − φ
a, a i = ka ak2 ; the scalar product is defined using the kernel hφx , φy i = K0 (x x, y ) and space given by ha ^ t+1 denotes the approximation to φt+1 in the subspace of all previous inputs. The squared length φ of the residual γt+1 > 0 appears also in the recursive computation of the determinant of the kernel Kt+1 | = |K Kt | γt+1 (see Appendix C or [Mardia et al. 1979] for details). If we proceed Gram matrix: |K sequentially, then a way of keeping the kernel matrix nonsingular is to avoid the inclusion of those elements for which γi = 0. This is a direct consequence of the linearity of the feature space and in applications helps to keep the algorithm stable, will avoid singular or almost singular kernel Gram matrices. Fig. 3.1 provides a visualisation of the inputs and the projection in the feature space. We plotted the residual vector φres that is orthogonal to the span of the previous feature vectors with squared length γt+1 . An intuitive modification of the online algorithm is to project the feature space representation of the new input when the error caused by this projection is not too large. As a heuristic we can define the errors as being the length of the residual γt+1 . We might justify this choice by the assumption that the inputs are not random, i.e. they lie on a lower-dimensional manifold in the feature space. The geometric consideration from Fig. 3.1 builds a linear subspace onto which the inputs are projected using eq. (3.2). This subspace however does not consider the noise on the outputs, thus might be suboptimal, i.e. include into the representation inputs that are coming from a noisy region of the data, wasting resources. To implement this sparse algorithm, we need to compute the projection coordinates e^t+1 and the
squared distance γt+1 from eq. (3.2). These values are obtained from minimising the squared distance ^ t+1 k2 . Expanding φ ^ t+1 using eq. (3.2) and replacing the scalar products in the feature kφt+1 − φ 37
Chapter 3. Sparsity in Gaussian Processes space with the corresponding kernel functions, we have the following equation to minimise: eTt+1kt+1 + k∗ e^Tt+1Kte^t+1 − 2^ x1 , x t+1 ), . . . , K0 (x xt , x t+1 )]T and k∗ = K0 (x xt+1 , x t+1 ), where K t is the kernel matrix and k t+1 = [K0 (x xi , x j ) = hφi , φj i. The differentiating it with respect to the kernel functions obtained using K0 (x
unknowns e^t+1 we obtain a linear system with solution
e^t+1 = K −1 t k t+1 .
(3.3)
The changes in the online updates from Chapter 2 as a result of this projection are minimal: the αt+1 , C t+1 ) are computed using new parameters (α s^t+1 = C tk t+1 + e^t+1
(3.4)
instead of s t+1 in eq. (2.46), thus the projected parameters replace the true inputs. The result of this substitution is important: although the new example has been processed, the size of the model parameters is not increased. The computation of s^t+1 however requires the inverse of the Gram matrix, a costly operation. The following formula gives an online update to the inverse Gram matrix Q t+1 = K −1 t+1 which is based on the matrix inversion lemma (see Appendix C for details): Q t+1 = Q t + γ−1 e t+1 − e t+1 )(^ e t+1 − e t+1 )T . t+1 (^
(3.5)
where e t+1 is the t + 1-th unit vector and e^t+1 = Q tk t+1 is the projection from eq. (3.3). The length of the residual is also expressed recursively: γt+1 = k∗ − k Tt+1Q tk t+1 = k∗ − k Tt+1e^t+1 . Observe that, in order to match the dimensions of the elements, we have to add an empty last row and column to Q t and a zero last element to e^t+1 before performing the update. The addition of the zero element can formally be written using functions that do this operation. This simpler form of writing the equations without the extra function for some components has been chosen to preserve clarity. The idea of projecting the inputs to a linear subspace specified by a subset has been proposed by Wahba [1990, Chapter 7] (or more recently by Wahba et al. [1999] and Sch¨olkopf et al. [1999]) using a batch framework and maximum a-posteriori solutions. P Writing the MAP solutions as a linear combination of the input features φMAP = i αi φx i , P ^ the projection to the subset is obtained using the approximation φx i ≈ j e^x i (j)φj for each input,
{φj }j=1,k being the subset onto which the inputs are projected.
If we perform the iterative computation of the inverse kernel matrix from eq. (3.5) together with the GP update rules, we can modify the online learning rules in the following manner: we keep only those inputs whose squared distance from the linear subspace spanned by the previous elements is higher then a predefined positive threshold γt+1 > ǫtol . This way we arrive at a sparse online GP algorithm. This modification of the online learning algorithm for the GP family has been proposed by us in [Csat´o and Opper 2002; Csat´o and Opper 2001]. Performing this modified GP update sequentially for a dataset, there will be some vectors for which the projection is used and others that will be kept by the GP algorithm. In the following we will call the set of inputs the set of Basis Vectors for the GP and we will use the notation BV for an element of the set and BV set for the whole set Basis Vectors.
The online algorithm sketched above is based on “measuring” the novelty in the new example with respect to the set of all previous data. It may or may not add the new input to the BV set. on the 38
Chapter 3. Sparsity in Gaussian Processes other hand, there might be cases when there is a new input which is regarded “important” but due to the limitations of the machines we cannot include it into the BV set. There might not be enough
resources available, thus it would be necessary to remove an existent BV to allow the inclusion of the new data.
However by looking at the new data only, there are no obvious ways to remove an element from the BV set. A heuristic was proposed in [Csat´o and Opper 2002] by assuming that the GP is approximately
independent of the order of the presentation of the data. This independence lead to the permutability
of the order of presentation and thus when removing a BV element we assumed that it was the last ^ t+1 from added to the BV set. The approximation of the feature vector φt+1 with its projection φ
eq. (3.2) was made, effectively removing the input φt+1 from the BV set. The error due to the
approximation has also been estimated by measuring the change in the mean function of the GP due to the substitution. The change was measured at the inputs present in the BV set and the location of
the new example. Since the projection into the subspace spanned by the previous data was orthogonal, the mean function of the GP was changed only at the new input with the change induced being εt+1 = |αt+1 (t + 1)|γt+1 =
αt+1 (t + 1) Qt+1 (t + 1, t + 1)
(3.6)
where the substitution Qt+1 (t + 1, t + 1) = γ−1 t+1 is based on the iterative inversion of the inverse Gram matrix from eq. (3.5). The score εt+1 can be computed not only for the last element, but, by assuming permutability of the GP parameters, for all elements in the BV set. Its computation
is simple if we have the inverse Gram matrix and in the online algorithm this was the criterion for removing an element from the BV set. This score is lacking the probabilistic characteristic of the Gaussian processes in the sense that in computing it we ignore the changes in the kernel functions.
Later in this chapter the heuristics discussed so far is replaced with a different approach to obtain sparsity: we compute the KL-divergence between the Gaussian posterior and a new GP that is constrained to have zero coefficients corresponding to one of the inputs. That input is then removed from the GP. We are mentioning that removing the last element is a choice to keep the computations clear, all the previously mentioned operations are extended in a straightforward manner to any of the basis vectors in the BV set by permuting the order of the parameters. Section 3.2 presents the basis of the sparse online algorithms: the analytic expression of the KL-divergence in the GP family.
3.2
Computing the KL-distances
In online learning we are building approximations based on minimising a KL-divergence. The learning algorithm from Chapter 2 was based on minimising the KL-distance between an analytically intractable posterior and a simple, tractable one. The distance measures thus play an important role in designing approximating algorithms. Noting the similarity between the GP and the finitedimensional normal distributions, we are interested in obtaining some distance measures in the family of Gaussian processes. In this section we will compute the “distance” between two GPs based on the representation lemma in Chapter 2 (also [Csat´o and Opper 2002]) using the observation that GPs can be viewed as normal distributions with the mean µF and the covariance ΣF given as functions of the input data, shown in eq. (2.36).
39
Chapter 3. Sparsity in Gaussian Processes If we consider two GPs using their feature space notation, then we have an analytical form for the KL-divergence [Kullback 1959] by integrating out eq. (2.15): ¯ ¯ ³ ´ ¯ −1 ¯ µ2 − µ 1 ) + tr Σ 1Σ −1 µ2 − µ 1 )T Σ −1 2KL(GP 1 kGP 2 ) = (µ 2 − IF − ln ¯Σ 1Σ 2 ¯ 2 (µ
(3.7)
where the means and the covariances are expressed in the high-dimensional and unknown feature space. The trace term on the RHS includes the identity matrix in the feature space, this was obtained by the substitution dF = tr(IIF ) where dF is the “dimension” of the feature space. We will express this measure in terms of the GP parameters and the kernel matrix at the basis points. The two GPs might have different BV sets. Without loosing generality, we unite the two BV
sets and express each GP using this union by adding zeroes to the inputs that were not present in the respective set. Therefore in the following we assume the same support set for both processes. α1 , C 1 ) and (α α2 , C 2 ) and the The means and covariances are parametrised as in eq. (2.36) with (α corresponding elements have the same dimensions. We will use the expressions for the mean and the covariance functions in the feature space: µ = Φα and Σ = IF + ΦCΦ T from eq. (2.37) with Φ = Φ B the concatenation of all BV elements expressed in
the feature space. The KL-divergence is transformed so that it will involve only the GP parameters and the inner product kernel matrix K B = Φ T Φ . This eliminates the matrix Φ in which the number of columns equals the dimension of the feature space. For this we transform the inverse covariance using the matrix inversion lemma as ´−1 ³ ³ ´−1 C−1 + K B )−1Φ T IF + ΦCΦ T = IF − Φ C −1 + Φ T IF Φ Φ T = IF − Φ (C
and using this result we obtain the term involving the means as h i −1 T α2 − α 1 )T Φ T IF − Φ (C C−1 α2 − α 1 ) (α + K ) Φ Φ (α B 2 ¸ · ´−1 ³ α2 − α 1 ) α2 − α 1 )T K B − K B C −1 K B (α = (α 2 + KB ´−1 ³ α2 − α 1 ) α2 − α 1 )T C 2 + K −1 (α = (α B
(3.8)
(3.9)
(3.10)
where we assumed that the kernel matrix including all data points K B is invertible. The matrix inversion lemma eq. (A.1) has been used in the opposite direction to obtain eq. (3.10). The condition of K B being invertible is not restrictive since a singular kernel matrix implies we can find an alternative representation of the process that involves a non-singular kernel matrix (i.e. linearly independent basis points, see the observation at eq. (3.2)). For the second term of eq. (3.7) we use the property of traces ABC ) = tr(B BCA ). Using eq. (3.8) again we obtain tr(A ¸ ¶ · µ ³ ´−1 T T −1 − IF Φ tr (IIF + ΦC 1Φ ) IF − Φ C 2 + K B ¸ ¶ · µ i. h ´−1 ´−1 ³ ³ −1 −1 T −1 −1 C1 − C 2 )(C C2 + K B ) + C 1 Φ = tr (C − C2 + KB tr Φ C 1K B C 2 + K B
(3.11)
This provides a representation of the trace using the kernel matrix and the parameters of the two GPs. For the third term in eq. (3.7) we are using the property of the log-determinant ln(|II + A |) = tr ln(II + A ) = −
∞ X (−1)n An trA n
n=1
40
(3.12)
Chapter 3. Sparsity in Gaussian Processes KL−distances during online learning 1000 KL(t+1|t) KL(t|t+1)
900 800 700 600 500 400 300 200 100 0 0
50
100
150
Figure 3.2: The evolution of the KL-divergences for the case of online regression using the Friedman dataset #1. The training set size is 150 and we plot the average KL-distances taken over 50 experiments (we used RBF kernels with σ2K = 2). together with the permutability of the components in traces and obtain ¯ ¯ ¯ ¯ Σ1Σ −1 ln ¯Σ 2 ¯
=
∞ ¯ ¯ in X (−1)n h ¯ ¯ −1 ln ¯IIF + Σ 1Σ −1 = − − I Σ − I tr Σ ¯ 1 F F 2 2 n n=1
∞ in X (−1)n h −1 C1 − C 2 )(C C2 + K −1 tr (C = − ) B n n=1 ¯³ ¯ ¯ ´³ ´−1 ¯¯ ¯ ¯ −1 −1 ¯ −1 −1 ¯ ¯ C1 − C 2 )(C C2 + K B ) ¯ = ln ¯ C 1 + K B C2 + KB = ln ¯II + (C ¯
(3.13) (3.14)
In deriving the smaller dimensional representation from eq. (3.13) the permutability of the matrices inside the trace function has been used as in eq. (3.11). This leads to the equation for the KL-distance between two GPs ³ ´−1 α2 − α 1 ) C 2 + K −1 α2 − α 1 ) 2KL(GP 1 kGP 2 ) = (α (α B ¯³ i ´³ ´−1 ¯¯. h ¯ −1 −1 −1 ¯ ¯ C2 + K −1 C1 − C 2 )(C C − ln C ) + K + K + tr (C 2 B B B ¯ 1 ¯
(3.15)
We see that the first term in the KL-divergence is the distance between the means using the metric provided by GP 2 . Setting C 2 = 0 we would have the matrix K B as metric matrix for the parameters
of the mean. This problem was solved for the zero mean functions and a diagonal restriction for
C 1 , the posterior kernel, to obtain the “Sparse kernel PCA” [Tipping 2001b], discussed in details in Section 3.7.1. We stress that the computation of the KL-distance is based on the parameters of the two GPs and the kernel matrix. It is important that the GPs share the same prior kernels so that the same feature space is used when expressing the means and covariances in eq. (2.37) for the Gaussians in the feature space. As an example, let us consider the GPs at times t and t + 1 from the online learning scheme and compute the KL-divergences between them. Since the updates are sequential and include a single term each step, we expect that the KL-divergence between the old and new GP to be expressible using scalars. This is indeed the case as we can write the two KL-divergences in terms of scalar quantities: ´ ³ 2KL(GP t+1 kGP t ) = (q(t+1) )2 + r(t+1) σ2t+1 − ln(1 + r(t+1) σ2t+1 ) ´ ³ 2KL(GP t kGP t+1 ) = (q(t+1) )2 − r(t+1)
1+
41
σ2t+1 (t+1) r σ2t+1
+ ln(1 + r(t+1) σ2t+1 )
(3.16)
Chapter 3. Sparsity in Gaussian Processes where the parameters are taken from the online update rule eq. (2.46) and σ2t+1 = k∗ + k Tt+1C tk t+1 is the variance of the marginalisation of GP t at xt+1 . We plotted the evolution of the pair of KLdivergences in Fig. 3.2 for a toy regression example, the Friedman dataset #1 [Friedman 1991]. The
inputs are 10-dimensional and sampled independently from a uniform distribution in [0, 1]. The output x) = sin(πx1 )x2 + 20(x3 − 0.5)2 + 10x4 + 5x5 + η with the last uses only the first 5 components f(x component a zero-mean unit variance random noise. The noise variance in the likelihood model was σ20 = 0.02. We see that in the beginning the two KL-divergences are different, but as more data are included in the GP, their difference gets smaller. This suggests that the two distances coincide if we are converging to the “correct model”, i.e. the Bayesian posterior. It can be checked that the dominating factor in both divergences is σ2t+1 , this factor will be of second order (i.e. of the fourth power of σt+1 ) if we subtract the two divergences (and expand the logarithm up to the second order). Furthermore, since we are in the Bayesian framework, the predictive variance σ2t+1 tends to zero as the learning progresses, thus we have that the two KL-divergences converge. It would be an interesting question to identify the exact differences between the two KL-divergences and try to interpret the distances accordingly. A straightforward exploration would be to relate the KL-divergence to the Fisher information matrix [Mardia et al. 1979; Cover and Thomas 1991], which is well studied for the case of multivariate Gaussians2 , hopefully a future research direction toward refining the online learning algorithm (see Section. 3.8.1). Fixing the process GP 2 , and imposing a constrained form to GP 1 will lead to the sparsity in the
family of GPs, presented next.
3.3
KL-optimal projection
We next introduce sparsity by assuming that the GP is a result of some arbitrary learning algorithm, not necessarily online learning. This implies that at time t + 1 we have a set of basis vectors for the GP and the parameters α t+1 and C t+1 . For simplicity we will also assume that there are t + 1 elements in the BV set (its size is not important). We are looking for the “closest” GP with parameters ^ t+1 ) and with a reduced BV set where the last element x t+1 has been removed. Removing (^ α t+1 , C
the last BV means imposing the constraints α ^ t+1 (t + 1) = 0 for the parameters of the mean and ^ Ct+1 (t + 1, j) = 0 for all j = 1, . . . , N for the kernel. Due to symmetry, the constraints imposed on the last column involve the zeroing of the last row, thus the feature vector φt+1 will not be used in the representation. We solve a constrained optimisation problem, where the function to optimise is the KL-divergence between the original and the constrained GP (3.15): ´−1 ³ c t+1 kGP t+1 ) = (α αt+1 − α αt+1 − α ^ t+1 ) ^ t+1 ) C t+1 + K −1 (α 2KL(GP t+1 ¯ h i ´³ ´−1 ¯¯ ¯³ −1 −1 −1 ¯ ¯ ^ t+1 − C t+1 )(C ^ Ct+1 + K −1 ) + tr (C − ln C + K C + K t+1 t+1 t+1 t+1 ¯ t+1 ¯
(3.17)
The choice for the KL-divergence here is a pragmatic one: using the KL-measure and differentiating c we want to obtain an analytically tractable model. Using with respect to the parameters of GP, c t+1 ) does not lead to a simple solution. KL(GP t+1 kGP 2 I acknowledge D. Saad for pointing it out. It turns out however, by studying the KL-distance between the original and a slightly perturbed density function, that the KL-distance only relates to the diagonal elements of the Fisher information matrix, this in fact is an exercise[Cover and Thomas 1991, page 334].
42
Chapter 3. Sparsity in Gaussian Processes
αt+1
Q t+1
Ct+1
1 .. t
α
(r)
C
C*
Q
Q*
t+1
α*
C*
c*
Q*
q*
t+1
1 .. t
t+1
(r)
1 .. t
(r)
Figure 3.3: Grouping of the GP parameters for the KL-pruning in eqs. (3.19) and (3.21) In the following we will use the notation Q = K −1 for the inverse Gram matrix. Differentiating eq. (3.17) with respect to all nonzero values α ^ i , i = 1, . . . , t and writing the resulting equations in a vectorial form leads to h It
0t
´−1 µh i³ K −1 + C It t+1 t+1
0t
iT
^ t+1 − α t+1 α
= 0t
(3.18)
where I t is the identity matrix and 0 t is the column vector of length t with zero elements and [IIt0 t ] denotes a projection that keeps only the first t rows of the t + 1-dimensional vector to which it is applied. Solving eq. (3.18) leads to updates for the mean parameters as ^ t+1 = α (r) − α
α∗ Q∗ + C ∗ ) (Q c∗ + q∗
(3.19)
where the elements of the updates are shown in Fig 3.3. Differentiation with respect to the matrix ^ t+1 leads to the equation C ³ ´−1 h ^ t+1 + Q t C − It
h i Qt+1 + C t+1 )−1 I t 0 (Q
iT 0 = 0t
(3.20)
^ t+1 has only t rows and columns and the matrix [IIt0 t ] used twice trims the matrix to the where C first t rows and columns. The result is again expressed as a function of the decomposed parameters from Fig 3.3 as T
∗ ∗T Q∗ + C ∗ ) (Q Q∗ + C ∗ ) ^ t+1 = C(r) + Q Q − (Q C q∗ q∗ + c∗
(3.21)
A reduction of the kernel Gram matrix is also possible using the quantities from Fig 3.3: ∗ ∗T ^ t+1 = Q (r) − Q Q Q q∗
(3.22)
This follows immediately from the analysis of the iterative update of the inverse kernel Gram matrix Q t+1 in eq. (3.5). The deductions use the matrix inversion lemma eq. (A.2) for Q t+1 = K −1 t+1 and C + Q )−1 , the details are deferred to Appendix D. (C An important observation regarding the updates for the mean and the covariance parameters is that we can remove any of the elements of the set by permuting the order of the BV set and then
removing the last element from the BV set. For this we only need to read off the scalar, vector, and matrix quantities from the GP parameters.
Notice also the benefit of adding the inverse Gram matrix as a “parameter” and updating it when adding (eq. 3.5) or removing (eq. 3.22) an input from the BV set: the updates have a simpler form 43
Chapter 3. Sparsity in Gaussian Processes and the computation of scores is computationally cheap. The propagation of the inverse kernel Gram matrix makes the computations less expensive; there is no need to perform matrix inversions. In experiments one could also use instead of the inverse Gram matrix Q its Cholesky decomposition, discussed in Appendix C.2. This reduces the size of the algorithm and keeps the inverse Gram matrix positive definite. Being able to remove any of the basis vectors, independently of the order or the particular training algorithm used, the next logical step is to measure the effect of the removal, as presented next.
3.4
Measuring the error
αt+1 , C t+1 ) A natural choice for measuring the error is the KL-distance between the two GPs, GP(α c ^ and GP(^ α t+1 , C t+1 ). This loss is related to the last element, but the remarks from the previous section regarding the permutability imply that we can compute this quantity for any element of the
BV set. This is thus a measure of “importance” of a single element in the context of the GP, it will be called score, and denoted by εt+1 (t + 1) where the subscript refers to the time.
Computing the score is rather laborious and the deductions have been moved into Appendix D. Using the decomposition of the parameters as given in Fig. 3.3, the KL-distance between GP t+1 and c t+1 using (^ ^ t+1 ) is expressed as its projection GP α t+1 , C c t+1 kGP t+1 ) = εt+1 (t + 1) = 2KL(GP
¶ µ s∗ c∗ α∗2 − + ln 1 + ∗ q∗ + c∗ q∗ q
(3.23)
where s∗ , similarly to c∗ and q∗ , is the last diagonal element of the matrix −1 C−1 S t+1 = (C . t+1 + K t+1 )
A first observation we make is that, by replacing q∗ with γ−1 t+1 , we have the expected zero score if γt+1 = 0, agreeing with the geometric picture from Fig. 3.1 and showing that the GPs before and after removing the respective elements are the same. A second important remark is that the KL-distance between the original and the constrained GP is expressed solely using scalar quantities. The exact KL-distance is computable at the expense of an additional matrix that scales with the BV set, and the computation of this matrix requires an inversion. Given S t+1 we can compute the score for any element of the BV set and for the i-th BV we have the score as
¶ µ α2 (i) s(i) c(i) εt+1 (i) = − + ln 1 + q(i) + c(i) q(i) q(i)
(3.24)
where q(i), c(i), and s(i) are the i-th diagonal elements of the respective matrices. Thus, with an additional inversion of a matrix with the size of the the BV set we can compute the exact scores
εt+1 (i) for all elements, i.e. the loss it would cause to remove the respective input from the GP representation. The scores in eq. (3.24) contain two distinct terms. A first term containing the parameters αt+1 (i) of the posterior mean comes from the first term of the KL-divergence eq. (3.15). The subsequent two terms incorporate the changes in the variance. Computing the mean term does not involve any matrix computation, meaning that in the implementations the computation is linear with respect to the BV set size.
In contrast, when computing the second component, we need to store the matrix S t+1 , and although we have a sequential update for S t+1 , which is quadratic in computational time (given in Section D.2),
44
Chapter 3. Sparsity in Gaussian Processes it adds further complexity and computational time if we want to remove an existing BV from the set.
Particularly simple is the update of St+1 if we add a new element: " # St 0t S t+1 = T 0 t a−1
(3.25)
xt+1 , x t+1 ) + k Tt+1C tk t+1 is the variance of the marginal where a = (r(t+1) )−1 + σ2t+1 and σ2t+1 = K0 (x of GP t+1 at x t+1 . This expression is further simplified if we consider the regression task without
the sparsity where we know the resulting GP: by substituting C t+1 = −(σ20I t+1 + K t+1 )−1 we have
St+1 = It+1 /σ20 and as a result st+1 (i) = 1/σ20 . The simple form for the regression is only if the sparsity is not used, otherwise the projections result into non-diagonal terms. In this case, using again the fact that, as learning progresses, σ2i /rightarrow0 and accordingly ci ≈ 1/sigma20 . This
means that the second and third terms in eq. (3.23) cancel if we use a Taylor expansion for the logarithm. This justifies the approximation introduced next. In what follows we will use the approximation to the true KL-distance made by ignoring the covariance-term, leading to εt+1 (i) =
α2 (i) q(i) + c(i)
(3.26)
Observe that this is similar to the heuristic scores for the BV s from eq. (3.6) proposed in Section 3.1,
the main difference being that in this case the uncertainty is also taken into account by including c(i).
If we further simplify eq. (3.26) by ignoring c(i) then the score of the i-th BV is the quadratic
error made when optimising the distance
kαi φi −
X j6=i
βj φj k2
(3.27)
with respect to βj . Ignoring ci is equivalent to assuming that C 1 = C 2 = 0 , i.e. the posterior covariance is the same as the prior. In that case, since there are no additional terms in the KLdistance, the distance is exact. The projection minimising eq. (3.27) was also studied by Sch¨olkopf et al. [1999]. Instead of computing the inverse Gram matrix Q t+1 , they proposed an approximation to the score of the BV
using the eigen-decomposition of the Gram matrix. The score eq. (3.26) is the exact minimum with the same overall computing requirement: in this case we need the inverse of the Gram matrix with cubic computation time. The same scaling is necessary for computing the eigenvectors in [Sch¨olkopf et al. 1999]. The score in eq. (3.26) is used in the sparse algorithm to decide upon the removal of a specific BV .
This might lead to a the removal of a BV that is not minimal. To see how frequent this omission of the “least important BV ” occurs, we compare the true KL-error from eq. (3.24) with the approximated one from eq. (3.26).
We consider the case of GPs for Gaussian regression applied to the Friedman data set #1 [Friedman 1991]. We are interested in typical omission frequencies using different scenarios for online GP training, results summarised in Fig. 3.4. For each case we plotted the omission percentages based on 500 independent repetitions and for different training set sizes, represented on the X-axis. First we obtained the omission rate when no sparsity was used for training: all inputs were included in the BV set, and we measure the scores only at the end of the training, thus we have the same number
of trials independent of the size of the training. The average omission rate is plotted in Fig. 3.4.a. It shows that the rate increases with the size of the data set, i.e. with the size of the BV set. 45
Chapter 3. Sparsity in Gaussian Processes 60
40 90% retained 50 BV
35
50
30
% of omission
% of omission
40
30
20
25 20 15 10
10
0
5 0 20
40
60
80
100 120 140 Training set size
160
180
200
(a)
20
40
60
80 100 120 140 160 180 200 Training set size
(b)
Figure 3.4: Omission rates caused by the simplified BV score, eq. (3.26) when applied to the Friedman #1 data. Subfigure (a) shows the omission at the end of a sequence of full training, while in subfigure (b) we plotted the errors made when the BV set size was set to 90% of the training set (full bars) and to 50, irrespective of the size of the training set (empty bars). Note that the range of the Y-axis differs in the two sub-plots. In a second experiment we set the maximal BV set size to 90% of the training data, meaning that
10% of the inputs were deleted by the algorithm before we are testing the omission rate. This is done,
again, only once for each independent trial. The result is plotted with full bars in Fig 3.4.b and it shows a trend increasing with the size of the training data, but eventually stabilising for training sets over 120. The empty bars on the same plot show the case when the BV set size is kept fixed at 50 for all training set sizes. In this case the omission rate decreases dramatically with the size of the
training data, on the right extremity of Fig. 3.4 this percentage being practically zero. This last result justifies again the simplification we made by choosing eq. (3.26) to measure the “importance” of BV
set elements. The experiments from Chapter 5 have used the approximation to the KL-distance from eq. (3.26). We again emphasise that in the sparse GP framework, although the starting point was the online
learning algorithm, we did not assume anything about the way the solution is obtained. Thus, it is applicable in conjunction with arbitrary learning algorithm, we will present an application to the batch case in Chapter 4. An interesting application is that of a sparse online update: assuming that the new data is neglected from the BV set, how should we update the GP such that we not to change the BV set and at the same time include the maximal information about the input. In the next section we deduce the online
update rule that does not keep the input data and Section 3.6 will present the proposed algorithm for sparse GP learning.
3.5
Sparse online updates
In this section we combine the online learning rules from Chapter 2 with the sparsity based on the KL-optimal projection. This leads to a learning rule that keeps the size of the GP parameters fixed and at the same time includes a maximal amount of information contained in the example. We are doing this by concatenating two steps: the online update that increases the BV set size and the
46
Chapter 3. Sparsity in Gaussian Processes back-projection of the resulting GP to one that uses only the first t inputs. Having the new input, the online updates add one more element to the BV set and the correspond-
ing variables are updated as
α t+1 = α t + q(t+1)s t+1 C t+1 = C t + r(t+1)s t+1s Tt+1 s t+1 = C tk t+1 + e t+1 et+1 − e^t+1 ) (eet+1 − e^t+1 )T Q t+1 = Q t + γ−1 t+1 (e where we included the updates for the inverse Gram matrix. It was mentioned in Chapter 2 that the nonzero values at the t + 1-th elements of the mean and covariance parameters are due to the t + 1-th unit vector e t+1 . Using this observation, and comparing the updates with the decomposition of the −1 updated GP elements from Fig. 3.3, we have α∗ = q(t+1) , c∗ = r(t+1) , and q∗ = γt+1 . Similarly we
identify the other elements of Fig. 3.3: α (r) = α t + q(t+1)C tk t+1 C (r) = C t + r(t+1)C tk T +1k t+1C t C ∗ = r(t+1)C tk t+1 Q (r) = Q t + q∗Q tk t+1k Tt+1Q t Q ∗ = −q∗Q tk t+1 and substituting back into the pruning equations (3.19) and (3.21) we have q∗ s t+1 + r(t+1) q∗ s t+1s Tt+1 = C t + r(t+1) ∗ q + r(t+1)
^ t+1 = α t + q(t+1) α ^ t+1 C
q∗
(3.28)
s t+1 = C tk t+1 + Q tk t+1 ∗ where q∗ is the last diagonal element of the inverse Gram matrix Q t+1 , q∗ = γ−1 t+1 = (k −
k Tt+1Q tk t+1 )−1 . If we use ηt+1 = q∗ /(q∗ + r(t+1) ) = (1 + γt+1 r(t+1) )−1 and observe that Q tk t+1 = e^t+1 is the projection of the new data into the subspace spanned by the first t basis vectors, then we rewrite eq. (3.28) as ^ t+1 = α t + q(t+1) ηt+1s^t+1 α ^ t+1 = C t + r(t+1) ηt+1s^t+1s^Tt+1 C
(3.29)
s^t+1 = C tk t+1 + e^t+1 The scalar ηt+1 can be interpreted as a (re)scaling of the term s^t+1 to compensate for the removal of the last input. This term again disappears if γt+1 = 0, ie. there is nothing to compensate for, and the learning rule is the same with the one described in Section 3.1.
3.6
A sparse GP algorithm
The proposed online GP algorithm is an iterative improvement of the online learning that assumes an upper limit for the BV set. We start with an empty set and zero values for the parameters α and C .
47
Chapter 3. Sparsity in Gaussian Processes We set the maximal size of the BV set to d and the prior kernel to K0 . A tolerance parameter ǫtol is also used to prevent the Gram matrix from becoming singular (used in step 2). For each element (yt+1 , x t+1 ) the algorithm iterates the following steps: 1. Compute q(t+1) , r(t+1) , the update coefficients for the new data; the scalar products k∗t+1 and k t+1 ; the projection coordinates e^t+1 and the length of the residual γt+1 . 2. If γt+1 < ǫtol then perform the sparse update using eq. (3.29) without extending the size of the parameter set, i.e. the dimension of α and C . (we choose to threshold γt+1 to ensure a good numerical conditioning of the Gram matrix, this way increasing its robustness). Advance to the next data. 3. (else) Perform the update eq. (2.46) using the unit vector e t+1 . Add the current example point to the BV set and compute the inverse of the extended Gram matrix using eq. (3.5). 4. If the size of the BV set is larger than d, then compute the scores εi for all BV s from eq. (3.24), find the basis vector with the minimum score and delete it from the BV set using
eqs. (3.19), (3.21) and (3.22).
The computational time for a single step is quadratic in d, the upper limit for the BV set. Having
an iteration for each data, the computational time is O(Nd2 ). This is a significant improvement from
the O(N3 ) scaling of the non-sparse GP algorithms.
A computational speedup is to measure the score of the BV set elements and the new data before
performing the actual parameter updates. Since we add a single element, the operations required to compute the scores are not as costly as the GP updates themselves. If the smallest score belongs to the new input then we can perform the sparse update eqs. (3.29), saving a significant amount of time. A further numerical improvement can be made by storing the Cholesky decomposition of the inverse Gram matrix and performing the update and removal operations on the Cholesky decomposition instead of the inverse Gram matrix itself (details can be found in Appendix C.2).
3.6.1
Using a predefined BV set
A speedup of the algorithm is possible if we know the BV set in advance: there might be situations
where the BV set is given, e.g rectangular grid. To implement this we rewrite the prior GP using
the given BV set and a set of GP parameters with all zero elements: α BV = 0 and C BV = 0 . We
then compute the inverse Gram matrix in advance and if it is not invertible than we reduce its size
by removing the elements having zero distance γ, an argument discussed at the beginning of this chapter. At each training step we only need to perform the sparse learning update rule: to compute the required parameters for the sparse update of eq. (3.29) and then to update the parameters. Testing this simplified algorithm was not done. Since fixing the BV set means fixing the dimension of the data manifold into which we project our data, an interesting question is the resemblance to
Kalman Filtering (KF) [Bottou 1998]. The KF techniques, originally from [Kalman 1960; Kalman and Bucy 1961], are characterised by approximating the Hessian (i.e. the inverse covariance if using Gaussian pdfs), together with the values of the parameters. The approximate Hessian provides a faster convergence of the algorithm possibility to estimate the posterior uncertainty. The online algorithm for GPs is within the family of Kalman algorithms, it is an extension to the linear filtering by exploiting the convenient GP parametrisation from Chapter 2. For Gaussian regression the two approaches are
48
Chapter 3. Sparsity in Gaussian Processes the same. However, the extension to the non-standard noise- and likelihood models is different from the Extended Kalman filtering (EKF) [Gelb et al. 1974; de Freitas et al. 1998]. In EKF the nonlinear model is linearised using a Taylor expansion around the current parameter estimates. In applying the online learning we also compute derivatives, however, the derivative is from the logarithm of the averaged likelihood [Opper 1998] instead of the log-likelihood (EKF case). The averaging makes the general online learning more robust, we can treat non-differentiable and non-smooth models, an example is the noiseless classification, presented in Chapter 5.
3.7
Comparison with other sparse kernel techniques
In this section we compare the sparse approximation from Section 3.3 with other existing methods of dimensionality reduction developed for kernel methods. Most approaches to sparse solutions were developed for the non-probabilistic (and non-Bayesian) case. The aim of these methods is to have an efficient representation of the MAP solution, reducing the number of terms in the representer theorem of Kimeldorf and Wahba [1971]. In contrast, the approach in this chapter is a probabilistic treatment of the approximate GP inference, ie. we consider the efficient representability not only of the MAP solution but also of the propagated covariance function. A first successful algorithm that lead to sparsity within the family of the kernel methods was the Support Vector Machine (SVM) for the classification task [Vapnik 1995]. This algorithm has gained since a large popularity and we are not going to discuss it in detail, instead the reader is referred to available tutorials, eg. Burges [1998] or in Sch¨olkopf et al. [1999].3 The SVM algorithm finds the separating hyperplane in the feature space F . Due to the Kimeldorf-Wahba representer theorem we can express the separating hyperplane using the inputs to the algorithm. Since generally the
separating hyperplane is not unique, in the SVM case further constraints are imposed: the hyperplane should be such that the separation is done with the largest possible margin. Furthermore, the cost function for the SVM classification is non-differentiable, it is the L1 norm of yi − w T x i for the noiseless case [Vapnik 1995]. This non-differentiable energy function translates into a inequality constraints over the parameters α and these inequalities lead in turn to sparsity in the vector α . The sparsity appears thus only as an indirect consequence of the formulation of the problem, there is no control over the “degree of sparseness” we want to achieve. An other drawback missing from the SVM formulation is the lack of the probabilities: given a prediction can anything be said about the degree of uncertainty associated with it. There were several attempts to obtain probabilistic SVMs, eg. Platt [1999b] associated the magnitude of output (in SVM only the sign is taken for prediction) with the certainty level. A probabilistic interpretation of the SVM is presented by Sollich [1999]: it is shown that, by introducing an extra hyperparameter interpreted as the prior variance of the bias term b in SVM, there exist a Bayesian formulation whose maximum a-posteriori solution leads us back to the “classical” support vector machines. A Bayesian probabilistic treatment in the framework of kernels is also considered by Tipping [2000]. x) in The starting point of its “Relevance Vector Machine” is the extension of the latent function y(x terms of the kernel x) = y(x
X
xi , x ) αi K0 (x
i
3A
dedicated internet page is at: www.kernel-machines.org containing tutorials for the SVM.
49
Chapter 3. Sparsity in Gaussian Processes but in this case the coefficients αi are random quantities: each has a normal distribution with a given mean and covariance. The estimation of the parameters αi is transformed thus to the estimation of the model hyper-parameters consisting of the mean and variance if the distributions. This is done with an ML-II parameter estimation and the outcome of this iterative procedure is that many of the distributions have a diverging variance, effectively eliminating the corresponding coefficient from the model. The solution is expressible thus in terms of a small subset of the training data, as in the SVM case. We see thus that for the SVM and RVM case one arrives to sparsity from the definition of the cost function or the model itself. The sparseness in this chapter is of a different nature: we impose constraints on the models themselves and treat arbitrary likelihoods. Three related methods are presented next: the first is the reduction of dimensions using the eigen-decomposition of covariances. The second is the family of the pursuit algorithms that consider the iterative approximation of the model based on a pre-defined dictionary of functions. The last method is related with the original SVM, the Relevance Vector Machines of Tipping [2000]. Before going into details of specified methods, we mention an other interesting approach to dimensionality reduction: using sampling from mixtures [Rasmussen and Ghahramani 2002]. An infinite mixture of GPs is considered, each GP having an gating network associated. The gating network selects the active GP by which the data will be learnt. It serves as a “distributor” of resources when making inference. Although there are possibly an infinite number of GPs that might contribute to the output, in practise the data is allocated to the few different GP experts, easing the problem of inverting a large kernel matrix, technique similar to the block-diagonalisation method of Tresp [2000].
3.7.1
Dimensionality reduction using eigen-decompositions
An established method for reducing the dimension of the data is principal components analysis (PCA) [Jolliffe 1986]. Since the PCA is also extended to the kernel framework, it is sketched here. It considers the covariance of the data and decomposes it into orthogonal components. If the covariance matrix is C and u i is the set of orthonormal eigenvectors then the covariance matrix is written as C=
d X
u i λiu Ti
(3.30)
i=1
where d is the dimension of the data and furthermore λi is the eigenvalue corresponding to the eigenvector u i . The eigenvalues λi of the positive (semi)definite covariance matrix are positive and we can sort them in descending order. The dimensionality reduction is the projection of the data into the subspace spanned by the first k eigenvectors. The motivation behind the projection is that the small eigenvalues and their corresponding directions are treated as noise. Consequently, projecting the data to the span of the eigenvectors corresponding to the largest k eigenvalues will reduce the noise in the inputs. The kernel extension of the idea of reducing the noise via PCA was studied by Zhu et al. [1997] (see also [Trecate et al. 1999]). They studied the eigenfunction-eigenvalue equation for the kernel operator:
Z
xp(x x) K0 (x x, x ′ )ui (x x) = λi ui (x x ′) dx
(3.31)
Since the kernel is positive definite, there are a countable number of eigenfunctions and associated positive eigenvalues. To find the solutions, Zhu et al. [1997] needed to know the densities of the
50
Chapter 3. Sparsity in Gaussian Processes input in advance. The kernel operator can then be written as a finite or infinite sum of weighted eigenfunctions similarly to eq. (3.30) (eq. (2.6) from Section 1.2): x, x ′ ) = K0 (x
X
x)ui (x x ′) λi ui (x
(3.32)
i
and the solution is specific to the assumed input density, the reason why we did not use the notation x) from Section 1.2. Arranging the eigenvalues in a descending order and trimming the sum in φ(x eq. (3.32) leads to an optimal finite-dimensional feature space. The new kernel can then be used in any kernel method where the input density has the given form. The “projection” using the eigenfunctions in this case does not lead directly to a sparse representation in the input space. The resulting kernel however is finite-dimensional. We have from the parametrisation lemma that the size of the BV set never has to be larger than the dimension of the feature space induced by the kernel. As a consequence,
if we are using the modified kernel with the sparsity criterion developed, the upper limit for the number of BV s set to the truncation of the eq. (3.32). The input density is seldom known in advance thus building the optimal finite-dimensional kernel is generally not possible. A solution was to replace the input distribution by the empirical distribution of the data, discussed next. The argument of noise reduction was used in kernel PCA (KPCA) [Sch¨olkopf et al. 1998] to obtain the nonlinear principal components of the data. Instead of the analytical form of the input distribution, P xj ) was used in the eigenfunction equation (3.31) leading x) ∝ j δ(x the empirical distribution pemp (x
to
N
1 X xj , x ′ )ui (x xj ) = λi ui (x x ′ ). K0 (x N
(3.33)
j=1
The eigenfunctions corresponding to nonzero eigenvalues can be extended using the bi-variate kernel P x) = j βij K0 (x xj , x ). We can again use the feature functions at the locations of the data points ui (x
x, x ′ ) = hφx , φx ′ i. Further we can use ui (x x) = hφx , u i i where u i is an element space notation K0 (x
from the feature space F , having the form from eq. (3.34). The replacement of the input distribution with the empirical one is equivalent to computing the empirical covariance of the data in the feature P 1 T 4 space C emp = N Equivalently to the problem of eigenfunctions using the empirical i φx i φx i . density function, the principal components of the feature space matrix C corresponding to nonzero eigenvalues are all in the linear span of {φ1 , . . . , φN } and can be expressed as ui =
N X
βij φj
(3.34)
j=1
with β i = [βi1 , . . . , βiN ]T the coordinates of the i-th principal component. The projection of the feature space images of the data into the subspace spanned by the first k eigenvectors lead to a “nonlinear noise reduction”. The dimensionality reduction arising from considering the first k eigenvalues from the KPCA is applied to the kernelised solution provided by the representer theorem. The inputs x are projected to the subspace of the first k principal components x) ≈ φ(x 4 The
k X
x)T u i )u ui (φ(x
i=1
data in the feature space are considered as having zero mean. Subtracting the mean would not lead to conceptual difference, it has been ignored for clarity.
51
Chapter 3. Sparsity in Gaussian Processes x)T u i is the coefficient corresponding to the i-th eigenvector. The method, when applied to a where φ(x subset of size 3000 of the USPS handwritten digit classification problem, showed no performance loss after removing about 40% of the support vectors [Sch¨olkopf et al. 1999]. A drawback of this method is that although the first k eigenvectors define a subspace of a smaller dimension than the subspace spanned by all data, to describe the components the whole dataset is still needed in the representation of the eigenvectors in the feature space. A similar approach to KPCA is the Nystr¨om approximation for kernel matrices applied to kernel methods by Williams and Seeger [2001]. In the Nystr¨om method a set of reference points is assumed, similarly to the subspace algorithm from [Wahba 1990]. The true density function of the inputs in the eigenvalue equation for the kernel, eq. (3.31), is approximated with the empirical density based on P x1 , . . . , x m }: pemp ∝ m xi ), similarly to the empirical eigen-system eq. (3.33), the subset Sm = {x j=1 δ(x
except that Sm is a subset of the inputs. This leads to the system m
1 X xj , x ′ )φi (x xj ) = λi φi (x x ′) K0 (x m
(3.35)
j=1
and the resulting equations are the same as ones from the kernel PCA [Sch¨olkopf et al. 1998]. The authors then use the first p eigenfunctions obtained by solving eq. (3.35) to approximate the eigenvalues of the full empirical eigen-system from eq. (3.33). If we consider all eigenvectors of the reduced eqs. (3.35), then the approximated kernel matrix is:5 e N = K NmK −1 K mN K mm
(3.36)
and this identity used in conjunction with the matrix inversion lemma eq. (A.1) leads to a reduction of the time required to perform the inversion of the kernel Gram matrix K N to a linear scale with the size of the data. An efficient approximation to the full Bayesian posterior for the regression case is straightforward. For classification more approximations are needed, and the Laplace approximation for GPs [Williams and Barber 1998] was implemented leading to iterative solutions to the MAP approximation to the posterior. Lastly we mention the recent sparse extension of the probabilistic PCA (PPCA) [Tipping and Bishop 1999] to the kernel framework by Tipping [2001b]. It extends the usual PPCA using the observation that the principal components are expressed using the input data. He considers the parametrisation for the feature-space covariance as Σ = σ2 I + Φ W Φ T
(3.37)
with Φ the concatenation of the feature vectors for all data and W a diagonal matrix with the size of the data, this is a simplification of the representation of the covariance matrix in the feature space from Section 2.3.1, eq. (2.37) using a diagonal matrix instead of the full parametrisation with respect to the input points. The multiplicative σ2 from eq. (3.37) can be viewed as compensation for the ignored elements. In the framework of [Tipping 2001b] the value for σ2 is fixed and the sparseness is obtained as a consequence of optimising the KL-divergence between two zero-mean Gaussians in the feature PN space. One of them with the empirical covariance i=1 φi φTi and the other having the parametrised form of eq. (3.37). The Gaussian distributions are considered in the feature space, meaning that the matrices are of possibly infinite dimensionality. As usual, the KL-distance can still be expressed with 5 There might be no exact inverse for K mm , this is solved by adding a “jitter” factor to the diagonal elements in the original kernel matrix making sure it is positive definite.
52
Chapter 3. Sparsity in Gaussian Processes the kernel function and the parameters W . The computation of the KL-divergence for the zero-mean Gaussian distributions is derived in Section 3.2 and the result for zero-means is in eq.(3.14). Choosing different values for σ2 will lead to different levels of sparsity. On the top of sparsity, the diagonal matrix is a significant reduction in the number of parameters. The drawback of this method is that it requires an iterative solution for finding the diagonal matrix W . The iterations require the kernel matrix with respect to all data. The efficient representation is an important issue in the family of kernel methods, thus the diagonalisation of the covariance parameter might lead to significant increase in the speed of the GP algorithms. We discussed the diagonalisation of matrix C in conjunction with the online learning rule in Appendix E. It leads to a system that, unlike the simple update rules from eq. (2.46) using a full matrix to parametrise the covariance in the feature space, cannot be solved exactly, instead we are required to develop an iterative procedure to find the new diagonal matrix C t+1 given the GP parameters from time t and the new data. In addition to the possible iterations each time a new data is included, the system requires the manipulation of a full matrix to obtain C t+1 . It turns out that there are no exact updates and we have to use a second, embedded loop for getting the solution which renders the approach extremely difficult computationally. The conclusion is that the diagonalisation is not feasible if used within the framework of the online learning. Additionally, it would be interesting to test the loss caused by diagonalising the sparse GP solution find by the sparse online algorithm presented in this chapter.
3.7.2
Subspace methods
Based on the kernel-PCA decomposition of the kernel matrix, first we mention the “reduced set” method was developed by [Sch¨olkopf et al. 1999]. The full SVM solution is sparsified by removing a single element or a group of elements. The updates and the loss are computed when removing a single element or a group (the loss is similar to the simplified KL-divergence of eq. (3.26), more discussions there). A generic “subspace” algorithm for the family of kernel methods was proposed by Wahba [1990, Chapter 7]. The projection into the subset is implemented with the set of basis elements fixed in advance, the projection is made exploiting the linearity of the feature space (as presented in Section 3.1) and it is applied to the MAP solution of the problem. The reduced approximation for the kernel matrix as shown in eq. (3.36) has also been used for regression [Smola and Sch¨olkopf 2000; Smola and Sch¨olkopf 2001]. They also address the question of choosing the m-dimensional subset of the data in detail. The selection criterion is based on the examination of each input contributing to the kernel matrix and an approximation of the error made by not including the specific column. In a sequential algorithm the most important columns (and rows) are included into the basis set. Our sparse GP approximation uses the same philosophy of examining the “score” of the individual inputs iterative addition (section 3.4). Instead of concentrating to the MAP solutions, as it is done in the methods sketched, a full probabilistic treatment is considered in this thesis.
3.7.3
Pursuit algorithms
The sparse greedy Gaussian process regression, as shown in [Smola and Sch¨olkopf 2000], is similar to a family of established pursuit methods: projection pursuit [Huber 1985] and basis pursuit [Chen
53
Chapter 3. Sparsity in Gaussian Processes 1995; Chen et al. 1995]. The pursuit algorithms consider a set of functions, this set is usually called a dictionary. The assumption is that using all elements from the dictionary is not feasible: there might be infinitely many elements in the dictionary. An other situation is when the dictionary is over-complete, i.e. a function has more then one representation using this dictionary. The task is then to choose a subset of functions that give good solutions to the problem. The solution is given in the form of a linear combination of elements from the dictionary, and the optimal parameters given the selected functions are found similarly to the generalised linear models, presented in Chapter 1. Considering problem of choosing the optimal subset from a dictionary, in the kernel methods we use the data both as the training examples to the algorithm (data in a conventional sense) but at the same time, due to the representer theorem, the dictionary of the available functions is also specified by the same data set. This is the case both for the non-probabilistic solution, given by the representer theorem and for the representation of the GPs, result given in Chapter 2. The efficient construction of a subset in the kernel methods is thus equivalent with the sparse representation, the topic of this chapter. The pursuit literature deals with the selection of basis from a non-probabilistic viewpoint, here we consider a fully probabilistic treatment of selecting the dictionary. In [Vincent and Bengio 2000] the pursuit algorithms is combined with the kernel methods in their work: “Kernel matching pursuit”. They address the selection of the inputs – this time viewed as elements from a dictionary – and the optimal updates of the coefficients of the kernelised solutions to the problem. In the basic matching pursuit the individual elements from the dictionary are added one by one. Once a dictionary element is taken into the set representing the solutions, in the basic version of the pursuit algorithms, its weighting coefficient is not changed. This is suboptimal solution if we want to keep the size of the elements from the dictionary as small as possible. A proposed solution is the “orthogonal matching pursuit”, or “back-fitting” algorithm where the next dictionary elements is chosen by optimising in the whole subspace of the functions chosen so far. This implies recomputing the weights for each function already chosen in the previous steps. This can be derived using linear algebra [Vincent and Bengio 2000]. Looking at the online update eqs. (2.46) we see that the updates implemented correspond to the back-fitting approach. This optimal update in our case uses the second order information stored in the covariance matrix, or equivalently, the parameters C of the covariance. The scores (Section 3.4) when removing an element also chooses a subspace – thus is a restrictive solution – into which to project the solutions. The choice of the subspace is based on varying all parameters to find the projection. The parameter updates are optimal in the KL-sense and update all coefficients, similarly to the case of back-fitting for the kernel matching pursuit or the orthogonal matching pursuit [Pati et al. 1993]. The difference between the matching pursuit algorithms and the sparsity in GPs is the use of KL-based measures for the kernel family, implying a full probabilistic treatment. At the same time, using the online learning in conjunction with the sparsity presented here leads to a greedier algorithm than the pursuit algorithms, this is because in the iterative process of obtaining the solution only those inputs are considered that are in the sparse BV set, i.e. the dictionary. This leads to a removal of some inputs that might be relevant if all data would be considered when removing a BV .
54
Chapter 3. Sparsity in Gaussian Processes
3.8
Discussion
This chapter considered the optimal removal of a data point from the representation of a Gaussian process, where the optimality is measured using the KL-divergence. The KL-optimal projection that leads to sparseness, as it is defined in Section 3.3 does not depend on the algorithm used for obtaining the non-sparse solution. This is important, saying that the idea of “sparsifying solutions” is not restricted to the online learning alone. However, we found that the combination of sparsity with the online learning results in a robust algorithm with a non-increasing size of the parameter set. An important feature of the algorithm is that the basis vectors for representing the GP are selected during runtime from the data. This was possible due to the computationally cheap evaluation of the error made if current input was not included into, or a previous input was removed from the BV set.
It is important that the error, i.e. the score of an element from the BV set from eq. (3.24) and (3.26),
did not require the effective computation of the pruned GP, rather we were able to express it based
solely on the already available elements. This is similar to the leave-one-out error [Wahba et al. 1999] within the probabilistic framework of Gaussian processes. For real applications the sparsity combined with the online method has an additional benefit: the iterative computation of the inverse Gram prevents the set of basis vectors from being redundant: when the new input is in the linear span of the BV set, this vector is replaced by its representation using the previous vectors.
The benefit of the sparse GP algorithm is its inherent Bayesian probabilistic treatment of the inference. This allows an efficient approximation to the posterior kernel of the process which in turn leads to estimating the predictive variance. Thus we can quantify the quality of the prediction. The memory requirement of the reduced GP is quadratic in the size of the BV set. The possibility
for further reduction might be important. A further reduction of the parameters where the full matrix C was replaced with a diagonal one has been also examined (see Appendix E), similarly to the kernel extension of the probabilistic PCA algorithm (PPCA) [Tipping 2001b]. We found however that, as in the case of PPCA, there was no exact solution to the KL-optimal projection, instead of it, we are required to perform iterative EM-like optimisation. This severely affects the speed of the algorithm and was not pursued further. The algorithm also has a few shortcomings. First, it is a greedy algorithm: at a certain moment the pruning of the GPs only considers the inputs that were selected at previous times. The GP will thus possibly be biased toward the last elements: they may be over-represented. Another problem is that the solution depends on the ordering of the data that is arbitrary, a possible solution to this will be considered in the next chapter. The sparse online algorithm from Section 3.6 cannot do batch-like processing of the data by processing it multiple times. For large datasets this is not a problem, but for smaller data set sizes we might want to have a second sweep through the data. A solution to this is proposed in the next chapter by combining the sparse algorithm with the “expectation-propagation” algorithm, an extension of the online iterations from Chapter 2 to allow multiple iterations [Minka 2000]. We also did not consider the problem of outliers. These types of data seriously damage the performance of the algorithms. The Bayesian framework is less sensitive to the outliers in general. However, the removal of a BV implies that the resulting algorithm is just an approximation to the
true Bayesian solution. More important, in the sparse GP case the scores for the inputs are largest for
55
Chapter 3. Sparsity in Gaussian Processes outliers. To ensure a good performance for the sparse algorithm, we will probably need to pre-process the data by first removing the outliers.
3.8.1
Further research directions
It would be interesting to test the performance of the online learning algorithm if we allow an ordering of the data according to the possible gain of information from learning the specific data instance. For this we can use the KL-distance from eq. (3.16): ³ ´ 2KL(GP t+1 kGP t ) = (q(t+1) )2 + r(t+1) σ2t+1 − ln(1 + r(t+1) σ2t+1 )
and we see that for the computation of the KL-distance we do not need to do the update of the GP parameters. We can compute this quantity in O(Np2 ) time for all untrained data and let the “most
informative” data be processed first.
We could also extend the sparse GP learning algorithm to query learning. In query learning only a fraction of the total data is labelled and the labelling of the examples is costly. This might be the case in the chemical industry or pharmaceutics where there are high costs for each experiment to label the data. We want to improve thus our algorithm by learning the data which is the most informative given our assumptions about the model and the already labelled examples. This is an intensely researched area, called active- or query learning. Using tools from statistical physics and making specific assumptions, results for both classification [Seung et al. 1992] and regression [Sollich 1996], and extending it to non-parametric family is an interesting research topic. For classification, the symmetry of the cost or likelihood function is exploited. It is thus possible to compute the KL-divergence between the current GP and the one that would be obtained if a xl , yl ) were processed with only the knowledge that yl is binary. For this we see that the data (x KL-distance from eq. (3.16) for the classification case does not depend on the output label. Recent study for the Support Vector classification was made by Campbell et al. [2000] and they showed increased performance when applied to real dare. Testing this idea for the GPs and comparing with other methods of query learning is an interesting future project. It would be interesting to propose methods that do not rely (solely) on the KL-distance, but rather on increases in the generalisation ability of the system (as it was proposed in [Sollich 1996]).
56
Chapter 4 Sparsity and the Expectation-Propagation Algorithm Summary: Sparsity is applied to an iterative algorithm: the expectation-propagation (EP) algorithm. This allows multiple, batch-like processing of the data. We investigate the changes induced by the sparsity and build a fixed-point algorithm for sparse GP learning.
The sparse online GPs of the previous chapter (presented in Section 3.6) can process arbitrarily large datasets. This is possible by avoiding the increase of the GP parameter set using KL-projections to a constrained family of GPs. The drawback of the algorithm stems from its online nature: each example can be processed only once. Indeed, when using the same example in a second iteration there are artifacts caused by treating the already seen data point as independent from the model. This single iteration also means that the solution is dependent on the order of the presentation of the inputs, an unwanted result. If the size of the data is large, then it can be argued that the resulting GP becomes independent of the ordering, but the single processing is disadvantageous if we want to improve the GP when we have smaller datasets and enough computational power for multiple processing. Recently, an extension to the online learning was proposed by Minka [2000], named the expectationpropagation (EP) algorithm. This algorithm improves the result of the Bayes online learning by making possible additional processing of the examples. The algorithm stores the contribution of each example to the approximated posterior. At each online learning step, before processing a data likelihood, the contribution of that specific example is first “subtracted” from the approximated posterior. The result is a fixed-point iterative algorithm that repeatedly processes each single data likelihood and converges to a solution that is independent of the order the data is processed. The EP algorithm stops when there are no changes in the individual contributing terms for a full cycle through the data. It has been shown in Minka [2000] that the fixed point of the algorithm coincides with the fixed point of the TAP approximation, a statistical physics method that was applied to approximate the posteriors [Opper and Winther 2001], more details in Section 4.2. The EP algorithm was applied to GPs and it showed improvements over the single-sweep online learning Minka [2000]. The EP algorithm in its original form also suffers from the bad scaling of GPs, being of restricted use. In this chapter we combine the EP and the sparse online algorithm for the GPs. The EP algorithm is discussed in Section 4.1 and then applied to GPs in Section 4.2. The EP algorithm induces an alternative parametrisation to the posterior GP: it is written as the prior and a
57
Chapter 4. Sparsity and the Expectation-Propagation Algorithm product of conjugates of the posterior family, the contribution of the individual examples. The connection between the EP-parametrisation and the one based on the parametrisation lemma is presented in Section 4.3. The equivalence of the parametrisations provides the ground for extending the sparse projection method to the EP algorithm (Section 4.4). The algorithm is sketched in Section 4.6 and the chapter finishes with conclusions and discussions.
4.1
Expectation-Propagation
Expectation-propagation (EP) [Minka 2000] is based on the Bayesian online learning presented in Chapter 2 (also in [Gelman et al. 1995]). Since EP exploits and extends the iterations in the online learning, we first sketch online learning and then present the EP algorithm. Let us denote with θ ∈ Rm
θ). The prior over the parameters the set of model parameters. We want to infer their distribution q(θ
θ) and, as previously, we assume a factorising likelihood: is q0 (θ θ) = P(D|θ
N Y
(4.1)
yk , x k |θ θ) τk (y
k=1
x1 , y 1 ), . . . , (x xN , y N )} is the data set and τi (y yi , x i |θ θ) is the likelihood function. To simplify where {(x xk , y k ) will be suppressed from the likelihood function, being the notation, in the following the inputs (x encoded in its index. θ) the Bayesian posterior obtained from including all data points up to, and We denote by q(n) (θ including index n: (n) θ) qpost (θ
Q θ) n θ) q0 (θ k=1 τk (θ Qn =R θ θ θ) dθ q0 (θ ) k=1 τk (θ
(4.2)
and observe that we have a recursive relation:
(n−1) θ)qpost θ) τn (θ (θ
(n)
θ) = R qpost (θ
(n−1) θ τn (θ θ)qpost θ) dθ (θ
(4.3)
.
In Chapter 2 different approximation techniques to the intractable posterior have been presented (section 2.2.2) with the focus on online learning: eq. (2.41) [Opper 1998]. In Bayesian online learning (N)
θ) including all examples is obtained by a succession the approximation to the true posterior qpost (θ (n)
θ), an approximation to qpost (θ θ). of approximating steps to compute q ^ (n) (θ θ), the result from the previous online approxiThis is an iterative procedure where we use q ^ (n−1) (θ (n)
θ) instead of q(n−1) (θ θ). Since qpost mation. The posterior is found by applying eq. (4.3) with q ^ (n−1) (θ is also intractable, a second approximation step is used to obtain q ^ (n) . This is formally written as θ) ←− R q ^ n (θ
θ)^ θ) τn (θ qn−1 (θ θ τn (θ θ)^ θ) dθ qn−1 (θ
(4.4)
where the arrow specifies a projection of the intractable posterior to a tractable family of distributions. Performing the iterations for all data gives q ^ N which depends on the order of presentation. Unless new data arrives it is impossible to improve on the online result. The goal of expectation propagation is to apply further iterations of the updates for the posterior distribution, thus producing a better approximation than the result from online algorithm alone. To achieve this, we “unfold” q ^ (N) , the end-result of the online iterations, as θ) = q0 (θ θ) q ^ N (θ
N Y θ) q ^ n (θ . θ) q ^ n−1 (θ
n=1
58
(4.5)
Chapter 4. Sparsity and the Expectation-Propagation Algorithm The observation made by Minka [2000] is that each factor in the product corresponds to an approximation of the corresponding likelihood term, since that has been the basis of the update for q ^ (n) θ) = q θ)/^ θ) will be used and we will call this ratio as from eq. (4.4). In the following τ^n (θ ^ n (θ qn−1 (θ approximating likelihood. Using these notations, the Bayesian update is rewritten as a problem of estimating the individual θ) which give the approximate posterior distribution: factors τ^n (θ θ) = q0 (θ θ) q ^ N (θ
N Y
(4.6)
θ). τ^n (θ
n=1
The above relation is usable only if the prior distribution and the approximated posterior belong to the family of the exponential distributions [Bernardo and Smith 1994]. Then, since it is the ratio of θ) is conjugate two exponentials, the approximating likelihood is also in the exponential family: τ^i (θ to the prior. The approximating likelihoods used with the prior distribution lead to a tractable posterior, without the need for any approximation. Further we see the possible benefits of using the θ) are made locally, weighted by q θ). approximating likelihoods: the approximations to τi (θ ^ (n−1) (θ θ) using online learning, we first have to find the distribution q To improve on each term τ^k (θ ^ (k−1) = θ) independent of the likelihood τk (θ θ). This is done by removing τ^k (θ θ) from the posterior eq. (4.6). q ^ \k (θ This implies that we have to keep the approximated likelihoods for all data. The online learning used here was presented in Chapter 2. It minimises a KL-distance [Cover and Thomas 1991] by matching the moments of the true and the approximated posterior (see Section 2.2.2). θ) has already been seen, we need to remove its contribution τ^k (θ θ) from the current If an input τk (θ parameter estimate before using the online step from Section 2.4. This is done by “subtracting” it from the posterior and the online learning rule is performed with the adjusted prior: Q θ) \k θ) q0 (θ ^n (θ n τ θ) = R q ^ \k (θ Q\k θ q0 (θ θ) n τ^n (θ θ) dθ
(4.7)
where the second term on the right does not depend on θ , the parameter being integrated out. Using \k
θ), the posterior q θ) is: the modified prior q ^ k and the likelihood-term τk (θ ^ k (θ θ) ←− R q ^ new (θ k
θ) q θ) uk (θ ^ (θ θ uk (θ θ) q θ) dθ ^ (θ
with
θ) = uk (θ
θ) τk (θ θ) τ^k (θ
(4.8)
θ) appears both in the numerator and the denominator, its normalising constants are irreleSince τ^i (θ vant. This means that in the numerical implementation of the algorithm it will be enough to store the terms of the exponentials of θ . On the other hand, an exact computation of each normalising constant would be required if we want to approximate the evidence of the model, considered by [Minka 2000]. In this thesis the model selection issue is not addressed, however, it is a very important area of future research. The new τ^k is computed as θ) = τ^new (θ k
θ) q ^ new (θ k \k
q ^k
∝
θ) q ^ new (θ k θ) τ^k (θ θ) q ^ k (θ
(4.9)
In the EP iterations we choose – randomly or by using different heuristics – an index k and apply online learning for that example. The cycle terminates if there are no changes in the approximated θ). We do not have a guaranteed global convergence but the system usually finds a fixed likelihoods ^ti (θ point and this minimum point is independent of the order of inclusion of the individual likelihoods. θ) is shown in Fig. 4.1. The visualisation of the EP algorithm with the approximate likelihoods τ^i (θ θ) is the approximated Whilst in the usual online learning at the end of the N-th iterations q ^ N (θ
59
Chapter 4. Sparsity and the Expectation-Propagation Algorithm
t (x
,y1 ) 1
t(x p
0
p^
0110 ^ p
^t
ppost
N
,y N)
ppost
N−1
1
^t
1
^ p
N
P
1
Figure 4.1: Visualisation of the expectation propagation algorithm. The likelihoods are “projected” to the parametric family P, they can be interpreted as one-dimensional vectors. The final approximation is the result of combining the prior with the projection terms: graphically this is done by adding the line segments τ^i to the prior process p0 . posterior, in this case the online steps are used to improve on the approximation of the individual θ). The similarity of Fig. 4.1 with online learning as presented in “segments” τ^n that build up q ^ N (θ Fig. 2.2 illustrates that the EP algorithm is built on the online method. The underlying dynamics is different in the two cases: for online learning we have only the “path” toward the final approximation. In contrast, for the EP algorithm the emphasis is on building up the chain that links the prior with the posterior. If we take logarithms in eq. (4.6), then τ^i is the difference between two log-probabilities. Further, if we consider q ^ t+1 and q ^ t as points in the space of distributions, then τ^i is a one-dimensional line connecting the two distributions, as shown in Fig. 4.1. A first online sweep is used to initialise the individual terms τ^k . Alternatively the terms can be initialised with a constant value 1, having p0 = p ^ N in the beginning. To sum up, the EP extension of the online learning algorithm from Chapter 2 implies: • iterations over the individual data points until convergence, • the storage of the projected individual likelihood terms ^tk for each data, and θ) from the posterior before applying the online • “subtracting” the approximated likelihood τ^k (θ learning.
• terminating when the equilibrium is reached, that is when none of the approximated likelihoods changes.
The benefit of the EP algorithm is that it allows data processing beyond online learning, the extra cost, apart from the increased computational time, is the additional storage of the projected likelihood terms. The EP algorithm will be applied to GPs in the next section.
4.2
EP for Gaussian Processes
In the following the feature-space notation and the GP parametrisation from the parametrisation lemma 2.3.1 is used. Similarly to the intuition behind deducing the KL-divergences, the feature space formalism provides us with a more intuitive picture of the algorithm. The EP algorithm applied to
60
Chapter 4. Sparsity and the Expectation-Propagation Algorithm GP classification was presented in [Minka 2000, Chapter 5]. In this chapter we will leave the likelihood unspecified, the EP procedure being identical for other likelihoods also. x, x ′ ) and we consider the feature space F and the We assume that we are given the kernel K0 (x
scalar product generated by the kernel: if φx is the projection of the x into the unknown F, then we
x, x ′ ) = φxT φx ′ [Wahba 1990; Vapnik 1995]. Using the feature space, the GP is equivalent to have K0 (x
µ, Σ ), as shown in Chapter. 2, eq. (2.37). normal distribution for the parameter vector f in F : f ∼ N (µ µ, Σ ) is a normal distribution with mean and covariance given by: N (µ µ = µ0 +
N X
αi φi = Φα
i=1
Σ = IF +
N X
(4.10) T
φi Cij φj = IF + ΦCΦ
i,j=1 T
with α = [α1 , . . . , αN ] , C = {Cij }i,j=1,N the parameters of the GP and Φ = [φ1 , . . . , ΦN ]T is the concatenation of all feature vectors from the BV set and IF is the identity matrix in the feature space.
In the following we assume µ = 0 . At this point we also assume that the learning rules do not include sparsity and the set of basis vectors coincides with the input data, the sparse case being discussed later in Section 4.4. We use the “time” index t, and assume that τt+1 (ff) is a likelihood chosen from the data set. The online updates, assuming that τt+1 (ff) was not previously processed, are (eq. 2.43): µ t+1 = µ t + q(t+1)Σ t φt+1 Σ t+1 = Σ t + r(t+1)Σ t φt+1 φTt+1Σ t
(4.11)
. with φt+1 = φx t+1 and the scalars q(t+1) and r(t+1) given in eq. (2.42). We have to find the approximate likelihood ^tt+1 (ff), the ratio of the approximated posterior GPs at time t + 1 and t respectively. From the definition of ^tt+1 in eq. (4.6) we have: ^tt+1 =
µt+1 , Σ t+1 ) N (ff|µ µt , Σ t ) N (ff|µ (4.12)
¯ ¯ ¯ i° ¯ Σ t+1 ¯−1/2 1h T −1 T −1 ¯ ¯ µt − f ) µt+1 − f ) − (µ µt − f ) Σ t (µ µt+1 − f ) Σ t+1 (µ exp − (µ =¯ Σt ¯ 2
To simplify the expression for ^tt+1 , we first express the update rule for the inverse covariances in the feature space using the matrix inversion lemma (eq. (A.1) and [Mardia et al. 1979]): −1 T Σ −1 t+1 = Σ t + λt+1 φt+1 φt+1
with
λt+1 =
−r(t+1) 1 + r(t+1) σ2t+1
(4.13)
where σ2t+1 = φTt+1Σφt+1 = k∗ + kTt+1Ckt+1 is the predictive variance of the GP at time t and at location x t+1 . We define . ut+1 = φTt+1f . mt+1 = φTt+1µ t
(4.14)
the projection of the random variable f and the mean where the projection vector is φt+1 . The exponential term in (4.12) is rewritten as µ µ ¶2 ¶2 q(t+1) r(t+1) q(t+1) λt+1 ut+1 − mt+1 + (t+1) − − 2 2 r r(t+1) 61
(4.15)
Chapter 4. Sparsity and the Expectation-Propagation Algorithm and the ratio of the determinants becomes ¯ ¯ ´− 12 ¯ Σ t+1 ¯−1/2 ³ ¯ ¯ = 1 + r(t+1) σ2t+1 ¯ Σt ¯
leading to a scalar quadratic expression for the approximated likelihood · ¸ ³ ´− 12 λt+1 2 ^tt+1 = 1 + r(t+1) σ2t+1 exp − (ut+1 − at+1 ) . 2
(4.16)
(4.17)
The parameters at+1 and λt+1 depend on the likelihood and the prior GP: q(t+1) at+1 = mt+1 − (t+1) r ´−1 . ³ (t+1) −1 2 λt+1 = − (r ) + σt+1
(4.18)
For a single likelihood this approximation is a one-dimensional Gaussian in the random variable ut+1 . Since model selection is not treated here, we do not have to store the normalising constants for the posterior either. We have to keep only the parameters of the distribution of ut+1 , that is the pair (λt+1 , at+1 ). The cost is small, requiring 2N scalars. Using again Fig. 4.1 we identify the segment from any p ^ k to p ^ k+1 as pointing to the direction of φk+1 and parametrised using (λt+1 , at+1 ). The prior GP and the approximated likelihood identify the approximated posterior GP; this involves another data-dependent parametrisation. In the following we assume that both the GP paα, C ) and the scalars (ai , λi ) are updated, the relation between the two parametrisations is rameters (α discussed in Section 4.3. To perform the online update eqs. (4.11), first we need to subtract the contribution of the current xi , y i ) has been picked for processing and likelihood from the model. We assume that an example (x ˜ ) given ˜, C the approximated likelihood has the parameters (ai , λi ). We compute the new GP with (µ by the parametrisation lemma 2.3.1: µ, Σ ) N (ff|µ ˜) ˜, Σ ∝ N (ff|µ ^ti (φT f |ai , λi ) Matching the linear and quadratic terms in f leads to ¡ ¢ ˜ = µ − vih i µ T φi − ai µ
˜ =Σ− Σ
vih ih Ti
with
h i = Σ φi v−1 i
= φTi Σ φi − λ−1 i
(4.19)
giving us the parameters of the Gaussian with which we can perform the online updates. The next step ˜ ) of the new GP according to the parametrisation lemma 2.3.1. ˜, C is to find the changed parameters (α By substituting the general parametrisation from eq. (4.10) into eq. (4.19) we find: ¡ ¢ ˜ = α − vih i α T k i − ai α
˜ =C− C
with
vihihTi
h i = Ck i + e i v−1 i
= σ2i − λ−1 i
(4.20)
x1 , x i ), . . . , K0 (x xN , x i )]T and σ2i = K0 (x xi , x i ) + k Ti Ck i is the variance of the marginalwhere k i = [K0 (x isation of the GP at x i . The EP algorithm for the Gaussian processes can now be established. We select the prior kernel and set α = 0 and C = 0. Similarly, the additional parameters ai and λi that parametrise the likelihood approximations at the data points are also set to zero. We mention that the zero value for λi simply means vi = 0 in eqs. (4.19) and (4.20).
62
Chapter 4. Sparsity and the Expectation-Propagation Algorithm xt+1 , y t+1 ), the approximated likelihood is subtracted from the GP, After selecting an example (x using eq (4.20). Then we compute the scalar update coefficients q(t+1) and r(t+1) using the “corxt+1 |ff) applying the standard online learning procedure, eq. (2.42). rected” GP and the likelihood t(x α, C ) from eq. (2.46), we also update Simultaneously to the online update for the GP parameters (α xt+1 ) using eqs. (4.18). The algorithm then processes a the coefficients of the projected likelihoods ^t(x subsequent example and stops if none of the parameters (ai , λi ) are changed. The EP algorithm encodes the approximated posterior in the one-dimensional normal distributions and we have to store the mean and the variance. In the statistical physics framework, mean field theory is an approximation technique that uses a simpler parametric form for the posterior distributions to obtain a tractable approximation. Recently mean field methods have been gaining popularity in the machine learning community; the techniques developed originally for statistical physics are applied to machine learning problems in Opper and Saad [2001]. The ADATAP approach [Opper and Winther 2001] aims at finding the approximate posteriors for models using factorising likelihoods and prior distributions with quadratic terms, as is eq. (4.2) using Gaussian for p0 (ff). The random variables ui are termed cavity fields and a batch approximation for its distribution is provided using advanced statistical physics methods. The ADATAP method is not discussed here, we only mention that the fixed-point solution of the EP algorithm is the same as this approximation. The EP learning, as presented in this section, applies to GPs that are fully parametrised, i.e.. they include all data points in their representation. To apply the EP for the sparse GP algorithm, we need the updates for (ai , λi ) if an element from the BV set is removed. Before deriving the sparse EP
algorithm, the relation between the two representations for the same GP is established. The sparse extension will follow from the relations between these two parametrisations. The sparse extension of the EP algorithm will follow from this equivalence, presented in Section 4.4
4.3
Relation between GP parametrisations
The posterior GP in the EP-framework is proportional to the prior GP and the product of approximating likelihoods, providing an alternative parametrisation to the GP. The EP representation in this case is via N one-dimensional quadratic exponentials, the approximated likelihood terms. The approximated likelihoods are defined in terms of scalar random variables ui = φTi f which are projections of f , the random variable in F . The resulting GP is written as: a, Λ ) ∝ GP 0 (ff) GP post (ff|a
N Y i=1
N (φTi f |ai , λi )
¯ i° 1h ΦT f − a )T Λ (Φ ΦT f − a ) ∝ exp − f T f + (Φ 2
(4.21)
where Λ is a diagonal matrix having λi on the diagonals and a is the vector of the means. The feature vectors are grouped into Φ = [φ1 , . . . , φN ]T . We will call this the “EP-parametrisation”. α, C ) The second parametrisation of the same GP is given by the parametrisation lemma and uses (α as parameters of the mean and the covariance as shown in eq. (4.10): ° ¯ ´−1 ³ 1 T T α, C ) ∝ exp − (ff − Φα ) IF + ΦCΦ (ff − Φα ) GP post (ff|α 2
(4.22)
we term the “natural parametrisation”. Since we have the same GP in both cases, we can identify
63
Chapter 4. Sparsity and the Expectation-Propagation Algorithm the coefficients of f and ff T in eqs. (4.21) and (4.22): Σ −1µ = (IIF + ΦCΦ T )−1Φα −1
Σ
=
ΦCΦT −1
(IIF + ΦCΦ )
= ΦΛa
(4.23) T
= IF + ΦΛΦ .
(4.24)
The matrix inversion lemma will transform the identities into a form where we can identify the a, Λ ) we obtain the GP-ones (α α, C ) by components. From the EP-parameters (a ³ ´−1 −1 α = (II + ΛK N ) Λa = Λ −1 + K N a ´−1 ³ −1 C = − (II + ΛK N ) Λ = − Λ −1 + K N
(4.25)
where K N is the kernel matrix with respect to all data. Notice that the diagonal form of Λ results from the factorising likelihood. The corresponding inverse relation is: C−1α a = −C ³ ´−1 −1 Λ = − (II + CK ) C = − C −1 + K
(4.26)
Inspecting the above equations we see that the matrix C is fully specified by a diagonal matrix of the same size. This implies that we can represent it by the diagonals of Λ and use eq. (4.23) whenever C is needed. Apart from the computational cost of this operation, in case of sparse updates this simplification does not hold any more: Λ is not diagonal after removing some of the basis vectors, as will be shown in the next section.
4.4
Sparsity and Expectation Propagation
α, C ). The Sparsity is defined using the “natural parametrisation” of Chapter 2 with the parameters (α sparse solution is obtained by eliminating some data points from the representation while retaining as much information about the data itself as possible. Using again the equivalence of GPs with Gaussians in the feature space, we want the mean and covariance from eq. (4.21) to be expressed, instead of the full data vector Φ = [φ1 , . . . , φN ]T , by using only a subset of it. We follow the deduction of sparsity ^ = Φ \ {φN }. The derivation from Chapter 3: the last element is removed from the BV set, leaving Φ
for the case of eliminating more then a single element is very similar.
a, Λ ) with respect to the full input data Φ and we We assume that we have the EP-parameters (a ^ ) using the restricted set Φ ^ of input features. We want to obtain the KL-optimal parameters (^ a, Λ want to represent the resulting GP using the EP-representation: ¯ i° T 1h T T ^ ^T ^ ^ ^ ^ ) Λ (Φ f − a ^) . GP(ff|^ a , Λ ) ∝ exp − f f + (Φ f − a 2
(4.27)
^ . For this we use the relation between the EP-parameters and the natural We start with deducing Λ parameters for the covariance of the reduced system from eq. (4.26): ³ −1 ´−1 ³ ´−1 −1 ^ =− C ^ +K ^ ^ −1 + K ^ −1 C ^ +K ^ −1 ^ Λ = −K K
(4.28)
where we used the matrix inversion lemma eq. (A.1). We can now use the KL-optimal reduction of the matrix C from eq. (3.20) ³ ´−1 h ´−1 h iT i³ ^ +K ^ −1 ^I 0 C = ^I 0 C + K −1 64
Chapter 4. Sparsity and the Expectation-Propagation Algorithm ^ −1 )−1 . The matrix [^I 0 ] is the concatenation of the identity matrix of size N − 1 with ^ +K to replace (C a column of N − 1 zeroes. The replacement leads to ´−1 h h iT −1 i³ ^ = −K ^ −1 + K ^ −1 ^I 0 C + K −1 ^ ^I 0 K Λ · h i ³ ´−1 ¸ h iT −1 −1 −1 −1 ^ ^ ^ ^ = −K + K K ^I 0 K I 0 K −K C +K h i ³ ´−1 h iT −1 ^ −1 ^I 0 K C −1 + K ^ = −K K ^I 0 K
= P TN Λ P N
(4.29)
(4.30)
^ −1 = P N is an orthogonal projection in the feature space F . The projection The product K [^I 0 ] K eliminates the last component by orthogonally projecting it to the span of the first N − 1 examples.
Next we consider the linear term in the EP-parametrisation of the GP from eq. (4.21) with respect T ^ ^a ^ and the new value is obtained from changes in to Φ f : Λa . The sparse learning rules change it to Λ the natural parametrisation via eqs. (4.25) and (4.26). We use, similarly to the case for the quadratic term, the result from eq. (3.20) to relate the reduced and the full EP-parameters of the GP: ³ −1 ´−1 −1 ^a ^ +K ^ ^ α ^= C ^ Λ C ³ ´−1 ^ −1 C ^ +K ^ −1 ^ =K α −1
^ =K
(4.31)
h i³ ´−1 h iT ^I 0 C + K−1 ^I 0 α ^
^ +K ^ −1 ) with the corresponding where from line two to line three of the equation we replaced (C ^ we expression from eq. (3.20) using the old quantities. Similarly to the case of the update of Λ ^ using eq. (3.18): eliminate the pruned α ^a ^ = P TNΛa Λ
(4.32)
where P N is again the projection matrix from eq. (4.30). Substituting back the pruned coefficients ^ as the basis set, the projection matrix P N is grouped with Φ ^ and we have the EPand using Φ parametrisation of the sparse GP from eq. (4.27) as ¯ i° 1h c post (ff|a ^ T f − a )T Λ (P ^ T f − a) PΦ PΦ a, Λ , P ) ∝ exp − f T f + (P GP 2 ∝
GP 0 (ff)
N Y i=1
^ Ti f |ai , λi ). N (φ
(4.33)
This result says that by changing the feature vectors associated with the likelihoods, we can keep the diagonal structure of the second term. The index from the projection matrix P N has been ignored since it is straightforward that if successive projection steps are used, the corresponding matrices multiply and we have, for each input example, the approximation of the feature space image using P ^: φ ^ pi = ^i = Φ φj pij with φi being the i-th column of P . Similarly to the only the elements from Φ j
^ i is used for the projection in obtaining the one-dimensional basic EP algorithm, the approximation φ ^ random variable from eq. (4.14): ui = φTi f . The important result in eq. (4.33) is that the sparse EP algorithm preserves the structure of the EP parametrisation, the KL-optimal pruning changes “only” the directions of projecting the approximating likelihoods, there are no modifications in α or Λ . This means that when iterating
65
Chapter 4. Sparsity and the Expectation-Propagation Algorithm the pruning procedure we have to store the successive projections of all data: assuming a projection matrix, the “update” for it is P new = PP old . The multiplication of the orthogonal projections might suggest that there is no need for memorising ^ −1 . If we remove one more a large P . Indeed, removing the last element is done with P N = K [^I0 ]K −1 ˜ ˜ the Gram matrix containing N − 2 elements, ^ N [˜I0 ]K element we use the matrix P N−1 = K with K ˜ −1 and if we know the N − 2 elements of Φ ˜ then it might then their multiplication gives P = K [^I0 ][˜I0 ]K −1 ˜ be enough to store K as in the previous chapter. This is indeed the case if we do not add elements to BV set in between the removals. Otherwise we must know the content of the BV set when removing
an element and keep track of the changes to this particular subset.
A first observation is that the storage of the projection matrix P is needed, increasing the memory requirements from O(d2 ) to O(Nd + d2 ) where d is the size of the BV set.
Secondly, we see that the KL-optimal pruning of a BV does not mean that the approximated
likelihood for that data is constant: the direction of the projection is changed. In practise the successive
projections might mean the effective removal of a likelihood term, but this is often not the case. The presence of the approximated likelihood even for data which have been removed might justify the good experimental results for the sparse online learning [Csat´o and Opper 2002]. A third useful remark is the relation of the two GP-parametrisations in the sparse case. This is an obvious generalisation of the correspondence given in Section 4.3, eqns. (4.25) and (4.26) deduced for the non-sparse case: ´−1 ³ a α = P T Λ−1 + PKP T
µ³ ¶−1 ´−1 ´−1 ³ P T Λ −1 + PKP T P = − P T ΛP +K C = −P
(4.34)
The difference from the non-sparse case is that, due to the sparsity, the lemma-based representation alone cannot provide the EP-representation, the system is under-determined. In practise, eqns. (4.34) were used to check the correctness of the implemented code.1 . To summarise, the expectation-propagation for the sparse GP implies the projection on a different direction of the random variable f in the feature space. The change of the term ui from eq. (4.14) implies that the result of the subtraction of the approximated likelihood is different from eq. (4.20). xi , y i ) is chosen, then first we have to subtract the approximated likelihood from the If an example (x ˜ ) are: ˜, Σ GP. The new parameters (µ ¡ ¢ ^ i − ai ˜ = µ + vi h i µ T φ µ
^i hi = Σφ
with
˜ = Σ + vi h i h T Σ i
^ Ti Σ φ ^i = λi−1 − φ v−1 i
(4.35)
α, C ), we have the corrections to these parameters required before and translated into the parameters (α applying the online updates as: ¡ ¢ ˜ = α + h i vi α T Kp i − ai α ˜ =C+ C
vih ih Ti
with
h i = CKp i + p i v−1 i
T T = λ−1 i − p i Kp i − p i KCKp i
(4.36)
where K is the Gram matrix of the BV elements and p i is i-th column of the projection matrix P .
1 The operations in eq. (4.34) might involve inversions of almost singular matrices. A possible way to deal with the singular matrices to introduce the auxiliary matrix U = PT ΛP and to rewrite eq. (4.34) as: ³ ´ −1 K−1 U +K K−1 α =K PT Λa ³ ´ −1 K−1 U +K K−1 C = −K U
66
Chapter 4. Sparsity and the Expectation-Propagation Algorithm
4.5
Comparisons for regression
The sparse EP is a refinement of the sparse online algorithm, thus it is related to the kernel PCA methods [Sch¨olkopf et al. 1999] and the Nystr¨om method proposed to speed up kernel machines [Williams and Seeger 2001]. In the following we compare the Nystr¨om method applied for the regression case with the sparse EP algorithm. The Nystr¨om method uses the feature space F and a subset from the training set to construct an
approximation to the eigenvalues of the kernel function, presented in details in Section 3.7. Using a
subset of size m, there will be only m nonzero approximated eigenfunctions. Assuming a data set of size N, the N × N kernel matrix K N is approximated with the smaller-rank ˜ N = k NmK −1K mN = PK mP T K m
(4.37)
where we used the projection matrix P = k NmK −1 m from the previous section and we assumed that the subset of size m for the Nystr¨om method is the BV set.
In applications the inversion of the large K N is replaced with the inversion of the smaller matrix
K m and the matrix inversion lemma from eq. (A.1) is exploited to reduce the cost of computations. For regression, where we know the analytical result, the Nystr¨om method applied to computing the predictive mean at x is ´−1 ³ ´−1 ³ ˜N tN t N = k TN σ20I N + PK BV P T hfx iNY = kxT σ20I N + K
(4.38)
x1 , x ), . . . , K0 (x xN , x )]T , σ20 is the noise variance, and t N is the vector of outputs. where k N = [K0 (x To compare it with the sparse EP algorithm, we assume a specific order for the presentation of the data: the elements of the BV set are presented first and there is no removal. This is equivalent with applying the KL-projection to the full posterior process. For the full process we have Λ N = I N /σ20
and a N = t N . We apply the KL-projection to the BV set, leading to the GP with parameters in the
EP representation:
Λ = P T Λ NP = T
1 T P P σ20
(4.39)
T
a = P aN = P tN and similarly we compute the predictive mean for the sparse EP algorithm: ´−1 ³ a hfx iEP = k TBV K BV + Λ −1 · ´−1 ¸ ³ −1 T Λ a = k BV Λ − Λ Λ + K BV " # µ ¶−1 1 T 1 T 1 T T −1 T = k BV P P − 4P P P P + K BV P P P T tN σ20 σ0 σ20 " ¶−1 # µ 1 1 T 1 −1 T T P T PP T t N IN − 4 P P P + K BV = k BV P σ20 σ0 σ20 i−1 h Pk BV )T σ20I N + PK BV P T PP T t N = (P x1 , x ), . . . , K0 (x xm , x )]T . where k BV = [K0 (x
(4.40)
We interpret Pk BV as the reconstruction of k N from
T
eq. (4.38), and similarly PP t N is an approximation to t N using the m available basis vectors. We write x, x )). the expression corresponding to the predictive variance for the EP regression (using k∗ = K0 (x ´−1 ³ Pk BV )T σ20I N + PK BV P T Pk BV . (4.41) σ2EP = k∗ − (P 67
Chapter 4. Sparsity and the Expectation-Propagation Algorithm We see again that the predictive variance is also expressed using the reconstructions of the inputs from the BV set. A similar construction for the predictive variance in the Nystr¨om method does not
exist: we do not get positives variance at all input points x , the Nystr¨om method is probabilistically inconsistent, this is because it only considers the GP marginals at the data locations. Compared with the Nystr¨om method, we see that the sparse EP algorithm provides a less accurate
posterior mean then the Nystr¨om method method, but it has the advantage of a fully probabilistic treatment.
4.6
The proposed algorithm
The algorithm proposed here has an increased complexity compared with the sparse online algorithm and the same structure as the original expectation-propagation [Minka 2000]. Additional cost, compared with the sparse online algorithm arises from the need to update the P , the matrix of projections, that requires O(Nd) operations.
Similarly to the sparse online algorithm from Section 3.6, we set the maximal BV set size in advance
to MBV . Whenever the size of the BV set gets larger then MBV we delete the BV with the smallest
score. For algorithmic stability we also use the tolerance value ǫtol to prevent the Gram matrix from being singular. α, C ) and BV set with empty values, and also It starts with initialising the GP parameters (α
initialising the EP parameters (ai , λi ) for all inputs with zero values. Since BV set is empty, the
projection matrix is also empty.
xi , y i ) the algorithm iterates the following steps: For a selected example (x 1. If λi > 0 then compute the correction for the GP using eqs. (4.20), i.e. subtract the contribution from the previous iterations. 2. Compute the online GP update coefficients r(i) , q(i) using eq. (2.42), and γi using eq. (3.2) and perform the updates for the α, C ) using eq. (2.46), • GP parameters (α • inverse Gram matrix Q , using eq. (3.5), • local EP parameters (ai , λi ), based on eq. (4.18), • projection vector P by adding a new column containing e i . If γi < ǫtol then perform the sparse updates. 3. If the size of the BV set is larger than MBV then • compute the score for all elements of the BV set, • remove the minimal element from the α, C ) using eqs. (3.19) and (3.21), – GP parameters (α – projection vector P new . – inverse Gram matrix Q using eq. (3.22).
68
Chapter 4. Sparsity and the Expectation-Propagation Algorithm The algorithm is iterated until some convergence criterion is met or for a fixed number of sweeps through the whole data. In the experiments we employed the later choice. This seemed reasonable since a steady performance was reached in most cases after the second sweep through the data. A more detailed sketch of the algorithm is given in Appendix G, with related equations written explicitly.
4.7
Discussion and Further Research
This chapter developed an iterative approach to improve on the sparse online solution such that the sparseness, i.e. the possibility of a flexible treatment of the BV set size, is preserved.
The improvement is based on the expectation-propagation algorithm for the GPs, presented
by Minka [2000]. Its extension to sparse GPs increases the computational demand by requiring, beyond the parameters (ai , λi ), the storage of a projection matrix P of size N × d with d being the
size of the BV set.
We believe that the EP algorithm for the sparse GPs fills in a gap in the applicability of GPs: if
we have a small data set, then the EP algorithm proposed originally by Minka [2000] suffices. For the case of large datasets, we believe (as supported by experiments), that the sparse GP algorithm presented in Chapter 3 is the only available method if we want to use GPs. Additionally, there is a class of problems with data size that makes the EP algorithm inapplicable or inefficient, but for which the sparse online GP algorithm does not provide a sufficiently good solution. For these algorithms the EP extension of the sparse GPs can be used. Further work needs to consider model selection for this class of algorithms. We have the ability to approximate the data likelihood, and this could provide us with an appropriate tuning of the hyper-parameters. An interesting problem is the extensibility of the sparse framework to non-Gaussian families. This is suggested by the observation that if we use the EP-representation, then minimising the KLdivergence translates into simple projections of the examples to the set of basis vectors. Pruning is then performed by writing the solution of the problem into the EP-form of eq. (4.21), performing the removal of inputs in this framework and transforming back into a more convenient representation.
69
Chapter 5 Applications Summary: The sparse online algorithm for GPs and its extension using the expectationpropagation are tested for various problems.
In the previous chapters learning algorithms for Gaussian processes were derived. The presented algorithms had gradually increasing complexity with the more complex algorithms embellished upon the simpler ones. Specifically, if we include all training examples into the BV set within the sparse
online algorithm, then we obtain back the online algorithm of Chapter 2. Similarly, using a single sweep through the data for the sparse EP-algorithm of Chapter 4 is equivalent to the sparse online algorithm described in Chapter 3. Furthermore, when the algorithms were defined, the likelihoods were left unspecified, it has only been assumed that it is possible to evaluate – exactly or using approximations – the averaged likelihood with respect to a one-dimensional Gaussian measure which is needed to compute the update coefficients for the online learning from Chapter 2. For these reasons the experiments are grouped into a single chapter. This way more emphasis is
given to the fact that sparse GP learning is applicable to a wide range of problems and at the same time the repetitions caused by presenting the same problem repeatedly for each algorithm are avoided. The aim of the experiments is to show the applicability of the sparse algorithms for various problems and the benefit of the approximation provided by sparsity. Thus, where it is possible, we present the results for the following cases: • the single sweep online algorithm from Chapter 2 is shown as the result at the end of the first iteration at BV set size equalling the size of the training data if the size of the data set is not large.
• the sparse online algorithm discussed in Chapter 3 – the results for BV set sizes smaller than the size of the training data at the end of the first iteration.
• the expectation-propagation algorithm with all inputs included (as proposed by Minka [2000]) – the results of subsequent iterations when the BV set is maximal.
• the sparse extension of the EP algorithm from Chapter 4 – the second and third iterations at BV set sizes smaller than the size of the training data.
Throughout the experiments two kernels are used: the polynomial (eq. 5.1) and the radial basis
70
Chapter 5. Applications RBF kernel σ2K=1, input noise σ2=0.02
2
POL with order 5 and noise σ = 0.02 1.2
1.4
1
1.2 1
0.8
0.8
0.6
0.6
0.4 0.4
0.2 0.2
0
0
−0.2
−0.2
−0.4
−0.4
−0.6 −2
−1.5
−1
−0.5
0
0.5
1
1.5
−0.6 −2
2
−1.5
−1
−0.5
(a)
0
0.5
1
1.5
2
(b)
Figure 5.1: Results of applying GPs to the noisy sinc function. The inputs were 1000 uniformly sampled points and the outputs were corrupted by white noise with variance σ2n = 0.01. The figures show the true function (continuous line), the predictive mean of the GP (dash-dotted line), the variance of the GP at the inputs (dashed lines) for the fifth order polynomial (left) and the RBF kernel (right). The diamonds on both plots show the BV set with the original noisy output. function or RBF (eq. 5.2) kernels: ¶k xT y ′ dlK µ ¶ x − x ′ k2 kx ′ x x KRBF (x , ) = exp − 2dσ2K µ
x, x ′ ) = KPOL (x
1+
(5.1) (5.2)
where the d is the dimension of the inputs and we used it just for an approximate normalisation when using datasets of different dimensions. The kernel parameters are the order of the polynomial k and the length-scale lK for the first case and the width of the radial basis functions in the second case. The denominators in both cases include the normalisation constant d that makes the scaling of the kernels less dependent on the input dimensionality – independent if we assume that the data are normalised to unit variance. Both kernels are often used in practise. The polynomial kernels have a finite-dimensional feature space (discussed in Section 2.2) and are used for visualisation. The RBF kernels, having their origin in the area of radial basis function networks [Broomhead and Lowe 1988], have infinite-dimensional feature space; they are favourites in the kernel learning community. The following sections detail the results of applying the sparse GP learning to different problems. Section 5.1 presents the results for regression, Section 5.2 for the classification. A non-parametric density estimation using the sparse GPs is sketched in Section 5.3. The final application considered is a data assimilation problem. In this case the problem is to infer a global model of wind fields using satellite observations. The GP approach to this problem and the possible benefits of sparsity are detailed in section 5.4.
5.1
Regression
Quadratic regression using Gaussian noise is analytically tractable [Williams 1996] as has been detailed x, y ) in this case is in previous chapters. The likelihood for a given example (x ¶ µ y − fx k ky y|x x, fx ) ∝ exp − P(y 2σ20 71
(5.3)
Chapter 5. Applications with fx the GP marginal at the input location x and σ20 the variance of the Gaussian noise (here supposed to be known). It has been shown in Chapter 2 that online learning applied to the Gaussian likelihood in eq. (5.3) leads to an exact iterative computation of the posterior process, expressed by α, C ). Using the kernel matrix K N for all training data, the posterior GP parameters its parameters (α are: ¡ ¢−1 α = K N + σ20I y ¡ ¢ −1 C = − K N + σ20I
with y the concatenation of all output values. The parameters for the online recursions are q(t+1) =
y t+1 − α T k t+1 σ20 + σ2t+1
and
r(t+1) = −
σ20
1 + σ2t+1
x1 , x t+1 ), . . . , K0 (x xt , x t+1 )]T and σ2t+1 = k∗ + k Tt+1Ck t+1 is the variance of the GP where k t+1 = [K0 (x marginal at xt+1 . α, C ) of the size of the training data. In Chapter 3 it The online algorithm from Chapter 2 uses (α has been shown that this representation is redundant: the dimensions of the GP parameters should not exceed the dimension of the feature space. Introducing sparsity for the case of regression keeps the GP representation non-redundant. To illustrate this, first we consider the learning of the one-dimensional noisy sinc function sin(x) +ν (5.4) x using the polynomial and the RBF kernels. In the experiments we considered independent Gaussian y = sinc(x) =
noise with variance σ2n = 0.01. First we considered the polynomial kernels from eq. (5.1). These kernels, if the input space is one-dimensional, are particularly simple: the dimension of the feature space associated with them is k + 1. This means that the number of inputs in the BV set can never
be larger than k + 1. The KL-projection method from the sparse online algorithm ensures this. The
results from Fig. 5.1 show that there are 6 examples in the BV set, yet the GP contains information
about all data. When the RBF kernel is used, we see that it provides a better approximation in this case, but the cost is that there are twice as many elements in the BV set. The size of the BV set has
been set to 10 manually. For the sinc function and RBF kernels with σ2K = 1, BV set sizes larger than
12 were not accepted: the score of each new input has been smaller than the threshold for addition, which was set to 10−6 for numerical stability.
The next example considered was the Friedman #1 dataset [Friedman 1991]. In this case the inputs are sampled uniformly from the 10-dimensional hypercube. The scalar output is obtained as y = 10 sin(πx1 x2 ) + 20(x3 − 0.5)2 + 10x4 + 5x5
(5.5)
and the variables x6 , . . . , x10 do not affect the output, they act as noise. Fig. 5.2 shows the test errors for this dataset. From the clearly visible plateau as the BV set size increases we conclude that the
sparse online GP learning procedure from Chapter 3, plotted with continuous lines, gives as good solutions as the online learning that includes all examples to the BV set. This suggests that the
effective dimension of the data in the feature space defined by the kernel is approximately 120 − 130 and there is no need to use more BV s than this effective dimensionality.
The results of the GP learning were compared to those obtained by the Support Vector regression
(SVM) and the Relevance Vector machine (RVM) as provided by Tipping [2001a]. The test error in
72
Chapter 5. Applications FR1: 250 train; 500 test (0.0001) 8 1 sweep 4 sweeps 7
Avg. test error
6 5 4 3 2 1
50
100
150 BV set size
200
Figure 5.2: Results for the Friedman dataset using 250 training and 500 test data. The two lines show the average test errors after a single sweep (continuous line) and after four iterations (dashed line) through the data. The line show average test errors over 50 iterations with error bars displaying the standard deviation of the 50 experiments. The horizontal dotted line shows the performance of the SVM and RVM algorithms, see text for details. the steady region (i.e. BV set size > 120) for our algorithm was ≈ 2.4 which is smaller than those of
the SVM (2.92) and RVM (2.80) respectively. The number of parameters for GP algorithm, however, is larger: it is quadratic in the size of the BV set whilst both the SVM and the RVM algorithms have
a linear scaling with respect to the size of their “support vectors” (116 were used in the experiments) and “relevance vectors” (59 used) respectively.
On the other hand, as discussed in Section 3.7, in their standard form both algorithms use the kernel matrix with respect to all data, this is not the case of the sparse EP/GP algorithm. The sparse EP algorithm is applied in the second sweep through the data. For cases when the size of the BV set is close enough to the effective dimension of the data in the feature space, this second
sweep does not give any improvement. This is expected since for this problem the posterior process is also a GP, no approximations are involved in the online learning. As a result, in the region where the BV set sizes exceed this effective dimension, the KL-projection in the sparse online algorithm is just a rewriting of the feature space image of the new input as a combination of inputs from the BV
set, and the length of the residual is practically zero. If we are not close to the limit region, then the EP corrections improve on the performance of the algorithm, as it is the case for the small BV set
sizes in Fig. 5.2. This improvement is not significant for regression, the improvements are within the empirical error bars, as it is also shown for the next application: the Boston housing dataset. The Boston housing dataset is a real dataset with 506 data, each having 13 dimensions and a single output. The 13 inputs describe different characteristics of houses and the task is to predict their price.1 In the experiments the dataset has been split into training and test sets of sizes 481/25 and we used 100 random splits for all BV set sizes and the results are shown in Fig. 5.3. If different
BV set sizes are compared, we see that there is no improvement after a certain BV set size.
Two series of experiments were considered by using the same dataset without pre-processing (sub-
figure a), or normalising it to zero mean and unit variance (subfigure b). The results have been compared with the SVM and RVM methods, which had squared errors approximately 8 [Tipping 2001a], we conclude that the performance of the sparse GP algorithm is comparable to these other 1 Available
from http://lib.stat.cmu.edu/boston.
73
Chapter 5. Applications 2 0
2 0
(norm) Boston: 481 train; 25 test (σ =0.01)
(unnorm) Boston: 481 train; 25 test (σ =5e−05)
20
30
1 sweep 3 sweeps
18
1 sweep 3 sweeps 25
16
20 Avg. test error
Avg. test error
14 12 10 8
15
10
6 4
5
2 0
0
50
100
150 BV set size
200
50
100
(a)
150 BV set size
200
(b)
Figure 5.3: Results for the Boston dataset with normalised (left) and unnormalised (right) inputs. The results are obtained using RBF kernels with σ2K = 2 and σ2K = 2500 for the normalised and the unnormalised cases. kernel algorithms. We need to mention however that, the setting of the hyper-parameters σ20 and σ2k was made on a trial-and error, we did not use cross-validation or other hyper-parameter selection method, the aim of the thesis is to show the applicability of the sparse GP framework to real-world problems. We see that if the size of the BV set is large enough, the expectation-propagation algorithm does
not improve on the performance of the sparse online algorithm. Improvements when the data is
re-used are visible only if the BV set is small. This improvement is not visible when learning the unnormalised Boston dataset.
The main message from this section is that using sparsity in the GPs does not lead to significant decays in the performance of the algorithm. However, the differences between the sub-plots in Fig. 5.3 emphasises the necessity of developing methods to adjust the hyper-parameters. In the next section we present examples where the EP-algorithm improves on the results of the sparse online learning: classification using GPs.
5.2
Classification
A nontrivial application of the online GPs is the classification problem: the posterior process is non-Gaussian and we need to perform approximations to obtain a GP from it. We use the probit model [Neal 1997] where a binary value y ∈ {−1, 1} is assigned to an input x ∈ Rm with the data likelihood
P (y|ffx ) = Erf
µ
y fx σ0
,
where σ0 is the noise variance and Erf(z) is the cumulative Gaussian distribution: µ 2¶ Zz t 1 dt exp − Erf(z) = √ 2 2π −∞
(5.6)
(5.7)
The shape of this likelihood resembles a sigmoidal, the main benefit of this choice is that its average with respect to a Gaussian measure is computable. We can compute the predictive distribution at a
74
Chapter 5. Applications Crab 50 BV; RBF(2,4) σ2=0.01
Crab: 80 train; 120 test (0.01)
0
8
6
8 Test error Training error Test dev Training dev
6 4 2 0
1 2 # of sweeps through the data
5 100 Replacement %
Avg. test error (%)
7
Train #80; Test #120
1 sweep 2 sweeps 3 sweeps
4
3
2
10
20
30
40 50 BV set size
60
70
50
0
80
1 2 # of sweeps through the data
(a)
(b)
Figure 5.4: Results of the sparse algorithm for the Crab dataset: (a) the average test errors vs. different BV set sizes averaged over 50 experiments for each BV set size. The error bars show the standard deviation of the test errors for the 50 experiments. (b) Cross-section of the experiments for BV set size 50: the upper subplot shows the evolution of test and training errors during the EP-iterations and on the lower subplot the average replacements of elements in the BV set are displayed. new example x : x, α , C ) = hP(y|ffx )it = Erf p(y|x
µ
y hffx it σx
(5.8)
kxT Ckx . It is the predictive distribution where hfx it = kxT α is the mean of the GP at x and σx2 = σ20 +kx∗ +k
of the new data, that is the Gaussian average of an other Gaussian. The result is obtained by changing
the order of integrands in the Bayesian predictive distribution eq. (5.6) and back-substituting the definition of the error function. x, y) the update coefficients q(t+1) and r(t+1) Based on eq. (2.42), for a given input-output pair (x are computed by differentiating the logarithm of the averaged likelihood from eq. (5.8) with respect to the mean at x t+1 [Csat´o et al. 2000]: (t+1)
q
y Erf ′ = σx Erf
with Erf(z) evaluated at z =
y αT t kx σx
(t+1)
r
1 = 2 σx
±
Erf ′′ − Erf
µ
Erf ′ Erf
¶2 ²
(5.9)
and Erf ′ and Erf ′′ are the first and second derivatives at z.
The algorithm for classification was first tested with two small datasets. These small-sized data allowed us to benchmark the sparse EP algorithm against the full EP algorithm presented in Chapter 4. The first dataset is the Crab dataset [Ripley 1996] 2 . This dataset has 6-dimensional inputs, measuring different characteristics of the Leptograpsus crabs and the task is to predict their gender. There are 200 examples split into 80/120 training/test sets. In the experiments we used the splits given in [Williams and Barber 1998] and we used the RBF kernels to obtain the results shown Fig 5.4.a (the polynomial kernels gave slightly larger test errors). As for the regression case, we see the long plateau for the sparse online algorithm (the thick continuous line labeled “1 sweep”) when the BV set size increases.
We also see that the online and the sparse online learning algorithms have a relatively large variation in their performance, as shown by the error-bars. The result of applying the full EP algorithm of Minka [2000] can be seen when all 80 basis vectors
are included into the BV set in Fig. 5.4.a. We see that the average performance of the algorithm 2 Available
at http://www.stats.ox.ac.uk/pub/PRNN
75
Chapter 5. Applications Sonar 50 BV; RBF(0.25,1) σ2=0.0001
Sonar: 104 train; 104 test (0.0001)
0
Train #104; Test #104
15 1 sweep 3 sweeps
14
12 11
15 10 5 1 2 # of sweeps through the data
100
9 8 7 6 5
Test error Training error Test dev Training dev
20
10 Replacement %
Avg. test error (%)
13
25
20
40
60 BV set size
80
50
0
100
(a)
1 2 # of sweeps through the data
(b)
Figure 5.5: The results the sparse algorithm for the Sonar dataset. The different lines in the sub-plots are as of Fig. 5.4. improved when a second and a third iteration through the data is made. Apart from the decrease in the test error, by the end of the third iteration the fluctuations caused by the ordering of the data also vanished. As the dashed line from Fig. 5.4.a shows, if the size of the BV set is larger than 20, the sparse EP
algorithm has the same behaviour as the full EP, reaching a test error of 2.5%, meaning 3 misclassified
examples from the test set. Interestingly this small test error is reached even if more than 80% of the inputs were removed,in showing the benefit of combining the EP algorithm with the sparse online GP. The performance of the algorithm is in the range of the results of other the state-of-the-art methods: 3 errors with the TAP mean field method, 2 using the naive mean field method [Opper and Winther 2000], 3 errors when applying the projection pursuit regression method [Ripley 1996]. Fig. 5.4.b shows a cross-section of the simulations for #BV = 50. The top sub-figure plots the average test and training errors with the empirical deviations of the errors (the dashed lines). The additional computational cost of the algorithm, compared with the sparse online method, is the update of the projection matrix P , requiring O(Nd) operations. This update is needed only if we are replacing
an element from the BV set. The bottom part of Fig. 5.4.b shows the average number of changes in
the BV set. Although there are no changes in the test or the training errors after the second iteration,
the costly modification of the BV set is still performed relatively often, suggesting that the changes in the BV set after this stage are not important. This suggests that for larger datasets we could employ
different strategies for speeding up the algorithm. One simple suggestion is to fix the elements in the BV set after the second iteration and to perform the sparse EP algorithm by projecting the data to
the subspace of the BV elements in the subsequent iterations. The later stage of the algorithm would be as fast as the sparse online algorithm since the storage of the matrix P is not required. A second
strategy would be to choose the kernel parameters and the size of the BV set such that the number of
replacements is low, the given number of basis vectors representing all training inputs, this is possible using appropriate pre-processing or adapting the model parameters accordingly. The selection of the parameters for the RBF kernel is not discussed. When running the different experiments we observed that the size of the BV set and the optimal kernel parameters are strongly related, making the model selection issue an important future research topic.
76
Chapter 5. Applications USPS multiclass − RBF(0.5,2)
USPS 4 non 4
7.5
2.5
Single sweep Three sweeps
Single sweep Three sweeps
2.4
7
2.2
Test error (%)
Test error (%)
2.3
2.1 2
6.5
6
1.9 1.8
5.5
1.7 1.6 0
100
200
300 # BV
400
500
5 50
600
100
150
200
250
300
350
400
# BV
(a)
(b)
Figure 5.6: Results for the binary (a) and multi-class (b) classification, the lines showing the average test errors of 10 experiments with different order of the data. The multi-class case is a combination x). The of the 10 individual classifiers: the example x is assigned to the class with highest P(Ci |x error bars show the deviation of the test errors averaged out on the 10 independent orderings. The smaller number of BV set sizes on the multiclass plot (b) is due to the computational limitations: the coefficients of the 10 individual classifiers are computed simultaneously. A second experiment for classification used the sonar data [Gorman and Sejnowski 1988].3 . This dataset has originally been used to test classification performance using neural networks. It consists of 208 measurements of sonar signals bounced back from a cylinder made of metal or rock, each having 60 components. In the experiments we used the same split of the data as has been used by Gorman and Sejnowski [1988]. The data was preprocessed to unit variance in all components and we used RBF kernels with variance σK = 0.25, with noise σ20 = 0.0001. The results for different BV set sizes are
presented in Fig. 5.5. We can again see a plateau of almost constant test error performance starting at 70. Contrary to the case of the Crab dataset, this plateau is not as clear as in Fig. 5.5; a drop in the test error is visible at the upper limit of the BV set sizes. The difference might be due to the higher dimensionality of the data: 60 as opposed to 6 whilst the sizes of the training sets are comparable.
For comparison with other algorithms we used the results as reported in [Opper and Winther 2000]. The test errors of the naive mean field algorithm and the TAP mean field algorithm were 7.7, this being the closest to the result of the EP algorithm which was 6.7. It is also important that the EP test error at #BV = 100, i.e. when using almost all training data, becomes independent of the order of the presentation, the error bars vanish. However, using only a half the training data in the BV set, the performance of the sparse EP
algorithm is 8.9 ± 0.9%, still as good as the SVM or the best performing two-layered neural network both of which are reported to have 9.6% as test errors [Ripley 1996; Opper and Winther 2000].
A third dataset which we have used in tests is the USPS dataset of gray-scale handwritten digit images of size 16 × 16. The dataset consists of 7291 training and 2007 test patterns.4 In the first
experiment we studied the problem of classifying the digit 4 against all other digits. Fig. 5.6.a plots the test errors of the algorithm for different BV set sizes and fixed values of hyper-parameter σ2K = 0.5. The USPS dataset has frequently been used to test the performance of kernel-based classification
algorithms. We mention the kernel PCA method of [Sch¨olkopf et al. 1999], the Nystr¨om method of 3 Available 4 Available
from http://www.ics.uci.edu/∼mlearn/MLRepository from http://www.kernel-machines.org/data/
77
Chapter 5. Applications Multiclass classification (350 BV)
Multiclass classification (150 BV)
12
12 Rejected Error
8
8
6
6
4
4
2
2
0
Rejected Error
10
Test Error (%)
Test Error (%)
10
0
0.01
0.1
0.2
0.3
0.4
0.5
0.6
0
0.7
0
0.01 0.1
(a)
0.2
0.3
0.4
0.5
0.6
0.7
(b)
Figure 5.7: Combining rejection and multiclass classification: by increasing the rejection threshold, the percentage of the misclassified examples decreases and the total error does not increase significantly. Subplot (a) uses 150 basis vectors and subplot (b) uses 350. [Williams and Seeger 2001] and the application of the kernel matching pursuit algorithm [Vincent and Bengio 2000], all discussed in detail in Section 3.7. The Nystr¨om approach considers a subset of the training data onto which the inputs are projected, thus it is similar to the sparse GP algorithm. This approximation proved to provide good results if the size of the subset was as low as 256. The mean of the test error for this case was ≈ 1.7% [Williams and Seeger 2001], thus the results from Fig. 5.6.a are in the same range.
The PCA reduced-set method of [Sch¨olkopf et al. 1999] and the kernel matching pursuit algorithms give very similar results for the USPS dataset, their result sometimes is as low as 1.4%. By performing additional model selection the results of the sparse GP/EP algorithms could be improved, our aim for these experiments was to prove that the algorithm produces similar results to other sparse algorithms in the family of kernel methods. The sparse EP algorithm was also tested on the more realistic problem of classifying all ten digits simultaneously. The ability to compute Bayesian predictive probabilities is absolutely essential in this case. We have trained 10 classifiers on the ten binary classification problems of separating a single digit from the rest. An unseen input was assigned to the class with the highest predictive probability given by eq. (5.8). Fig. 5.6.b summarises the results for the multi-class case for different BV set sizes
and RBF kernels (with the external noise variance σ20 = 0).
To reduce the computational cost we used the same set for all individual classifiers (only a single inverse of the Gram matrix was needed and also the storage cost is smaller). This made the implementation of deleting a basis vector for the multi-class case less straightforward: for each input and each basis vector there are 10 individual scores. We implemented a “minimax” deletion rule: whenever a deletion was needed, the basis vector having the smallest maximum value among the 10 classifier problems was deleted, i.e. the index l of the deleted input was l = arg min max εci . i∈BV c∈0,9
(5.10)
The results of the combined classification for 100 and 350 BV s is shown in Fig. 5.6.b The sparse online
algorithm gave us a test error of 5.4% and the sparse EP refinement further improved the results to 5.15%. It is important that in obtaining the test errors we used the same 350 basis vectors for all
78
Chapter 5. Applications binary classifiers. This is important, especially if we are to make predictions for an unknown digit. If we use the SVM approach and compute the 10 binary predictions, then we need to evaluate the kernel 2560 times, opposed to the 350 evaluation for the basis vector case. The results from Fig. 5.6.b are also close to the batch performance reported in [Sch¨olkopf et al. 1999]. The combination of the 10 independent classifiers obtained using kernel PCA attained a test error of 4.4%. The benefit of the probabilistic treatment of the classification is that we can reject some of the data: the ones for which the probability of belonging to any of the classes is smaller then a predefined threshold. In Fig. 5.7 we plot the test errors and the rejected inputs for different threshold values. An immediate extension of the sparse classification algorithms would be to extend them for the case of active learning [Seung et al. 1992; Campbell et al. 2000] described in Section 3.8.1. It is expected that this extension, at the cost of searching among the training data, would improve the convergence of the algorithm. To sum up, in the classification case, contrary to regression, we had a significant improvement when using the sparse EP algorithm. The improvement was more accentuated in the low-dimensional case. The important benefit of the EP algorithm for classification was to make the results (almost) independent of the order of presentation, as seen in the figures showing the performance of the EP algorithm.
5.3
Density Estimation
Density estimation is an unsupervised learning problem: we have a set of p-dimensional data D =
xi }N {x i=1 and our goal is to approximate the density that generated the data. This is an ill-posed problem, the weighted sum of delta-peaks being an extreme of the possible solutions [Vapnik 1995]. In onedimensional case a common density estimation method is the histogram, and the Parzen-windowing technique can be thought as an extension of the histogram method to the multi-dimensional case. In R x, x ) = h(kx x − x ′ k2 ) with the function h chosen such that dx xK0 (x x, x ′ ) = 1 this case the kernel is K0 (x for all x ′ . The Parzen density estimate,based on K0 , is written [Devroye et al. 1996]: N
x) = p ^ parzen (x
1 X xi , x ) K0 (x N
(5.11)
i=1
where the prefactor 1/N to the sum can be thought of as a coefficient ηi that weights the contribution of each input to the inferred distribution. The difficulty in using this model, as with other nonparametric techniques, is that it cannot be used for large data sizes. Even if there is no cost to compute αi , the storage of each training point and the summation is infeasible, raising the need for simplifications. Recent studies addressed this problem using other kernel methods, based on the idea of Support Vector Machines. Weston et al. [1999] used SVMs for density estimation. Instead of using the fixed set of coefficients αi = 1/N, they allowed these coefficients to vary. An additional degree of freedom to the problem was added by allowing kernels with varying shapes to be included in eq. (5.11). The increase in complexity was compensated with corresponding regularisation penalties. The result was a sparse representation of the density function with only a few coefficients having nonzero parameters. This made the computation of the inferred density function faster, but to obtain the sparse set of solutions, a linear system using all data points had to be solved.
79
Chapter 5. Applications A different method was the use of orthogonal series expansion of kernels used for Parzen density estimation in eq. (5.11), proposed by Girolami [2002]. This mapped the problem into a feature space determined by the orthogonal expansion. The sparsity is achieved by using kernel PCA [Sch¨olkopf et al. 1998] or the Nystr¨om method for kernel machines [Williams and Seeger 2001]. The study presented empirical comparisons between the performance of the kernel PCA density estimation and the original Parzen method, showing that a significant reduction of the components from the sum was possible without decay in the performance of the estimation. In this section we apply the sparse GPs and the EP algorithm to obtain a Bayesian approach to density estimation. We use a random function f to model the distribution and the prior over the function f regularises the density estimation problem. The prior over the functions is a GP and next we define the likelihood. A basic requirement for a density function is to be non-negative and normalised, thus we consider the likelihood model: x|f) = R h(x
fx2 dzz fz2
(5.12)
x|f) is the density at the input x . An with fx a random function drawn from the prior process and h(x important difference from the previous cases is that the likelihood for a single output is conditioned on the whole process. We assume a compact domain for the inputs, this makes the normalising integral well defined. Another possibility would be to assume a generic prior density for the inputs to replace the constraint on the input domain, however this is future work. In contrast to the previous applications of the sequential GP learning presented in this Chapter, this “likelihood” is not local: the density at a point is dependent on all other values of f, the realisation of the random process. This density model has been studied in Holy [1997] and Schmidt [1998] and other x|f) ∝ exp(−fx ) by Nemenmann likelihoods for density estimation have also been considered like p(x
and Bialek [2001], but these earlier studies were concerned with finding the maximum a-posteriori value of the process. We are using eq. (5.12) to represent the density, making the inference of the unknown probability
distribution equivalent to learning the underlying process. We write the posterior for this process as QN 2 QN 2 Z f 1 i=1 fi with Z = df p0 (f) ¡R i=1 ¢iN (5.13) ppost (f) = p0 (f) ¡R ¢N Z dzz fz2 dzz fz2
where again, due to the denominator, we need to take into account all possible realisations of the function f, i.e. we have a functional integral. As usual, we are interested in the predictive distribution of the density, which is given by eq. (5.12)
where fx is the marginal of the posterior GP at x . We obtain a random variable for the density at x . We compute the mean of this random value, and have the prediction for the density function: QN 2 Z f2 fi 1 x|D) = (5.14) dfp0 (f) ¡Rx i=1 h(x ¢N+1 Z dzz fz2 with the normalising constant Z defined in eq (5.13).
The normalisation in the previous equations makes the density model intractable. Essentially, it prevents the solutions from being expressible using the representer theorem of Kimeldorf and Wahba [1971] or the representation lemma from Chapter 2. Next we transform the posterior into a form that makes the representation lemma applicable for the density estimation problem. For this we observe that the normalising term is independent of the input set and of the location at which the distribution
80
Chapter 5. Applications is examined. To apply the parametrisation lemma, we include the normalising term into the prior to obtain a new prior for f. For this we consider the Gamma-distribution Z∞ R 2 λ N!2N+1 λN e− 2 dzz fz = ¡R ¢N+1 0 dzz fz2
(5.15)
where the integral with respect to fz is considered fixed. We can rewrite the predicted density by adding λ to the set of model parameters: x|D) p(x
Z Z∞ N R Y 1 z fz2 2 −λ dz N 2 dfp (f)e f dλ λ f2i 0 x 2N+1 N! Z 0 i=1 " N # Z∞ Y dλZλ λN Eλ fx2 f2i ∝ =
0
(5.16)
i=1
where an expectation over a new Gaussian prior has been introduced. The new GP is obtained by multiplying the initial GP with the exponential from eq. (5.15) and Zλ is the normalisation corresponding to new “effective GP”. Next we derive the covariance of this “effective GP”. For this we use the decomposition of the x). For this set of functions we have kernels K0 using an orthonormal set of eigen-functions φi (x Z xφi (x x)φj (x x) = δij dx (5.17) x, x ′ ) = such that K0 (x
P
i
x)φj (x x ′ ), the details of the different mappings into the feature space σ2i φi (x
were presented in Section 2.1. We used σ2i to denote the eigenvalues in order to avoid possible confusions that would result from double meaning of the parameter λ. The decomposition of the kernel leads to the projection function from the input into the feature space: x) = [σ1 φ1 (x x), σ2 φ2 (x x), . . .]T φ(x
(5.18)
x) = ξ T φ(x x) where ξ = [ξ1 , ξ2 , . . .]T is the vector of and we can write the random function fx = f(x random variables in the feature space and we used the vector notations. We want to express the normalisation integral using the feature space. The orthonormality of x) from eq. (5.17) implies that φi (x
Z
dzz fz2 = ξ T Lξ
(5.19)
where L is a diagonal matrix with σ2i on the diagonal. The modified Gaussian distribution of the feature space variables is be written as: ¯ ° ¯ i° 1 1h ξ T Lξ L) ξ ξ) ∝ exp − ξ T ξ + λξ ∝ exp − ξ T (IIF + λL pλ (ξ 2 2
(5.20)
and this change implies that the kernel for the “effective GP” is x)f(x x ′ )iλ = hf(x
X
x)φ(x x ′) φ(x
i
σ2i 1 + λσ2i
(5.21)
where the initial projection into the feature space and the modified distribution of the random variables in that feature space was used. The final form of the GP kernel is found by observing that K λ has the −1 same eigenfunctions but the eigenvalues are (σ−2 , thus i + λ)
´−1 ³ I Σ0 )−1 . Σ λ = Σ −1 = Σ 0 (II + λΣ 0 + λI 81
(5.22)
Chapter 5. Applications As a result of previous transformations, the normalising term from the likelihood was eliminated by adding λ to the model parameters.5 This simplifies the likelihood, but for each λ we have different GP kernel, and to find the most probable density, we have to integrate over λ, this is not feasible in practise. x|D) from eq. (5.16) with a GP in such a way that we Our aim is to approximate the posterior p(x are able to apply the representation lemma from Chapter 2. For this we first eliminate the integral with respect to λ and then approximate the kernel in the effective Gaussian from eq. (5.22). The integral over λ is eliminated using a maximum a-posteriori (MAP)approximation. We compute λm that maximises the log-integrand in eq. (5.16). Setting its derivative to zero leads to i h Q R N 2 2 x f f dx E λ x m i=1 i N hQ i . = N λm E f2
(5.23)
ignore the subscript. The predictive density becomes h Q i N 2 2 f f E λ λ x i=1 i h i . x|D) ≈ p(x N E QN f2
(5.24)
λm
i=1 i
We replace the integral over λ with its value at λm and to simplify the notations, in the following we
λ
i=1 i
Using this approximation to the predictive density, we can employ the parametrisation lemma and the sequential algorithms, as in the previous cases, to infer a posterior process. We observe that in the numerator of eq. (5.24) we have a product of single data likelihoods f2i , this time without the
normalisation as in in eq. (5.12), and the denominator is the normalisation required by the posterior. The application of the EP algorithm for this modified GP becomes straightforward. For a fixed λ we use the “effective GP” from eq. (5.22) as the prior process. We iterate the EP learning from Chapter 4 α, C ). The parameters also and obtain a posterior process with the data-dependent parameters (α α, C ). depend on λ, thus the complete GP will be characterised with the triplet, which we denote GP λ (α Changing the GP parameters changes λ, thus at the end of each EP iteration we recompute λ, this
α, C ). Using the posterior GP in eq. (5.23), the re-estimation equation for λ is time fixing (α Z £ ¤ N x EGP λ fx2 = dx new λ
(5.25)
and we can iterate the EP algorithm using the new GP.
The problem is finding the kernel that corresponds to the “effective GP λ ”. Finding Σ λ or general
kernels requires the eigenvalues of the kernel, or an inverse operation in the feature space. This is
seldom tractable analytically, we mention different approaches to address this inversion applied to density estimation. One is to find the inverse operator by numerically solving eq. (5.22), employed by Nemenmann and Bialek [2001], although this is extremely time-consuming. A different solution is to use the operator product expansion in [Schmidt 1998]: ¡ ¢ Σ 0 + λ2 Σ 0 · Σ 0 − . . . Σ λ = Σ 0 1 − λΣ
(5.26)
to obtain Σ λ . Apart from being, again, computationally expensive, this expansion is unstable for large λ values. 5 The introduction of λ, a parameter to be estimated from the data, in the structure of the prior GP makes the esetimation not consistent with the Bayesian framework. This is not a problem in this section since we are using MAP approximations to the density function.
82
Chapter 5. Applications 12 10 8 6 4 2 0 −2 −4 0
0.2
0.4
0.6
0.8
1
x, x ′ ) for x = 0 (continuous line) and x = 0.4 (dashed line). Figure 5.8: The kernel K0 (x A simplification of the inversion problem is to choose the prior kernels in a convenient fashion such as to provide tractable models. A choice for the operator for one-dimensional inputs was l2 ∂2x , used by Holy [1997] to estimate densities. This operator implies the Ornstein-Uhlenbeck kernels for GP λ : ¶ µ 1 l (5.27) Kλ (x, x ′ ) = √ exp − √ |x − x ′ | . 2 λl λ Since λ increases with the size of the data, the resulting density function, being a weighted sum of kernel functions, will be very rough. A different simplification is obtained if we choose the prior operator Σ 0 such that Σ 0 · Σ 0 = Σ 0 .
This means that all eigenvalues are equal σ2i = 1 and the inverse from eq. (5.22) simplifies to Σλ =
1 Σ0. λ+1
If we use one-dimensional inputs from the interval [0, 1] and consider a finite-dimensional function space with elements x) = c0 + f(x
k0 √ X x + bn cos 2πnx x) 2 (an sin 2πnx
(5.28)
n=0
where an , bn , and c0 are sampled randomly from a Gaussian distribution with zero mean and unit variance. It is easy to check that the 2k0 + 1 functions from eq. (5.29) are orthonormal. Since we know that the eigenvalues are all equal to 1, this kernel is idempotent Σ · Σ = Σ , thus the inversion is reduced to a division with a constant. We compute the kernel that generates these functions: x, x ′ ) = hf(x x), f(x x ′ )i0 K0 (x =1+2
k0 X
x sin 2πnx x ′ + cos 2πnx x cos 2πnx x ′) (sin 2πnx
(5.29)
n=1
x − x ′ )) + sin(2πk0 (x x − x ′ )) cot(π(x x − x ′ )) = − cos(2πk0 (x where the average is taken over the set of random variables (an , bn ) and c0 . Fig. 5.8 shows the kernel for k0 = 5 and the experiments were performed using this kernel. Next we have to solve eq. (5.25) to find λm . We assume that we are at the end of the first iteration, when λ = 0 on the RHS. In this case eq. (5.25) simplifies and we obtain N = λ
Z1 0
N X ¢ ¡ xi , x j ) (αi αj + Cij ) x µx2 + σx2 = 2k0 + 1 + K0 (x dx ij
83
(5.30)
Chapter 5. Applications 4 3.5
−1
10
GP approximation Data distrib. BVs
3
−2
10
2.5 2
−3
10
1.5 −4
1
10
0.5 0 0
−5
0.2
0.4
0.6
0.8
10
1
0
2
4
(a)
6
8
10
(b)
Figure 5.9: GP approximation to the probability density function. Sub-figure (a) shows the density function (dashed line), its approximation (continuous line), and the elements of the BV set (the + signs on the X-axis). Sub-figure (b) gives the evolution of the L2 difference between the original and the approximating pdf, measured using evenly distributed grid points. The X-axis shows the number of the EP-iterations made. where we used the reproducing property of the kernel and expressed the predictive mean and covariance α, C ): at x using the representation given by the parameters (α µx =
p X
xi , x ) = kxT α αi K0 (x
i=1
σx2
x, x ) + = K0 (x
p X
(5.31) ∗
x, x i )Cij K0 (x xj , x ) = k K0 (x
+ kxT Ckx
ij=1
with p the size of the BV set.
To apply online learning, we have to compute the average over the likelihood. Assuming that we
α, C ), we need to compute the average with respect to N (k kTt+1α , k∗ + have an approximation to the GP(α
k Tt+1Ck t+1 ) = N (µt+1 , σ2t+1 ), the marginal GP at x t+1 . The averaged likelihood is hf2t+1 it+1 = µ2t+1 + σ2t+1 , and the update coefficients are the first and the second derivatives of the log-average
(from eq. 2.42) (t+1)
q
2µt+1 = 2 µt+1 + σ2t+1
and
(t+1)
r
¢ ¡ 2 σ2t+1 − µ2t+1 = ¡ ¢2 . µ2t+1 + σ2t+1
We used an artificial dataset generated from a mixture of two Gaussians, plotted with dashed lines in Fig. 5.9.a. The size of the data set in simulations was 500 and we used k0 = 5 for the kernel parameter. The learning algorithm was the sparse EP learning as presented in Chapter 4 with the BV set size not fixed in advance. We allowed the BV set to be updated each time the score of a new
input was above the predefined threshold, since for this toy example, the dimension of the feature space is 2k0 + 1. The KL-criterion prevents a the BV set from becoming larger than the dimension of
the feature space, thus there is no need for pruning the GPs.
To summarise, this section outlined a possibility to use GPs for density estimation. The applicability of the model in its present form is restricted, we gave results only for one-dimensional density modelling. The essential step in obtaining this density model was the transformation of the problem such that the iterative GP algorithms were made applicable. This was achieved by choosing special kernels corresponding to operators satisfying Σ · Σ = Σ , condition needed to simplify the operator 84
Chapter 5. Applications inversion eq. (5.26). Further simulations could be made using higher-dimensional inputs for which these kernels are also computable, however we believe that the basic properties of this model are highlighted using this toy example. The GP density estimation has certain benefits: contrary to mixture density modelling, it does not need a predefined number of mixture components. The corresponding entity, the BV set size in this
model is determined automatically, based on the data and the hyper-parameters of the model. An other advantage is computational: we do not need to store the full kernel matrix, opposite to the case of SVMs [Weston et al. 1999] or the application of the kernel PCA [Girolami 2002]. A drawback of the model, apart from the need to find the proper hyper-parameters, is that the convergence time can be long, as it is shown in Fig. 5.9.b. More theoretical study is required for speeding up the convergence and making the model less dependent on the prior assumptions.
5.4
Estimating wind-fields from scatterometer data
In this section we consider the problem of data assimilation where we aim to build a global model based on spatially distributed observations [Cressie 1993]. GPs are well suited for this type of application, providing us with a convenient way of relating different observations. The data was collected from the ERS-2 satellite [Offiler 1994] where the aim is to obtain an estimate of the wind fields which the scatterometer indirectly measures using radar backscatter from the ocean surface. There are significant difficulties in obtaining the wind direction from the scatterometer data, the first being the presence of symmetries in the model: wind fields that have opposite directions result in almost equal measurements [Evans et al. 2000; Nabney et al. 2000a], making the wind field retrieval a complex problem with multiple solutions. Added the inherent noise in the observations increases the difficulty we face in the retrieval process. Current methods of transforming the observed values (scatterometer data, denoted as a vector s i at a given spatial location x i ) into wind fields can be split into two phases: local wind vector retrieval and ambiguity removal [Stoffelen and Anderson 1997] where one of the local solutions is selected as the true wind vector. Ambiguity removal often uses external information, such as a Numerical Weather Prediction (NWP) forecast of the expected wind field at the time of the scatterometer observations. Nabney et al. [2000b] have recently proposed a Bayesian framework for wind field retrieval combining a vector Gaussian process prior model with local forward (wind field to scatterometer) or inverse models. The backscatter is measured over 50 × 50 km cells over the ocean and the number of observations acquired can be several thousand, making GPs hardly applicable to this problem.
In this section we build a sparse GP that scales down the computational needs of the conventional GPs, this application was presented in [Csat´o et al. 2001].
5.4.1
Processing Scatterometer Data
We use a mixture density network (MDN) [Bishop 1995] to model the conditional dependence of the local wind vector z i = (ui , vi ) on the local scatterometer observations s i : pm (zzi |ssi , ω ) =
4 X
βij φ(zzi |ccij , σij )
(5.32)
j=1
where ω is the union of the MDN parameters: for each observation at location x i we have the set weightings βij for the local Gaussians φ(ccij , σ2ij ) where c ij is the mean and σ2ij is the variance. The 85
Chapter 5. Applications
MDN network
Figure 5.10: The outputs of the mixture density network (MDN) when applied to raw scatterometer observations. Each arrow points into the direction of the respective wind field component from the mixture, longer arrows represent larger wind speeds. The spatial locations were obtained independently, using the outputs of the same MDN for the scatterometer data at each separate location. parameters of the MDN are determined using an independent training set [Evans et al. 2000] and are considered known in this section. The MDN with four Gaussian component densities captures the ambiguity of the inverse problem. An example of a 10 × 10 field produced by the MDN is shown in Fig 5.10. We see that for the majority
of the spatial locations we have symmetries in the MDN solution: the model prefers a speed, but the orientation of the resulting wind-vector is uncertain.
In order to have a global model from the N wind vectors obtained by local inversion using eq. (5.32), we combine them with a zero-mean vector GP [Cornford et al. 1999; Nabney et al. 2000b]: ÃN ! Y W 0) p(ssi |zzi ) p0 (zz|W q(zz) ∝ i
and instead of using the direct likelihood p(ssi |zzi ), we transform it using Bayes theorem again to obtain: q(zz) ∝
ÃN ! Y pm (zzi |ssi , ω )p(ssi ) i
W 0i ) p0 (zzi |W
W 0) p0 (zz|W
(5.33)
where z = [zz1 , . . . , z N ]T is the concatenation of the local wind field components z i . These components are random variables corresponding to a spatial location x i . These locations specify the prior W 0 (x xi , x j )}N covariance matrix for the vector z , given by W 0 = {W ij=1 . The two-dimensional Gaussian p0 is the prior GP marginalised at zi , with zero-mean and covariance W 0i . The prior GP was tuned carefully to represent features seen in real wind fields. Since all quantities involved are Gaussians, we could, in principle, compute the resulting probabilities analytically, but this computation is practically intractable: the number of mixture elements from q(zz) is 4N which is extremely high even for moderate values of N. Instead, we will apply the online approximation to have a jointly Gaussian approximation to the posterior at all data points.
86
Chapter 5. Applications
2N
2N
[t+1]
K0
[t+1]
I2
2t
K0
2t
I 2N 2t
2t+2
2t
2t+2
Figure 5.11: Illustration of the elements used in the update eq. (5.38).
5.4.2
Learning vector Gaussian processes
x, y ) is a 2 × 2 matrix, specifying the pairwise crossDue to the vector GP, the kernel function W 0 (x correlation between wind field components at different spatial positions. The representation of the posterior GP thus requires vector quantities: the marginal of the vector GP at a spatial location x has a bivariate Gaussian distribution with mean and covariance function of the vectors zx ∈ R2 represented as
hzzx i =
N X i=1
x, x i ) · αz (i) W 0 (x
x, y ) + Σ (zzx , zy ) = W 0 (x
N X
i,j=1
(5.34) x, x i ) · Cz (ij) · W 0 (x xj , y ) W 0 (x
Cz (ij)}i,j=1,N of the vector GP. Since this form is not convenient, where αz (1), αz (2), . . . , αz (N) and {C we represent (for numerical convenience) the vectorial process by a scalar process with twice the number of observations, i.e. we set hfx u i hzzx i =
and
hfx v i
xu , y u ) K0 (x xu , y v ) K0 (x x, y ) = W 0 (x xv , y u ) K0 (x xv , y v ) K0 (x
(5.35)
x, y ) is a scalar valued function which we are going to use purely for notation. Since we where K0 (x are dealing with vector quantities, we will never have to evaluate the individual matrix elements. K0 serves us just for re-arranging the GP parameters in a more convenient form. By ignoring the superscripts v and u, we can write hfx i =
2N X
x, x i )α(i) K0 (x
i=1
x, y ) + Σ (fx , fy ) = K0 (x
2N X
(5.36) x, x i )C(ij)K0 (x xj , y ) K0 (x
i,j=1
where α = [α1 , . . . , α2N ]T and C = {C(ij)}i,j=1,...,2N are rearrangements of the parameters from eq. (5.34). For a new observation s t+1 we have a a local ”likelihood” from eq. (5.33): pm (zzt+1 |sst+1 , ω )p(sst+1 ) W 0,t+1 ) pG (zzt+1 |W
87
Chapter 5. Applications NWP Prediction
Most frequent online result
(a)
(b)
Symmetric solution
Bad solution
(c)
(d)
Figure 5.12: The NWP wind field estimation (a), the most frequent (b) and the second most frequent (c) online solution together with a bad solution. The assessment of good/bad solution is based on the value of the relative weight from Section 5.4.3. The gray-scale background indicates the model confidence (Bayesian error-bars) in the prediction, darker shade is for smaller variance. α, C ) is based on the average of this local likelihood with respect and the update of the parameters (α to the marginal of the vectorial GP at x t+1 : À ¿ pm (zzt+1 |sst+1 , ω )p(sst+1 ) g(hzzt+1 i) = W 0,t+1 ) pG (zzt+1 |W Nx
(5.37)
zt+1 ) (z t+1
where Nx t+1 (zzt+1 ) is the marginal of the vectorial GP at x t+1 and hzzt+1 i is the value of the mean function at the same position. The function g(hzzt+1 i) is easy to compute, it involves two dimensional
Gaussian averages. To keep the flow of the presentation we deferred the calculations of g(hzzt+1 i) and its derivatives to Appendix F. Using the differential of the log-averages with respect to the prior mean vector at time t + 1, we have the updates for the GP parameters α and C : ∂ ln g(hzzt+1 i) ∂hzzt+1 i [t+1] [t+1] with v t+1 = C tK 0 + I2 2 z ∂ ln g(hz t+1 i) T v t+1 = C t + v t+1 ∂hzzt+1 i2
α t+1 = α t + v t+1 C t+1
(5.38)
[t+1]
and hzzt+1 i is 2 × 1 a vector, implying vector and matrix quantities in (5.38). The matrices K 0
and
I[t+1] are shown in Fig. 5.11. 2
Fig. 5.12 shows the results of the online algorithm applied on a sample wind field having 100 nodes on an equally spaced lattice. In subfigure (a) the predictions from the Numerical Weather Prediction (NWP) are shown as a reference to our online GP predictions, shown in sub-figures (b)-(d). The
88
Chapter 5. Applications
( , )
f2 f1
µ2 Σ2 111111111111111111111111 000000000000000000000000 000000000000000000000000 111111111111111111111111 000000000000000000000000 111111111111111111111111 000000000000000000000000 000000000000000000000000 111111111111111111111111 (µ111111111111111111111111 000000000000000000000000 111111111111111111111111 1, Σ1) 000000000000000000000000 111111111111111111111111 000000000000000000000000 111111111111111111111111 000000000000000000000000 111111111111111111111111 000000000000000000000000 111111111111111111111111 000000000000000000000000 111111111111111111111111 000000000000000000000000 111111111111111111111111 000000000000000000000000 2 1 111111111111111111111111 000000000000000000000000 111111111111111111111111 000000000000000000000000 111111111111111111111111 000000000000000000000000 111111111111111111111111 000000000000000000000000 111111111111111111111111
I
I
Figure 5.13: The illustration of computing the computation of the relative weights. processing order of each node appears to be important for this case: depending on the order we have a solution agreeing with the NWP results as shown in sub-figures (b) and (d), on other occasions the online GP had a clearly suboptimal wind field structure, as shown in subfigure (d). However, we know that the posterior distribution of the wind field given the scatterometer observations is multi-modal, with in general two dominating and well separated modes. The variance in the predictive wind fields resulting from different presentation orders is a problem for the online solutions: we clearly do not know in advance the preferred presentation order, and this means that there is a need to empirically assess the quality of each resulting wind field, this will be presented in the next section.
5.4.3
Measuring the Relative Weight of the Approximation
An exact computation of the posterior process, as it has been discussed previously, would lead to a multi-modal distribution of wind fields at each data-point. This would correspond to a mixture of GPs as a posterior rather than to a single GP that is used in our approximation. If the individual components of the mixture are well separated, we may expect that our online algorithm will track modes with significant underlying probability mass to give a relevant prediction. However, the mode that will be tracked depends on the actual sequence of data-points that are visited by the algorithm. To investigate the variation of our wind field prediction with the data sequence, we have generated several random sequences and compared the outcomes based on a simple approximation for the relative mass of the multivariate Gaussian component. To compare two posterior approximations obtained from different presentations of the same data, ^ ) can be written as a sum of Gaussians that are well we assume that the marginal distribution (^ z, Σ separated. At the online solutions z^ we are at a local maximum of the pdf, meaning that the sum from the mixture of Gaussians is reduced to a single term. This means that −2N/2 ^ −1/2 q(^ z ) ∝ γl (2π) |Σ |
(5.39)
with q(^ z ) from eq. (5.33), γl the weight of the component of the mixture to which our online algorithm ^. had converged, and we assume the local curvature is also well approximated by Σ
89
Chapter 5. Applications ^ 1 ) and (^ ^ 1 ), we find from eq (5.39) that the proporHaving two different online solutions (^ z1, Σ z1, Σ tion of the two weights is given by
^ 1 |1/2 z1 )|Σ q(^ γ1 = ^ 2 |1/2 γ2 q(^ z 2 )|Σ
(5.40)
as illustrated in Fig. 5.13. This helps us to estimate the “relative weight” of the wind field solutions: log γ = log q(^ z) +
^| log |Σ 2
(5.41)
helping us to assess the quality of the approximation we obtained. Results, using multiple runs on a wind field data confirm this expectation, the correct solution (Fig. 5.14.b) has large value and high frequency if doing multiple runs. For the wind field example shown in Fig. 5.12 100 random permutations of the presentation were made. The resulting good solutions, shown in subfigure (b) and (c) always had the logarithm of the relative weight larger than 90 whilst the bad solutions had the same quantity at ≈ 70.
5.4.4
Sparsity for vectorial GPs
The sparsity for the vectorial GP is also based on the same minimisation of the KL-distance, as for the scalar GPs. The only difference from Chapter 3 is that here we have a vectorial process. Using the transformed notations from eq. (5.36), the vectorial GP means that the removal and addition operations can only be performed in pairs. The BV set, for the transformed GP has always an even v number of basis vectors: for each spatial location x i the BV set includes x u i and x i . If removing x i , we
have to remove both components from the BV set. The pruning is very similar to the one-dimensional
case. The difference is that the elements of the update are 2 × 2 matrices (cc∗ and q ∗ ), p × 2 vectors
C∗ and Q ∗ ), and the 2 × 1 vector α ∗ , the decomposition is the same as showed in Fig. 3.3. Using (C
this decomposition the KL-optimal updates are
C∗ + Q ∗ ) (cc∗ + q ∗ )−1 α ∗ ^ = α (t) − (C α ^ = Q (t) − Q ∗q ∗(−1)Q ∗T Q
(5.42)
T ^ = C (t) + Q ∗q ∗(−1)Q ∗T − (C C∗ + Q ∗ ) (cc∗ + q ∗ )−1 (C C∗ + Q ∗ ) C
α, C) are the GP parameters. where Q−1 is the inverse Gram matrix and (α v The quality of the removal of a location x i (or the two virtual basis vectors x u i and x i ) is measured
by the approximated KL-distance from Chapter 3, leading to the score −1 εi = α Ti (cc∗ + q ∗ ) α i
(5.43)
where the parameters are obtained from the 2N × 2N matrix using the same decomposition shown in Fig 3.3.
The results of the pruning are promising: Fig. 5.14 shows the resulting wind field if 85 of the spatial knots are removed from the presentation eq. (5.36). On the right-hand side the evolution of the KL-divergence and the sum-squared errors in the means between the vector GP and a trimmed GP using eq. (5.42) are shown as a function of the number of deleted points. Whilst the approximation of the posterior variance decays quickly, the predictive mean is stable when deleting nodes. The sparse solution from Fig. 5.14 is the result of combining the non-sparse online algorithm with the KL-optimal removal, the two algorithms being performed one after the another. This means that
90
Chapter 5. Applications 85% removed Error measures 5 4.5
Squared dist. of the means KL−divergence
4 3.5 3 2.5 2 1.5 1 0.5 0
10
20
30
40
(a)
50
60
70
80
90
100
(b)
Figure 5.14: (a) The predicted wind fields when 85% of the nodes has been removed (from Fig. 2.2). The prediction is based only on basis vectors (circles). The model confidence is higher at these regions. (b) The difference between the full solution and the approximations using the squared difference of means (continuous line) and the KL-distance (dashed line) respectively. we still have to store the full vector GP and the costly matrix inversion is still needed, the difference from other methods is that the inversion is sequential. Applying the sparse online algorithm without the EP re-learning steps lead to significant loss in the performance of the online algorithm, this is due to the more complex multimodal “likelihoods” provided by the MDNs that give rise to local symmetries in the parameter space. We compensated for this loss by using additional prior knowledge. The prior knowledge was the wind vector at each spatial location from a NWP model and we included this in the prior mean function. This leads to better performance since we are initially closer to the solution than using simply a zero-mean prior process. The performance of the resulting algorithm is comparable to the combination of the full online learning with the removal and the result is shown in Fig. 5.14.b. For the wind-field example the EP algorithm from Chapter 4 has not been developed yet. Future work will involve testing the sparse EP algorithm applied to the wind-field problem. As seen for the classification case, the second and third iteration through the data improved the performance. By performing the multiple iterations for the spatial locations we expect to have a better approximation for the posterior GP for this case also. Some improvement is also to be expected when estimating the relative weight of a solution from eq. (5.41), especially since here an accurate estimation of the posterior covariance is essential. To conclude, we showed that the wind-field approximation using sparse GPs is a promising research direction. We showed that a reduction of 70% of the basis points lead to a minor change in the actual GP, measured using the KL-distance. The implementation and testing of the sparse EP algorithm for this special problem is also an interesting question. We estimated the wind-fields by first processing the raw scatterometer data using the local inverse models into a mixture of Gaussians as shown in Fig 5.10. The GP learning algorithm used the product of these local mixtures. Further investigations are aimed at implementing the GPs based on likelihoods directly from the scatterometer observations. Since the dependence of the wind-field on the
91
Chapter 5. Applications scatterometer observation is given by a complex forward model, we need to perform approximations to compute g(hzzi) and to benchmarks the results with previous ones.
A modification of the model in a different direction is suggested by the fact that the mixtures tend
to have two dominant modes, this resulting from the physics of the system. The same bimodality has also been found in empirical studies [Nabney et al. 2000a]. It would be interesting to extend the sparse GP approach to mixtures of GPs in order to incorporate this simple multi-modality of the posterior process in a principled way.
5.5
Summary
We presented results for various problems solved using the sparse GP framework with the aim of showing the applicability of the algorithm to a large class of likelihoods. Sparseness for the quadratic regression case showed performance comparable with the full GP regression, tested with artificial and real-world datasets. The additional EP iterations were beneficial only if the BV set size was very low,
but generally did not improved the test errors. This was not the case for the classification problems, where we showed both the applicability of the sparse GP learning and the improved performance with multiple sweeps through the data. The performance of the algorithm with the classification problem was also tested on the relatively large USPS dataset having 7000 training data. Despite of the fact that only a fraction of the data was retained, we had good performance. An interesting research direction is to extend sparse GP framework to the robust regression, i.e. non-Gaussian noise distributions like Laplace noise. However, we believe that this would be beneficial only if a method of hyper-parameter selection could be proposed. The application of the GPs to density estimation at the present time is very restrictive: we considered one-dimensional data and special kernels. For this case the EP steps proved to be very important, several iterations were needed to reach a reasonable solution. However the solution is attractive: we showed the possibility to infer multi-modal distributions without specifying the number of peaks in the distribution. A real-world application is the sparse GP inference of wind-fields from scatterometer observations. Previous studies [Cornford et al. 1999] shown that this problem in not unimodal, our sparse GP tracks a mode of the posterior distribution. This being a work in progress, we expect more positive results from the implementation and testing of the EP algorithms for the wind fields. Discussion about more general future research topics like model selection can be found in the next chapter.
92
Chapter 6 Conclusions and Further Research The application of the family of Gaussian processes to real problems is impeded by the intractability of the the posteriors or the quadratic scaling of the algorithm with the size of the dataset. The contribution of this thesis is to provide a methodology for the application of GPs to large datasets via a representation of the posterior process and a fixed size of the parameter set, eliminating its prohibitive scaling with growing data sizes. To achieve this independence, we needed • a parametrisation lemma for the moments of the posterior process as a linear combination of kernel function at the training set positions, and
• a subset of the training data, the Basis Vector set (BV set) that replaces the full training set when representing the posterior process.
The lemma, given in Chapter 2, transformed the problem of functional inference into the estimation of the GP parameters. The parametrisation of the approximating GP resembles the popular representer theorem of Kimeldorf and Wahba [1971] that expresses the most probable (MAP) solution as a linear combination of the kernel functions at data locations. In contrast to the representer theorem, in Lemma 2.3.1 we also considered the posterior kernel. The approach to modeling using GPs is thus fully probabilistic. In our opinion the proposed method of inference via estimation of both GP moments is advantageous over the commonly used MAP-based approximations which represent the state-of-the-art in kernel methods. Apart from the possibility of assessing uncertainty in the prediction, the use of the approximated kernel in learning speeds up the online algorithm. This is similar to the natural gradient methods for parametric models, where the covariance matrix is used to rescale the parameter space to provide an optimal search direction. In Chapter 2 we used Bayesian online learning [Opper 1996] to find the posterior GP. This is a sequential algorithm that considers a single example from the training set. In this framework the restrictions over the likelihood are very mild: the requirement is that the Gaussian average of it to be differentiable. The online learning is thus applicable for a large class of likelihoods which includes for example the non-differentiable step function for classification, for which other approximation methods usually fail. The parametrisation lemma with Bayesian online learning provided the resulting GP using all data points with the parameters scaling quadratically with the size of the data. Apart from being inapplicable, this parametrisation was also unrealistic: by learning we implicitly meant a compression of the information contained in the data into the set of parameters. By having the number of parameters scaling quadratically with the size of the data, there is no compression.
93
Chapter 6. Conclusions and Further Research We derived a further approximation to the online solution, presented in Chapter 3. By having a subsequent projection of the posterior to a process with less parameters than the original approximation, only a fraction of the training data was used in representing the posterior process, this subset of the data is called the set of Basis Vectors. The important factor in obtaining the sparse approximation was our ability to compute the KL-distance between two GPs, derived in Section 3.2. This distance served both to obtain the sparse projection of the online GP and to estimate the error made by this projection. It must be mentioned that, although only a fraction of the training data is used for GP prediction, in learning we extracted information from the whole dataset. This is similar to the result of Support Vector Machine learning, where a sparse set of support vectors is used for generating predictions. The learning strategy, however, is different. For the sparse algorithm we were able to eliminate the scaling of the parameter set and to reduce the computing time to linear. In the basic SVM, indifferent of the degree of sparseness in the final result, the required memory to obtain the sparse results is still quadratic. The essential result of combining the Bayesian online learning from Chapter 2 with sparsity is the sparse online algorithm presented in Section 3.6. The algorithm possesses means to add new inputs to, and remove unwanted inputs from the BV set, thus providing us with full flexibility in manipulating the BV set. Additionally, we were able to find a score corresponding to each BV that measured the
error that would result from its removal. It was possible to obtain this score without actually removing the basis vector in question and without any matrix manipulation. We can thus apply online GPs to arbitrarily large datasets. The online nature of the algorithm with a single processing of each input is prohibitive for data sets with moderate sizes but for which the full GP representation still impractical. Our aim was to have a more accurate result than obtained from a single sweep through the data. A solution to this problem was proposed in Chapter 4. Considering recent improvements on the online learning both from statistical physics [Opper and Winther 2001] and the algorithmic [Minka 2000] viewpoints, we derived a sparse algorithm that iteratively approximates the batch solution. The algorithm was based on the “expectation-propagation” (EP) algorithm presented by Minka [2000] and was extended to give sparse solutions. In Chapter 5 the sparse EP algorithm is applied to various problems. For quadratic regression, which is analytically tractable, the results confirmed that, compared to the result of the full GP algorithm, there is no significant loss in applying the sparse solution. The EP iterations proved to be beneficial in classification where the test error was consistently lower after subsequent EP-steps. In additionally to the improved performance, the fluctuations caused by the order of the presentation had also diminished. We also showed that the sparse GP algorithm can be applied to various likelihoods like density estimation or the specific data assimilation problem for the wind fields. We believe that the general parametrisation of the posterior processes and the KL-divergences opens new possibilities in applying kernel methods. It allows, without significant additional complexity, the representation of uncertainty, a feature that at present time is missing from the family of kernel methods. The cost of estimating uncertainties is the learning and memorisation of matrix C that parametrises the kernel. This cost is greatly compensated by the full flexibility in setting up the size of the parameters, making the sparse GP or EP algorithm highly competitive with respect to several kernel algorithms in various application areas.
94
Chapter 6. Conclusions and Further Research
6.1
Further Research Directions
We envisage further research in several directions: • to improve the computational efficiency of the algorithm; • to apply to other likelihoods; and • to address the problems of estimating hyperparameters and model selection and the use of non-Gaussian process priors.
The issue of computational efficiency is important in practical applications. We saw that the sparse online algorithm, due to its greedy nature, had its running time scaling linearly with the data while at the same time the number of parameters was kept constant. The sparse EP algorithm, which had multiple iterations for each input, was more demanding, with quadratic and linear scalings of computing time and size of parameters respectively. The bad scaling of the latter algorithm was due to the need to memorise additional information about each processed data point. We can reduce the computational overhead of the algorithm by first selecting the relevant BV set from the available data. This can be done either by random selection, or by
examining the scores of the training data and including sequentially the ones with the highest score.
The random selection of the BV set would be feasible for low-dimensional data where we can hope for
a relatively even spread of the random selection in the input space. The second strategy would assure an optimal representation of the training data, with the additional cost of evaluating the score after every inclusion step. We foresee that the increase in test error made by fixating the BV set would not be significant but the scaling of the computational time would be reduced by an order of magnitude.
The second direction to go would be the application of the sparse GPs to nonstandard likelihoods. A particularly interesting question is whether we could apply GP inference to time-varying systems to include simple dynamics, or to consider GP treatments of ICA models. However, we believe that the most important issue to address is the hyper-parameter adjustment, or model selection within the sparse GP framework. For this we see that the EP framework provides us an approximation to the data likelihood using the approximated likelihood terms. In addition to the sparse online learning, we have multiple iterative learning of the GP parameters, we could thus adjust some of the hyperparameters of the model by gradient ascent, for example, to increase the data likelihood. This could include the variance of the assumed noise for regression, or the steepness of the probit model in the classification case. However, changing the model parameters should involve corresponding changes in the GP parameters or the retraining of the whole GP with the new model, the exact form requires more study. An interesting research direction would be to address the selection of the parameters of the kernel itself, like the width parameter in the RBF kernel or the order of the polynomial used in polynomial kernels. Equally, one could consider the assessment of the relevance of the input components, similarly to the case of automatic relevance determination [MacKay 1999] for the case of sparse Gaussian processes where the size of the BV set is fixed. Simple improvements on the sparse EP algorithm are also planned in the future.
Lastly, it would be interesting to extend the single GP latent variable model to mixtures of GPs. Using the sparse EP algorithm to estimate the individual GPs is feasible, though we might need an EM-like algorithm.
95
Appendix A Matrix inversion formulae
Throughout the thesis we are using the matrix inversion lemma: having quadratic matrices A and B and a matrix X of corresponding number of columns and rows, we have the following equality (see for example [Mardia et al. 1979, Appendix B] or [Press et al. 1992]) ´−1 ³ B−1 + X T A −1X )−1X T A−1 . = A −1 − A −1X (B A + XBX T
(A.1)
The matrix inversion formula for a symmetric matrix with block sub-matrices is: "
where
#−1
A
B
BT
C
=
"
=
" A −1 + A −1BE −1B T A −1
D −1
A−1BE −1 −A
E−1B T A −1 −E
E −1
C−1B T E −1 −C
#
(A.2) E−1BC −1 −E
C −1 + C −1B T D −1BC −1
#
(A.3)
D = A − BC −1B T E = C − B T A −1B
The formulae for the determinants of block matrices are also used in the thesis: ¯ ¯ ¯ A B¯ ¯ ¯ A| |E E| = |C C| |D D| ¯ = |A ¯ T ¯B C¯
(A.4)
A useful short guide to manipulating block matrices and computing determinants is provided by
Sam Roweis, available at http://www.gatsby.ucl.ac.uk/~roweis/notes.html.
96
Appendix B Properties of zero-mean Gaussians
The following property of the Gaussian probability density functions (pdfs) is often used in this paper, here we state it in a form of a theorem: x) zero-mean Gaussian pdf with covariance Σ = {Σij } (i, j from 1 to Theorem 1. Let x ∈ Rm and p(x
m). If g : Rm → R is a differentiable function not growing faster than a polynomial and with partial derivatives
x) = ∂j g(x
then
Z
xp(x x) xi g(x x) = dx Rm
∂ x) , g(x ∂xj
m X
Σij
j=1
Z
xp(x x) ∂j g(x x) . dx
(B.1)
Rm
In the following we will assume definite integration over Rm whenever the integral appears. Alternatively, using the vector notation, the above identity reads: Z Z xp(x x) x g(x x) = Σ dx xp(x x) ∇g(x x) dx For a general Gaussian pdf with mean µ the above equation transforms to: Z Z Z xp(x x) x g(x x) = µ dx xp(x x) g(x x) + Σ dx xp(x x) ∇g(x x) dx
(B.2)
(B.3)
Proof. The proof uses the partial integration rule: Z Z xp(x x)∇g(x x) = − dx xg(x x)∇p(x x) dx where we have used the fast decay of the Gaussian function to dismiss one of the terms. Using the derivative of a Gaussian pdf. we have: Z Z xp(x x)∇g(x x) = dx x g(x x)Σ−1x p(x x) dx Multiplying both sides with Σ leads to eq. (B.2), completing the proof. For the nonzero mean the deductions are also straightforward.
97
Appendix C Iterative computation of the inverse Gram matrix
In obtaining sparsity in eqs. (3.19) and (3.21), we need the inverse Gram matrix of the BV set. In
the following the elements of the BV set are indexed from 1 to t. Using the matrix inversion formula, eq. (A.2), the addition of a new element is done sequentially. This is well known, commonly used in the Kalman filter algorithm. We consider the new element at the end (last row and column) of matrix K t+1 . The matrix K t+1 is decomposed: K t+1 =
"
Kt
k t+1
k Tt+1
k∗t+1
#
(C.1)
Assuming K −1 known and applying the matrix inversion lemma for K t+1 : t K −1 t+1
=
=
"
Kt
k t+1
#−1
k Tt+1 k∗t+1 " −1 T −1 −1 K −1 t + K t k t+1k t+1K t γt+1 −1 kTt+1K −1 −k t γt+1
−1 K−1 −K t k t+1 γt+1
γ−1 t+1
#
(C.2)
where γt+1 = k∗t+1 − k Tt+1K −1 t k t+1 is the squared distance of the last feature vector from the linear ^t+1 from eq. (3.3), K −1 span of all previous ones (see Section 3.1). Using notations K −1 t k t+1 = e t = Qt, and K −1 t+1 = Q t+1 we have the recursion: Q t+1 =
" ^t+1e^Tt+1 Q t + γ−1 t+1e ^Tt+1 −γ−1 t+1e
^t+1 −γ−1 t+1e γ−1 t+1
#
(C.3)
and in a more compact matrix notation: Q t+1 = Q t + γ−1 e t+1 − e t+1 )(^ e t+1 − e t+1 )T t+1 (^
(C.4)
where e t+1 is the t + 1-th unit vector. With this recursion equation all matrix inversion is eliminated (this result is general for block matrices, such implementation, together with an interpretation of the parameters has been also made in [Cauwenberghs and Poggio 2001]). The introduction of the rule γt+1 > 0 guarantees non-singularity of the Gram matrix (see Fig. 3.1).
98
Appendix C. Iterative computation of the inverse Gram matrix
C.1
Computing determinants
The block-diagonal decomposition of the Gram matrix from eq. (C.1) allows us to have a recursive expression for the determinant. Using eq. (A.4), we have Kt | γt+1 Kt+1 | = |K Kt ||k∗t+1 − k Tt+1K −1 |K t k t+1 | = |K
(C.5)
where γt+1 is the squared distance of the new input from the subspace spanned by all previous inputs.
C.2
Updates for the Cholesky factorisation
For numerical stability we can use the Cholesky-factorisation of the inverse Gram matrix Q. Using the lower-triangular matrix R with the corresponding indices, and the identity Q = R T R , we have the update for the Cholesky-decomposition R t+1 =
Ã
Rt
0
−1/2
−γt+1 e^Tt+1
−1/2
γt+1
!
(C.6)
that is a computationally very inexpensive operation, without additional operations provided that the quantities γt+1 and e t+1 are already computed. In Chapter 3 the diagonal elements of the inverse Gram matrix are used in establishing the score for an element of the BV set, and the columns of the same Gram matrix are used in updating the GP elements. Fixing the index of the column to l, we have the l-th diagonal element and the columns expressed as γl = (r∗ )2 + r˜Tt−lr˜t−l # " r l r∗ + A T r t−l ∗ Q = ˜ T r˜l R
(C.7)
t−l
where we used the decomposition of R t+1 along the l-th column R l 0 l 0 l,t−l T R datat+1 = r∗ 0 Tt−l r l ˜ t−l A r˜t−l R
and the update of the Cholesky decomposition, when removing the l-th column is written as R 0 l l,t−l \l ´ R t = −1 ³ ˜ r rT −1 ˜ l A − t−l U Q U ∗ t−l r
with U being the Cholesky decomposition of IN−l +
˜ t−lq ˜T q t−l . (q∗ )2
(C.8)
This is always positive definite and
there is a fast computation for U (in matlab one can compute it with U=cholupdate(I,qN/q) with corresponding quantities).
99
Appendix D KL-optimal parameter reduction
^ t+1 ) with the last elements all having We want to find the constrained GP with parameters (^ α t+1 , C zero values (see Section 3.3) that minimises the KL-divergence ³ ´−1 ^ t+1 kGP t+1 ) = (α αt+1 − α αt+1 − α ^ t+1 ) C t+1 + K −1 ^ t+1 ) 2KL(GP (α t+1 ¯ h i ´³ ´−1 ¯¯ ¯³ −1 −1 −1 ¯ ¯ ^ t+1 − C t+1 )(C ^ Ct+1 + K −1 ) + tr (C − ln C + K C + K t+1 t+1 t+1 t+1 ¯ t+1 ¯
(D.1)
αt+1 , C t+1 ) and the BV set are given (we know K t+1 and K t ). and we suppose the GP parameters (α
In the following we use K −1 t+1 = Q t+1 and the decomposition of the GP parameters as presented in
Chapter 3, with Fig 3.3 repeated in Fig D.1. The differentiation with respect to parameters α ^ 1, . . . , α ^ t leads to the system of equations that is easily written in matrix form as i h Qt+1 + C t+1 )−1 (^ α t+1 − α t+1 ) = 0 I t 0 t (Q h i α t+1 − α t+1 ) = 0 B a (^
(D.2)
where I t is the identity matrix and 0 t is the column vector of length t with zero elements. In the second line the matrix multiplication has been performed and we used the decomposition " # B a −1 Qt+1 + C t+1 ) = (Q aT b
(D.3)
Finally, using the decomposition of the vector α t+1 from Fig. 3.3, we have ^ t+1 = α (r) + α∗e˜t+1 α
with
e˜t+1 = B −1a
and e˜t+1 is obtained from the matrix inversion lemma for block matrices from eq. (A.2). Using the Qt+1 + C t+1 )−1 from eq. (D.3) we have: matrix inversion lemma for (Q ³ ´−1 −1 aa T ¡ ¢−1 B B − −B a δ b with δ = b − a T Ba Q t+1 + C t+1 = −1 T a B δ −a δ
(D.4)
B−1a δ read from eq. (D.4), we have and using the correspondence δ = q∗ + c∗ and Q ∗ + C ∗ = −B e˜t+1 = −
1 Q∗ + C ∗ ) (Q q∗ + c∗ 100
(D.5)
Appendix D. KL-optimal parameter reduction
αt+1
Ct+1
Q t+1
1 .. t
α
C
C*
Q
Q*
t+1
α*
C*
c*
Q*
q*
t+1
1 .. t
t+1
(r)
(r)
1 .. t
(r)
Figure D.1: Grouping of the GP parameters (Fig 3.3 repeated). and replacing it into the expression for the reduced mean parameters, we have ^ t+1 = α(r) − α
c∗
α∗ Q∗ + C ∗ ) (Q + q∗
(D.6)
^ t+1 , we simplify the terms that include Before differentiating the KL-divergence with respect to C ^ t+1 in eq. (D.1). Firstly we write the constraints for the last row and column of C ^ t+1 using the C extension matrix [IIt 0t ] as
h ^ t+1 = I t C
0t
iT
h (r) ^ t+1 C It
0t
i
(D.7)
(r) ^ t+1 instead of ^ t+1 is a matrix with t rows and columns, and in the following we will use C where C (r) ^ C t+1 . Permuting the elements in the trace term of eq. (D.1) leads to ¸ ·h i h iT ^ t+1 I t 0 t (C Ct+1 + Q t+1 )−1 tr I t 0 t C · iT ¸ h i h ^ t+1 I t 0 t (C Ct+1 + Q t+1 )−1 I t 0 t (D.8) = tr C
Ct+1 (C Ct+1 + Q t+1 )−1 is ignored since it will not contribute to the result of where the additive term −C ^ t+1 in the determinant, and using the the differentiation. Ignoring also the term not depending on C ^ t+1 from eq. (D.7) we simplify the log-determinant replacement of C ¯ µh ¯ ln ¯¯ I t
0t
iT
h ^ t+1 I t C
0t
i
¶¯ ¯ + Q t+1 ¯¯
=
=
=
¯" #¯ Q ∗Q ∗T ¯ C Q ∗ ¯¯ ¯ ^ t+1 + Q t + q∗ ln ¯ ¯ ¯ Q ∗T q∗ ¯ ¯ ¯ ¯ Q ∗Q ∗T ¯¯ Q ∗Q ∗T ¯^ − ln ¯C t+1 + Q t + ¯ + ln q∗ ¯ q∗ q∗ ¯
¯ ¯ ¯ ¯^ ∗ ln ¯C t+1 + Q t ¯ + ln q
(D.9)
where we used the decomposition into block-diagonal matrices (first line) and the expression for the determinants of block-diagonal matrices from eq (A.4). ^ t+1 is the addition of differentiating The differentiation of the KL-distance with respect to C eqs. (D.8) and (D.9): ³ ´−1 h ^ t+1 + Q t = It C
h i Qt+1 + C t+1 )−1 I t 0 (Q
101
iT 0
(D.10)
Appendix D. KL-optimal parameter reduction We apply the matrix inversion lemma to the RHS similarly to the case of eq (D.9) and retaining only the upper-left part leads to ³ ´−1 ^ t+1 + Q t C =
Ã
T
C∗ + Q ∗ ) (C C∗ + Q ∗ ) Q ∗Q ∗T (C + Qt + − q∗ q∗ + c∗
(r)
C
!−1
(D.11)
and the reduced covariance parameter is T
∗ ∗T Q∗ + C ∗ ) (Q Q∗ + C ∗ ) ^ t+1 = C (r) + Q Q − (Q C ∗ ∗ q q + c∗
D.1
(D.12)
Computing the KL-distance
We are assessing the error made when pruning the GP by evaluating the KL-divergence from eq. (D.1) ^ t+1 ) from the previous section. αt+1 , Ct+1 ) and the pruned one with (^ αt+1 , C between the process with (α We start by writing the pruning equations in function of t + 1-dimensional vectors: in the following . . C∗T c∗ ]T and the pruning equations are Q∗T q∗ ]T and C ∗ = [C we will use Q ∗ = [Q α∗ Q∗ + C ∗ ) (Q c∗ + q∗ ´ 1 1 ³ T Q∗ + C∗ ) (Q Q∗ + C∗ ) = Ct+1 + ∗ Q∗Q∗T − ∗ (Q q q + c∗
^ t+1 = α t+1 − α ^ t+1 C
(D.13)
and it is easy to check that the updates will result in the last row and column being all zeros. In computing the KL-divergence we will use the identities from the matrix algebra: Ct+1 + Q t+1 )−1 (C C∗ + Q ∗ ) = e t+1 (C
and
K t+1Q ∗ = e t+1
Based on the first identity, the term containing the mean is ´−1 ³ αt+1 − α αt+1 − α ^ t+1 ) = ^ t+1 ) C t+1 + K −1 (α (α t+1
α∗2 + c∗
(D.14)
q∗
The logarithm of the determinants is transformed, using the determinants of the block-diagonal matrices, in eq. (A.4): ¯ (r) T ∗ ∗ T ¯ (r) 1 1 Q∗ Q∗ ¯ ¯¯C + Q + q∗ QQ − q∗ + c∗ (Q + C ) (Q + C ) ¯ ¯ ¯^ ¯C t+1 + Q t+1 ¯ = ¯¯ ¯ ¯ Q ∗T ¯ ¯ = ¯¯C (r) + Q (r) −
¯ ¯ 1 ∗ ∗ ∗ ∗ T¯ Q + C ) (Q Q + C ) ¯ q∗ ∗ ∗ (Q q +c
and using a similar decomposition for the denominator we have ¯ ¯ ¯C(r) + Q(r) C∗ + Q∗ ¯ ¯ ¯ Ct+1 + Q t+1 | = ¯ ∗T |C ¯ ¯ Q + C ∗T q∗ + c∗ ¯ ¯ ¯ = ¯¯C (r) + Q (r) −
¯ Q ∗ ¯¯ ¯ ¯ ¯ ¯ q∗ ¯
¯ ¯ 1 ∗ ∗ ∗ ∗ T¯ Q + C ) (Q Q + C ) ¯ (q∗ + c∗ ) ∗ ∗ (Q q +c 102
(D.15)
(D.16)
Appendix D. KL-optimal parameter reduction and the logarithm of the ratio has the simple expression as ¯ ¯³ ´ ¯ ¯ ^ Ct+1 + Q t+1 )−1 ¯ = ln ln ¯ C t+1 + Q t+1 (C
q∗ q∗ + c∗
(D.17)
Finally, using the invariance of the trace of a product with respect to circular permutation of its elements, the trace term is: "Ã # ! T Q∗ + C ∗ ) (Q Q∗ + C ∗ ) Q ∗Q ∗T (Q −1 Ct+1 + Q t+1 ) tr (C − q∗ q∗ + c∗ = = =
1 1 ∗T T Ct+1 + Q t+1 )−1 Q ∗ − ∗ Q∗ + C ∗ ) (C Ct+1 + Q t+1 )−1 (Q Q∗ + C ∗ ) Q (C (Q ∗ q q + c∗ ¸ · ´−1 ³ 1 ∗T −1 K t+1 Q ∗ − 1 K t+1 − K t+1 C t+1 + K t+1 Q q∗ ³ ´−1 1 s∗ 1 − ∗ e Tt+1 C −1 (D.18) e t+1 − 1 = − ∗ t+1 + K t+1 q q
C−1 Kt+1 )−1 . Summing up eqs (D.14), (D.17), where s∗ is the last diagonal element of the matrix (C t+1 +K and (D.18), we have the minimum KL-distance ^ t+1 kGP t+1 ) = 2KL(GP
D.2
¶ µ s∗ c∗ α∗2 − + ln 1 + q∗ + c∗ q∗ q∗
(D.19)
−1 C−1 Updates for S t+1 = (C t+1 + K t+1 )
Matrix inversion is a sensitive issue and we are trying to avoid it. In computing the score for a given C−1 + K )−1 . BV in the previous section, eq. (D.19), we need the diagonal element of the matrix S = (C
In this section we sketch an iterative update rule for the matrix S , and an update when the KL-optimal removal of the last BV element is performed.
First we establish the update rules for the inverse of matrix C t+1 . By using the matrix inversion
lemma and the update from eq. (2.46), the matrix C −1 is " # kt+1 C −1 −k −1 t C t+1 = kTt+1 (r(t+1) )−1 + k Tt+1C tk t+1 −k
(D.20)
then we combine the above relation with the block-diagonal decomposition of the kernel matrix, and observing that the t × 1 column vector is zero, we have ³ ´−1 −1 ´−1 ³ 0 C + K t −1 where = t C t+1 + K t+1 −1 0T a
a = (r(t+1) )−1 + k Tt+1C tk t+1 + k∗
and this shows that the update for the matrix S t+1 is particularly simple: we only need to add a value on the last diagonal element. When removing a BV however, the resulting matrix will not be diagonal any more. To have an
update quadratic in the size of S , we use the matrix inversion lemma
Ct+1 + Q t+1 )−1 Q t+1 S t+1 = Q t+1 − Q t+1 (C ´−1 ³ −1 ^t+1 = C ^ t+1 + Kt and after the pruning we are looking for the t × t matrix S . We can obtain this ³ ´−1 ^ t+1 + Q t by using eq. (D.11): the pruned C is the matrix obtained by cutting the last row and −1 Ct+1 + Q t+1 ) . The computation of the updated matrix S^t+1 has thus three steps: column from (C 103
Appendix D. KL-optimal parameter reduction 1. compute Ct+1 + Qt+1 )−1 = Kt+1 − Kt+1St+1Kt+1 (C ³ ´−1 ^ t+1 + Q t 2. compute the reduced matrix C by trimming, use eq. (D.11) 3. compute the updated S^t+1 using
³ ´−1 ^ t+1 + Q t S^t+1 = Q t − Q t C Qt
104
Appendix E Diagonalisation of matrix C
In this appendix we are deducing the online learning rules for a restricted GP where only the diagonal elements of the matrix C parametrising the posterior kernel are nonzero, similarly to the parametrisation of the covariances in the kernel spaces proposed by Tipping [2001b]. We are doing the simplification by including the constraint in the learning rule: projecting to a subspace of GP’s with the kernel specified using only diagonal elements, ie. x, x ′ ) = K0 (x x, x ′ ) + Kpost (x
X
x, x i )Cii K0 (x xi , x ′ ) K0 (x
(E.1)
i
and if we use matrix notation and the design matrix Φ = [φ1 , . . . , φN ] then we can write the posterior covariance matrix in the feature space specified by the design matrix and the diagonal matrix C as Σ post = I H + ΦCΦ T
(E.2)
In online learning setup the KL-divergence between the true posterior and the projected one is minimised. Differentiating the KL-divergence from eq. (3.15) with respect to a diagonal element Cii leads to the expression 0 = Σ post
Σt+1 + Σ post ] Σ t+1 φi φTi Σ t+1 [−Σ
= Σ t − Σ t φt+1 r(t+1) φTt+1Σ t+1
with r(t+1) the scalar coefficient obtained using the online learning rule and φt+1 the feature vector corresponding to the new datum. We have t + 1 equations for t + 1 variables, but the system is not linear. Substituting the forms for the covariances Σ and using the matrix inversion lemma leads to the system of equations: · ³ ³ ´−1 ¸ ´−1 −1 −1 Ct+1 − C post ) K B + C t+1 diag = 0 (C K B + C t+1 Ctk t+1 + e t+1 ) r(t+1) (C Ctk t+1 + e t+1 )T C post = C t + (C
(E.3)
(E.4)
We see that we have a projection with respect to the unknown matrix C t+1 , giving no analytic solution. Using C post from eq. (E.4) the solution is written ´−1 ´−1 ³ ³ −1 = diag K + C diag K −1 + C post t+1 B B 105
Appendix E. Diagonalisation of matrix C We see that, to obtain the “simplified” solution we still need to invert full matrices. The posterior covariance is not diagonal either. As a consequence we will be required to perform iterative approximations, also considered in [Tipping 2001b]. From this we conclude that the diagonalisation of parameter matrix C is not feasible as it does not introduce any computational benefit and we believe that by keeping the size of the BV set at a reasonable size is a better alternative then a diagonalisation of a
possibly larger BV set.
106
Appendix F Updates for the wind fields
In this section we obtain the coefficients for the online update of the vectorial GP from Section 5.4. For this we need a single likelihood term, indexed t, and the vector GP marginal at time t−1, denoted qt−1 (zz) where z is the two-dimensional wind vector. The single “likelihood” term has a mixture of 4 P ω, σ0t ) = 4j=1 βtj φ(zzt |cctj , σtj ) Gaussians (following the description from Evans et al. [2000]) pm (zzt |ω
µ0 , W 0 ) in in the numerator and the GP marginal at x t , a two-dimensional Gaussian denoted q0 (zz|µ
the denominator:
4 ω, σ0t )p(σ0t ) X pm (zzt |ω φ(zzt |cctj , σtj ) βtj = (F.1) z µ W α0 , W 0 ) q0 (z |µ 0 , 0 ) q0 (zz|α j=1 P with the mixture coefficients j βtj = 1 and φ(zzt |cctj , σtj ) is one component of the Gaussian mixture:
a spherical Gaussian centered at ctj and with spherical variance σtjI2 = Atj . We will use zero prior
mean functions, thus we do not write µ 0 in what follows. We need to compute the average of the likelihood in eq. (F.1) with respect to the Gaussian µt , W t ) where (µ µt , W t ) are the mean and variance of the GP marginal at x t . Using these qt−1 (zz|µ notations we write the required average as: Z 4 X φ(zzt |cctj , Atj ) µt , W t ) µt ) = dzz qt−1 (zz|µ βtj g(hzzit ) = g(µ α0 , W 0 ) q0 (zz|α
(F.2)
j=1
where the dependence on the mean of the GP marginal µ t is explicitly written. We decompose eq. (F.2) into the sum: µt ) = g(µ
4 X
Z
βtj dzz
j=1
=
4 X
φ(zzt |cctj , A tj ) µt , W t ) qt−1 (zz|µ α0 , W 0 ) q0 (zz|α (F.3)
µt ) βtj stj (µ
j=1
µt ). We have the same integral for each stj (µ µt ), we remove the and in the following we compute stj (µ indices and compute a generic µ) = s(µ
Z
dzz
φ(zz|cc, A ) µ, W ). qt−1 (zz|µ W 0) q0 (zz|W
(F.4)
All distributions involved are Gaussian, the resulting distribution thus will also be a Gaussian one with the general form: 1 s = K exp(− F) 2 107
Appendix F. Updates for the wind fields with the quadratic term ´−1 ³ ´ ³ ´T ³ A −1c + W −1µ F = c T A −1c + µ T W −1µ − A −1c + W −1µ A −1 + W −1 − W 0−1
or equivalently (using the matrix inversions from eq. (A.1)): · ³ ´−1 ¸ −1 −1 −1 T −1 A −1c I2 − W + A − W 0 F =c A
· ³ ´−1 ´−1 ¸−1 ³ −1 T µ µ − 2µ c W A + W − A W + µ W + A −1 − W −1 0 0
(F.5)
(F.6)
T
and the multiplying constant K2 =
W 0| |W . W + A − AW −1 |W 0 W|
The first and second order differentials of F: · ´−1 ¸−1 ´−1 ³ ³ 1 µ − A + W − AW −1 c ∂µ F = W + A −1 − W −1 0 W 0 2 . · ´−1 ¸−1 ³ 1 2 −1 −1 ∂ F = W + A − W0 2 µ
(F.7)
(F.8)
µt ) = Ktj exp(−Ftj /2) and differentiate log g(µ µt ) with respect to µ t We can substitute back each stj (µ to get the quantities required for the updates of the vector GP in eq. (5.38): P P 1 X βtj ∂µ stj j βtj stj 2 ∂µ Ftj j P µt ) = ∂µ ln =− ∂µ ln g(µ βtj stj = P j βtj stj j βtj stj j P P X βtj ∂µ2 stj ( j βtj ∂µ stj )2 j 2 2 µt ) = ∂µ ln ∂µ ln g(µ βtj stj = P − P ( j βtj stj )2 j βtj stj j
=
P
j
βtj stj
h¡ 1
2 ∂µ Ftj
P
¢ ¡1
j
2 ∂µ Ftj
βtj stj
¢T
− 12 ∂µ2 Ftj
i
−
³P
j
´ ³P ´T 1 βtj stj 12 ∂µ Ftj j βtj stj 2 ∂µ Ftj P ( j βtj stj )2
where βtj stj is the responsbility of the j-th component of the mixture for generating data x t .
108
(F.9)
Appendix G The Sparse EP algorithm Table G.1: Detailed description of the sparse GP algorithm using the iterative EP extension. Init.
Choose the kernel type and parameters. Set the MBV and ǫtol . α, C ), (a a, Λ , P ), and (K K, Q ) to empty values. Set the BV set to empty set. Set (α t=0
Iterate (a) Par.
yt+1 , x t+1 ) do For a selected example (y adj.
(EP)
If λt+1 6= 0 then
(subtract contribution from previous iteration)
ht+1
= CKpt+1 + pt+1
v−1 t+1
T T λ−1 t+1 − p t+1Kp t+1 − p t+1KCKp t+1 ¡ ¢ = α + h t+1 vt+1 α T Kp t+1 − at+1
˜ α
=
˜ = C + vt+1h t+1h T C t+1
(b) Online
co-
eff.
(c) Scalars
˜ ), the first and second deriva˜, C Compute q(t+1) and r(t+1) using GP with (α
tives of:
¿
À y x ln P(y t+1 |x t+1 , ft+1 ) ^) GP(^ α, C
&
Vectors
xt+1 , x t+1 ) k∗t+1 = K0 (x e^t+1 = Qk t+1 σ2t+1 = k∗t+1 + k Tt+1Ck t+1
xt+1 , x j )]Tj∈BV k t+1 = [K0 (x γt+1 = k∗t+1 − k Tt+1e^t+1 ´−1 ³ ηt+1 = 1 + γt+1 r(t+1)
(d) EP update at+1 λt+1
q(t+1) ˜ − (t+1) = k Tt+1α r ´−1 ³ = − (r(t+1) )−1 + σ2t+1 ...continued
109
Appendix G. The Sparse EP algorithm (e) Geom. test
If γt+1 < ǫtol then
(perform full update) s t+1
˜ k t+1 + e^t+1 = C
p t+1
= e^t+1
otherwise
(perform sparse update)
• add x t+1 to the BV set: K new
kt+1 + e t+1 )(k kt+1 + e t+1 )T = K + (k
Q new
= Q + γ−1 e t+1 − e t+1 )(^ e t+1 + e t+1 )T t+1 (^
• compute s t+1
˜ k t+1 + e t+1 = C
p t+1
= e t+1
(where p i is the i-th row of matrix P .) (f) GP
par.
update
(g) BV removal
α new
^ + q(t+1) ηt+1 s t+1 = α
C new
^ + r(t+1) ηt+1 s t+1s Tt+1 = C
(remove a BV )
If #BV > MBV • compute scores for each BV (i): εi =
αi qi + ci
• find the BV with minimal score j = argmin{εi |i ∈ BV} • remove BV j from the BV set, using notation from Fig. 3.3 and Fig. D.1, with BV set rearranged such that the j-th element is the last one. α(r) −
α∗ Q∗ + C ∗ ) (Q c∗ + q∗
α new
=
C new
= C (r) +
Q∗ + C ∗ ) (Q Q∗ + C ∗ ) (Q Q ∗Q ∗T − q∗ q∗ + c∗
Q new
= Q (r) −
Q ∗Q ∗T q∗
P new
= P (r) −
P ∗Q ∗T q∗
T
where P (r) is the matrix P without the j-th column (or the last one, if we reordered the BV set), and P ∗ is the column vector containing the projection coefficients corresponding to the j-th BV element.
...continued
110
Appendix G. The Sparse EP algorithm (h) Goto (a)
t=t+1 yt+1 , x t+1 ) to process. Select a new input (y Restart iteration.
111
Bibliography
Barber, D. and C. M. Bishop (1998). Ensemble learning in Bayesian neural networks. In C. M. Bishop (Ed.), Neural Networks and Machine Learning, Proceedings of the NATO Advanced Study Institute on Generalization in Neural Networks and Machine Learning, Berlin. SpringerVerlag. Berliner, L. M., L. Wikle, and N. Cressie (2000). Long-lead prediction of Pacific SST via Bayesian dynamic modelling. Journal of Climate 13, 3953–3968. Bernardo, J. M. and A. F. Smith (1994). Bayesian Theory. John Wiley & Sons. Bishop, C. M. (1995). Neural Networks for Pattern Recognition. New York, N.Y.: Oxford University Press. Blight, C. and C. Ott (1975). A bayesian approach to model inadequacy for polynomial regression. Biometrica 62, 79–88. Bottou, L. (1998). Online learning and stochastic approximations. See Saad [1998], pp. 9–42. Broomhead, D. S. and D. Lowe (1988). Multivariable functional interpolation and adaptive networks. Complex Systems 2, 321–355. Burges, C. J. (1998). A tutorial on support vector machines for pattern recognition. Knowledge Discovery and Data Mining 2(2), 121–167. Campbell, C., N. Cristianini, and A. J. Smola (2000). Query learning with large margin classifiers. In Proceedings of the 17th International Conference on Machine Learing, pp. 111–118. Cauwenberghs, G. and T. Poggio (2001). Incremental and decremental Support Vector Machine learning. In T. K. Leen, T. G. Diettrich, and V. Tresp (Eds.), NIPS, Volume 13. The MIT Press. Chen, S., , D. Donoho, and M. Saunders (1995). Atomic decomposition by basis pursuit. Technical Report 479, Department of Statistics, Stanford University. Chen, S. S. (1995, November). Basis Pursuit. Ph. D. thesis, Department of Statistics, Stanford University. Cornford, D., I. T. Nabney, and C. K. I. Williams (1999). Modelling frontal discontinuities in wind fields. Nonparametric Statistics. accepted. Cover, T. M. and J. A. Thomas (1991). Elements of Information Theory. John Wiley & Sons. Cressie, N. A. (1993). Statistics for Spatial Data. New York: John Wiley and Sons. Csat´o, L., D. Cornford, and M. Opper (2001). Online learning of wind-field models. In International Conference on Artificial Neural Networks, pp. 300–307. Csat´o, L., E. Fokou´e, M. Opper, B. Schottky, and O. Winther (2000). Efficient approaches to Gaussian process classification. In NIPS, Volume 12, pp. 251–257. The MIT Press. Csat´o, L. and M. Opper (2001). Sparse representation for Gaussian process models. In T. K. Leen, T. G. Dietterich, and V. Tresp (Eds.), NIPS, Volume 13, pp. 444–450. The MIT Press. Csat´o, L. and M. Opper (2002). Sparse on-line Gaussian Processes. Neural Computation 14(3), 641–669.
112
BIBLIOGRAPHY de Freitas, J., M. Nianjan, and A. Gee (1998). Hierarchical bayesian kalman models for regularisation and ARD in sequential learning. Technical report, Cambridge University, Engineering Department, http://svr-www.eng.cam.ac.uk/reports/people/niranjan.html. Devroye, L., L. Gy¨orfi, and G. Lugosi (1996). A Probabilistic Theory of Pattern Recognition. Number 31 in Applications of mathematics. New York: Springer. Evans, D. J., D. Cornford, and I. T. Nabney (2000). Structured neural network modelling of multi-valued functions for wind retrieval from scatterometer measurements. Neurocomputing Letters 30, 23–30. Friedman, J. H. (1991). Multivariate adaptive regression splines. Annals of Statistics 19, 1–141. Gelb, A., J. Kasper, R. Nash, C. Price, and A. Sutherland (1974). Applied Optimal Estimation. Cambridge, MA: The MIT press. Gelman, A., J. B. Carlin, and H. S. Stern (1995). Bayesian Data Analysis. Chapman & Hall. Gibbs, M. and D. J. MacKay (1997). Efficient implementation of Gaussian processes. Technical report, Department of Physics, Cavendish Laboratory, Cambridge University. http://wol.ra.phy.cam.ac.uk/mackay. Gibbs, M. and D. J. MacKay (1999). Variational Gaussian process classifiers. Technical report, Department of Physics, Cavendish Laboratory, Cambridge University. http://wol.ra.phy.cam.ac.uk/mackay/abstracts/gpros.html. Girolami, M. (2002). Orthogonal series density estimation and the kernel eigenvalue problem. Neural Computation 14(3), 669–688. Gorman, R. P. and T. J. Sejnowski (1988). Analysis of the hidden units in layered networks trained to classify sonar targets. Neural Networks 1, 75–89. Gradshteyn, I. and I. Ryzhik (1994). Table of integrals, series, and products. New York: Academic Press. Haykin, S. (1994). Neural networks : a comprehensive foundation. New York: Macmillan. Herbrich, R., T. Graepel, and C. Campbell (2001). Bayes point machines. Journal of Machine Learning Research 1, 245–279. Hinton, G. E. and D. van Camp (1993). Keeping neural networks simple by minimising the description length. In 6th Conference on Computational Learning Theory, pp. 5–13. Holy, T. E. (1997). The analysis of data from continuous probability distributions. http://xxx.arXiv.org/ps/physics/9706015 , 1–8. Huber, P. J. (1985). Projection pursuit. The Annals of Statistics 13(2), 435–475. Jaakkola, T. and D. Haussler (1999). Probabilistic kernel regression. In Online Proceedings of 7-th Int. Workshop on AI and Statistics. http://uncertainty99.microsoft.com/proceedings.htm. Jolliffe, I. T. (1986). Principal Component Analysis. New York: Springer Verlag. Jordan, M. I. (Ed.) (1999). Learning in Graphical Models. The MIT Press. Kalman, R. (1960). A new approach to linear filtering and prediction problems. Trans ASME, Journal of Basic Engineering, Ser. D 83, 35–45. Kalman, R. and R. Bucy (1961). New results in linear filtering and prediction theory. Trans ASME, Journal of Basic Engineering, Ser. D 83, 95–108. Kimeldorf, G. and G. Wahba (1971). Some results on Tchebycheffian spline functions. J. Math. Anal. Applic. 33, 82–95. Kullback, S. (1959). Information Theory and Statistics. Wiley, New York. MacKay, D. J. (1999). Comparison of approximate methods for handling hyperparameters. Neural Computation 11, 1035–1068. Mardia, K. V., J. T. Kent, and J. M. Bibby (1979). Multivariate Analysis. London: Academic Press. McCullagh, P. and J. A. Nelder (1989). Generalized Linear Models. London: Chapman & Hall. Mercer, J. (1909). Functions of positive and negative type and their connection with the theory of integral equations. Philos. Trans. Roy. Soc. London A 209, 415–446.
113
BIBLIOGRAPHY Minka, T. P. (2000). Expectation Propagation for Approximate Bayesian Inference. Ph. D. thesis, Dep. of Electrical Eng. and Comp. Sci.; MIT. Nabney, I. T., D. Cornford, and C. K. Williams (2000a). Structured neural network modelling for multi-valued functions for wind vector retrieval from satellite scatterometer measurements. Neurocomputing 30, 23–30. Nabney, I. T., D. Cornford, and C. K. I. Williams (2000b). Bayesian inference for wind field retrieval. Neurocomputing Letters 30, 3–11. Neal, R. M. (1997). Regression and classification using Gaussian process priors (with discussion). In J. M. Bernerdo, J. O. Berger, A. P. Dawid, and A. F. M. Smith (Eds.), Bayesian Statistics, Volume 6, pp. 475–501. Oxford University Press. ftp://ftp.cs.utoronto.ca/pub/radford/mc-gp.ps.Z. Nemenmann, I. and W. Bialek (2001). Learning continuous distributions: Simulations with field theoretic priors. In T. K. Leen, T. G. Diettrich, and V. Tresp (Eds.), NIPS, pp. 287–293. Offiler, D. (1994). The calibration of ERS-1 satellite scatterometer winds. Journal of Atmospheric and Oceanic Technology 11, 1002–1017. O’Hagan, A. (1978). Curve fitting and optimal design for prediction (with discussion). J. Royal Statistical Socierty, Ser. B 40, 1–42. Opper, M. (1996). Online versus offline learning from random examples: General results. Phys. Rev. Lett. 77(22), 4671–4674. Opper, M. (1998). A Bayesian approach to online learning. See Saad [1998], pp. 363–378. Opper, M. and D. Saad (Eds.) (2001). Advanced Mean Field Methods: Theory and Practice. The MIT Press. Opper, M. and O. Winther (1999). Gaussian processes and SVM: Mean field results and leave-oneout estimator. See Smola et al. [1999], pp. 43–65. Opper, M. and O. Winther (2000). Gaussian processes for classification: Mean-field algorithms. Neural Computation 12, 2655–2684. Opper, M. and O. Winther (2001). Tractable approximations for probabilistic models: the adaptive Thouless-Anderson-Palmer mean field approach. Physical Review Letters 86(17), 3695–3698. Osuna, E. E. and F. Girosi (1999). Reducing the run-time complexity in Support Vector Machines. See Sch¨olkopf et al. [1999], pp. 271–284. Pati, Y., R. Rezaiifar, and P. Krishnaprasad (1993, November). Orthogonal matching pursuit: Recursive function approximations to wavelet decomposition. In 27-th Annual Asilomar Conference on Signals Systems and Computers, citeseer.nj.nec.com/pati93orthogonal.html. Platt, J. C. (1999a). Fast training of Support Vector Machines using sequential minimal optimisation. See Sch¨olkopf et al. [1999], pp. 185–208. Platt, J. C. (1999b). Probabilities for Support Vector Machines. See Smola et al. [1999], pp. 61–74. Poggio, T. and F. Girosi (1990). Networks for approximation and learning. Proceedings of The IEEE 78(9), 1481–1497. Press, W. H., B. P. Flannery, S. A. Teukolsky, and W. T. Vetterling (1992). Numerical Recipes in C (Second ed.). Cambridge: Cambridge University Press. Rasmussen, C. E. and Z. Ghahramani (2002). Infinite mixture of gaussian process experts. In T. G. D. S. Becker and Z. Ghahramani (Eds.), NIPS, Volume 14, http://nips.cc. The MIT Press. Ripley, B. (1996). Pattern Recogntion and Neural Networks. Cambridge, UK: Cambridge University Press. Roweis, S. (1998). Em algorithms for pca and spca. In M. I. Jordan, M. J. Kearns, and S. A. Solla (Eds.), NIPS, Volume 10. The MIT Press. Saad, D. (1998). On-Line Learning in Neural Networks. Cambridge Univ. Press. Schmidt, D. M. (1998). Continuous probability http://xxx.arXiv.org/ps/physics/9808005 , 1–8.
114
distributions
from
finite
data.
BIBLIOGRAPHY Sch¨olkopf, B., , A. Smola, and K.-R. M¨ uller (1998). Nonlinear component analysis as a kernel eigenvalue problem. Neural Computation 10, 1299–1319. Sch¨olkopf, B., C. J. Burges, and A. J. Smola (Eds.) (1999). Advances in kernel methods (Support Vector Learning). The MIT Press. Sch¨olkopf, B., R. Herbrich, and A. J. Smola (2001). A generalized representer theorem. In Fourteenth Annual Conference on Computational Learning Theory, pp. in press. Sch¨olkopf, B., S. Mika, C. J. Burges, P. Knirsch, K.-R. M¨ uller, G. R¨atsch, and A. J. Smola (1999). Input space vs. feature space in kernel-based methods. IEEE Transactions on Neural Networks 10(5), 1000–1017. Seeger, M. (2000). Bayesian model selection for Support Vector Machines, Gaussian processes and other kernel classifiers. In S. A. Solla, T. K. Leen, and K.-R. M¨ uller (Eds.), NIPS, Volume 12. The MIT Press. Seung, H. S., M. Opper, and H. Sompolinsky (1992). Query by committee. In Computational Learing Theory, citeseer.nj.nec.com/seung92query.html, pp. 287–294. Singer, Y. and M. Warmuth (1998). A new parameter estimation method for Gaussian mixtures. In M. S. Kearns, S. A. Solla, and D. A. Cohn (Eds.), NIPS, Volume 11. The MIT Press. Smola, A., P. Bartlett, B. Sch¨olkopf, and C. Schuurmans (Eds.) (1999). Advances in Large Margin Classifiers, Cambridge, MA. The MIT Press. Smola, A. J. and P. Bartlett (2001). Sparse greedy gaussian pocess regression. In T. K. Leen, T. G. Diettrich, and V. Tresp (Eds.), NIPS, Volume 13, pp. 619–625. The MIT Press. Smola, A. J. and B. Sch¨olkopf (2000). Sparse greedy matrix approximation for machine learning. In Proceedings of ICML’200, San Francisco, CA, pp. 911–918. Morgan Kaufmann. Smola, A. J. and B. Sch¨olkopf (2001). Sparse greedy gaussian process regression. In T. K. Leen, T. G. Diettrich, and V. Tresp (Eds.), NIPS, Volume 13, pp. 619–625. The MIT press. Smola, A. J. and B. Sch¨olkopf (2002). Learning with Kernels. MIT Press. Sollich, P. (1996). Learning from minimum entropy queries in a large committee machine. Physical Review 53, 2060–2063. Sollich, P. (1999). Probabilistic interpretation and Bayesian methods for Support Vector Machines. In International Conference on Neural Networks, Edinburgh, pp. 91–96. Stoffelen, A. and D. Anderson (1997). Ambiguity removal and assimiliation of scatterometer data. Quarterly Journal of the Royal Meteorological Society 123, 491–518. Tikhonov, A. (1963). Solution of incorrectly formulated problems and the regularization method. Soviet Math. Dokl. 4, 1035–1038. Tipping, M. (2000). The Relevance Vector Machine. In S. A. Solla, T. K. Leen, and K.-R. M¨ uller (Eds.), NIPS, Volume 12, pp. 652–658. The MIT Press. Tipping, M. E. (2001a). Sparse bayesian learning and the relevance vector machine. Journal of Machine Learning Research 1, 211–244. Tipping, M. E. (2001b). Sparse kernel principal component analysis. In T. K. Leen, T. G. Diettrich, and V. Tresp (Eds.), NIPS, Volume 13. The MIT press. Tipping, M. E. and C. M. Bishop (1999). Probabilistic principal component analysis. Journal of the Royal Statistical Society, Series B 61(3), 611–622. Trecate, G. F., C. K. I. Williams, and M. Opper (1999). Finite-dimensional approximation of Gaussian processes. In M. S. Kearns, S. A. Solla, and D. A. Cohn (Eds.), NIPS, Volume 11. The MIT Press. Tresp, V. (2000). A Bayesian committee machine. Neural Computation 12(11), 2719–2741. Vapnik, V. (1999). Three remarks on the Support Vector method of function estimation. See Sch¨olkopf et al. [1999], pp. 25–42. Vapnik, V. N. (1995). The Nature of Statistical Learning Theory. New York, NY: Springer-Verlag.
115
BIBLIOGRAPHY Vincent, P. and Y. Bengio (2000). Kernel matching pursuit. Technical Report 1179, D´epartement d’Informatique et Recherche Op´erationnelle, Universit´e de Montr´eal. Wahba, G. (1990). Splines Models for Observational Data. Philadelphia: Series in Applied Mathematics, Vol. 59, SIAM. Wahba, G., X. Lin, F. Gao, D. Xiang, R. Klein, and B. KLein (1999). The bias-variance tradeoff and the randomized GACV. In M. S. Kearns, S. A. Solla, and D. A. Cohn (Eds.), NIPS, Volume 11, pp. 620–626. The MIT Press. Weston, J., A. Gammerman, M. O. Stitson, V. Vapnik, V. Vovk, and C. Watkins (1999). Support Vector density estimation. See Sch¨olkopf et al. [1999], pp. 293–305. Williams, C. K. (1996). Computation with infinite networks. In D. S. Touretzky, M. C. Mozer, and M. E. Hasselmo (Eds.), NIPS, Volume 9. The MIT Press. Williams, C. K. I. (1999). Prediction with Gaussian processes. See Jordan [1999]. Williams, C. K. I. and D. Barber (1998). Bayesian classification with Gaussian Processes. IEEE Transactions on Pattern Analysis and Machine Intelligence 20(12), 1342–1351. Williams, C. K. I. and C. E. Rasmussen (1996). Gaussian processes for regression. In D. S. Touretzky, M. C. Mozer, and M. E. Hasselmo (Eds.), NIPS, Volume 8. The MIT Press. Williams, C. K. I. and M. Seeger (2001). Using the Nystr¨om method to speed up kernel machines. In T. K. Leen, T. G. Diettrich, and V. Tresp (Eds.), NIPS, Volume 13. Zhu, H., C. K. I. Williams, R. Rohwer, and M. Morciniec (1997). Gaussian regression and optimal finite dimensional linear models. Technical report, Aston University.
116