2 National ICT Australia, Victorian Research Lab, Australia. 3 Ian Potter Centre for ... Cancer Centre, St. Andrew's Place, East Melbourne, Victoria, Australia.
Gene Ontology Assisted Exploratory Microarray Clustering and its Application to Cancer Geoff Macintyre1,2 , James Bailey1,2 , Daniel Gustafsson4 , Alex Boussioutas3 , Izhak Haviv5,6 , and Adam Kowalczyk2 1
3
4
Department of Computer Science and Software Engineering, University of Melbourne, Victoria, Australia 2 National ICT Australia, Victorian Research Lab, Australia Ian Potter Centre for Cancer Genomics and Predictive Medicine, Peter MacCallum Cancer Centre, St. Andrew’s Place, East Melbourne, Victoria, Australia Department of Computer Science and Computer Engineering, La Trobe University, Victoria, Australia 5 The Alfred Medical Research and Education Precinct, Baker Medical Research Institute, Epigenetics Group, Melbourne, Australia 6 Department of Biochemistry and Molecular Biology, University of Melbourne, Victoria, Australia
Abstract. Gene expression profiling provides insight into the functions of genes at a molecular level. Clustering of gene expression profiles can facilitate the identification of the underlying driving biological program causing genes’ co-expression. Standard clustering methods, grouping genes based on similar expression values, fail to capture weak expression correlations potentially causing genes in the same biological process to be grouped separately. We have developed a novel clustering algorithm which incorporates functional gene information from the Gene Ontology into the clustering process, resulting in more biologically meaningfull clusters. We have validated our method using a multi-cancer microarray dataset. In addition, we show the potential of such methods for the exploration of cancer etiology. Key words: Microarray, Gene Ontology, Clustering, Cancer
1
Introduction
Gene expression profiling using microarrays has become a key tool in the analysis of biological systems at a molecular level. While still producing relatively noisy data, much improvement has been made in noise correcting normalisation procedures and feature selection, providing rich datasets for further biological analysis. Microarray analysis pipelines generally come in two flavours: differential expression analysis and exploratory clustering. The purpose of differential expression analysis is to find the set of genes which are differentially expressed between two or more experimental conditions or samples. Once the list of genes has been determined, it can be used to classify further microarrays into similar sample categories. Alternatively the differentially expressed genes can be
2
Macintyre, Bailey, Gustafsson, Boussioutas, Haviv, Kowalczyk
analysed to try to unravel the underlying biology responsible for observed expression patterns. This is similar in approach to exploratory clustering. The aim in exploratory clustering is to try to uncover groups of genes with similar expression patterns. This is useful under the assumption that genes with shared expression patterns have similar function or are involved in similar biological processes. Each of the clusters of genes identified provide a starting point for further biological analysis based on gene expression. While exploratory clustering has been shown to be successful in many cases, it can suffer from some common problems. Clusters can be dominated by strong or noisy expression patterns, forcing genes of similar function or those belonging to the same process with less correlated expression, to join another cluster. Therefore the resulting clusters may not represent a biological process in its entirety or majority, making it hard to determine which molecular processes a particular cluster of genes represents. To improve the clustering process, additional information can be introduced to ensure genes with similar function or shared pathways can be clustered together. Sequence similarity, protein structure similarity, shared pathways and functions, are all ways in which genes can be shown to be related. There exist tools that use this information in trying to unravel the biology behind the observed expression behavior. The Gene Ontology (GO) [1] is a curated, structured vocabulary that describes genes and gene products. This provides a source for finding shared molecular functions, biological processes or cellular components between two genes. In the GO, two genes may be annotated to the same biological term, or they may be related through a shared term higher in the GO hierarchy (see Fig. 1). From this information a similarity metric [2, 3] can be defined which measures the relatedness of each gene via semantic functionality. This similarity measure can then be used as a biological prior probability measure on the clustering of genes via expression profiles. Previous attempts have been made to utilize the GO in clustering of gene expression profiles. Cheng et al [4] developed a clique-finding algorithm for the GO and used the cliques to perform co-clustering analysis with gene expression profiles. A biclustering approach which yields clusters designed to map onto the GO structure was developed by Liu et al[5]. Huang et al [6] and Pan [7] used GO annotations shared between genes to modify standard distance and model based clustering algorithms, and Boratyn et al [8] proposed a general method modifying the distance measure based on prior shared functional information between genes. For an assessment of some of these approaches see [9, 10] There are however two fundamental drawbacks with these approaches. Firstly, the GO is constructed as a directed acyclic graph, with terms lower in the tree being specialisations, or parts of, terms higher in the tree. Genes are then annotated to one or more terms in the tree, at the lowest (most specific) level possible. Drawing a path from one gene to another through this tree to determine similarity of the genes does not necessarily imply shared biology. The abstraction of terms across each level of the ontology can be such that two genes with a
Gene Ontology Assisted Exploratory Microarray Clustering
3
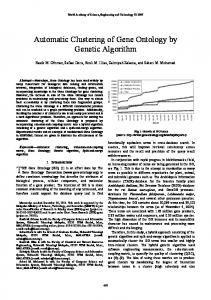
Fig. 1. This is a cut down example GO hierarchy for illustrative purposes. In the full Gene Ontology there would be additional terms between each of the nodes in the graph and the gene products would be annotated to more specialised terms lower in the tree.
single shared parent term, may be extremely diverse in terms of their specific function. For example, the two terms negative regulation of steroid metabolic process and positive regulation of steroid metabolic process share the parent steroid metabolic process. Genes annotated to each of these terms have the opposite effect on steroid metabolism. Therefore it would not be correct to state they had similar function based on their shared parent, especially in the context of their co-expression. Secondly, having genes annotated to the same term does not necessarily imply they have similar function or share a biological pathway, in the context of their expression patterns. A single gene can act differently in various biological contexts and thus have context specific roles. The GO is also used by tools such as GeneMerge [11], FatiGO [12] and others [13–16] to determine over-represented GO terms given a group of genes, thus giving a semantic representation of the biology spanning a group of genes. In the context of microarrays, these tools provide the ability to explore clusters of genes and form biological hypotheses about the observed co-expression. One of the benefits of this approach is that one is not scrutinizing the behavior of a single gene, but rather groups of genes in the same biological context. This provides an abstracted level of analysis, which encapsulates a single gene’s behavior, within the complex biological system represented by the cluster. A method is needed which looks for commonalities between genes based on the GO that does not traverse the GO hierarchy and is relevant to the gene set of interest (the gene’s biological context). We have developed GOMAC: Gene Ontology assisted Microarray Clustering, a modified k-means clustering algorithm which incorporates GO information only when it is relevant to the gene’s context, thus avoiding problems with irrelevant gene similarities. We have vali-
4
Macintyre, Bailey, Gustafsson, Boussioutas, Haviv, Kowalczyk
dated our method on a microarray dataset [17] spanning 12 cancer types demonstrating that our method results in an increase in number and biological relevance of meaningful clusters. We also discuss the biological implications of our results with respect to future research in cancer etiology.
2
Methods
The key biological assumption of the algorithm presented in this paper is that genes that share a particular annotation in the GO, will share a detectable similarity in their microarray expression pattern. There are two key differences between our approach and the previous attempts at clustering using the GO outlined above. – Only GO terms that are statistically over-represented within a cluster are used to calculate the similarity between genes. This ensures that only GO terms within the gene’s context are used. – We iteratively calculate similarities between genes using the GO, rather than having GO similarities as a set prior. In order to construct a model capable of the key points outlined above, each potential cluster of genes to be determined, requires both an expression profile to model the genes’ expression measurements and an annotation profile to model the genes’ GO similarities. As we are using a k-means based clustering algorithm, the number of clusters C is a parameter set by the user. 2.1
Algorithm Overview
1. Initialise using k-means clustering, grouping genes based on expression values using the method in Eisen et al [18] with C clusters. 2. Determine the expression profile for each cluster. 3. Determine the annotation profile for each cluster. 4. Re-cluster genes based on both expression and GO annotations. 5. Re-estimate the expression and annotation profiles. 6. Repeat steps 4 and 5 until convergence. 2.2
Expression Profile
Let κ be the number of samples; let Gc be the set of genes in a cluster c. Each gene g can be viewed as a vector xg = (xgi )1≤i≤κ ∈ Rκ of its expression values across all samples. The centroid of cluster c is defined as the vector Xc = (xc1 ...xcκ ) ∈ Rκ with entries defined as: P g∈Gc xgi c . (1) xi = |Gc | where xgi is the expression measurement for a particular gene g and sample i.
Gene Ontology Assisted Exploratory Microarray Clustering
2.3
5
Gene Ontology Annotation Profile
To generate a Gene Ontology annotation profile for a cluster, all GO terms annotated to the genes in a cluster which are statistically over-represented need to be found. This means that rather than reporting all terms that are annotated to the genes in a cluster, report only those that have sufficiently low probability of being present if we sampled a random selection of genes. For this purpose we are using a program called GeneMerge1.2 [11]. This uses the hypergeometric distribution with Bonferroni correction to generate a p-value for each term which is annotated to genes in a cluster. We use a threshold of b ≤ 0.2 of the Bonferroni corrected score as it provides a biologically meaningful number of terms that describe a cluster. A lower threshold yields clusters based mainly on expression distances with little or no GO terms and a higher threshold results in many GO terms which are less descriptive. All terms reported above the threshold are ignored. Let τ c be the number of terms below the threshold b for a given cluster c. From this, a weight d is assigned proportional to the number of genes in the cluster that are annotated to that term, normalised over all of a cluster’s GO terms. The weight dt shows the degree in which a term t is associated with a particular cluster. Then we can denote a cluster c’s annotation profile to be the vector Tc = (dt )1≤t≤τ c with entries defined as nt dt = Pτ c
j=1
nj
.
(2)
where nt is number of genes in the cluster that are annotated to GO term t (below the threshold b).
2.4
Algorithm
Input – Gene list G – For each gene g, expression measurements Eg1 ...Egκ for κ samples – For all GO terms A1 ...Af , given a particular gene g and the tth term, Agt takes the value true if the gene g is directly annotated to the term t, (obtained by querying the September 2007 release of the GO via a relational database interface to a locally stored copy). Initialisation – Form initial groupings of genes using k-means clustering on the expression values. – Calculate the cluster centroid (expression profile) Xc for each cluster. – Calculate the annotation profile Tc for each cluster.
6
Macintyre, Bailey, Gustafsson, Boussioutas, Haviv, Kowalczyk
Optimisation 1. Gene assignment: In the gene assignment step, we re-assign a gene to a cluster based on the current values for the expression and annotation profiles for that cluster. We use a gene’s match to a cluster annotation profile to scale the Euclidean expression distance of the gene from that cluster. For each gene g let the known expression values be Egβ where β ∈ Ng ⊂ {1....κ} are all indices of samples with known values for gene g. This is due to imperfections in the microarray experimental procedure which may generate data with missing or unknown expression values for a gene. Given this, we define the Euclidean distance of each gene g from cluster c’s centroid as: sX 1 . (xcβ − Egβ )2 . (3) DEgc = |Ng | β∈Ng
Then, given a gene g and its GO annotations, we also determine a scaling factor Sgc (where 0 ≤ Sgc ≤ 1). This is based on how many of the τ c terms in the cluster’s annotation profile match the terms annotated to a gene g: c
Sgc
τ X =1− (dct · Agt ).
(4)
t=1
Next, the expression distance DE of gene g from cluster c is scaled by the degree in which it’s annotated terms correlates with that of cluster c: DESgc = DEgc × Sgc .
(5)
Finally, ee simply use the minimum of this modified distance to assign a gene to a particular cluster: cg = arg min(DESgc ). (6) c
2. Re-estimation of cluster profiles: With the new assignment of genes, we recalculate the centroids of each cluster and determine the new GO terms which are over-represented and their associated weights. 3. Repeat steps 1 and 2 until convergence (genes stop changing clusters) Output – A series of gene clusters with associated GO annotations, which can be used as a starting point for further biological analysis.
3
Clustering Performance Assessment
External clustering assessment typically uses a ‘gold standard’ clustering determined by external means, to compare clusterings to. However, in the case of exploratory clustering, there is no ‘gold standard’. Instead, a standard measure
Gene Ontology Assisted Exploratory Microarray Clustering
7
to determine whether a new algorithm provides biologically better clusters than a previous algorithm, is to look for statistically over-represented GO terms in each of the clusters and show that the new algorithm has clusters of superior biological relevancy. However because we used the GO in the clustering process, this measure is not suitable. Two alternative means of external validation were devised. 3.1
Histological enrichment criterion
A measure was generated to try to test the biological significance of the clusters output by GOMAC with respect to their usefullness in biological hypothesis generation, in particular, uncovering differences in cancer histologies. This measure is based on the ability of the algorithm to uncover clusters which help answer or generate a specific biological question. In the case of the multi-class cancer dataset used, this is the ability to uncover clusters which show well defined differential expression across various cancer types. The idea here is that if the algorithm works successfully, the genes in a cluster should encapsulate a particular biology. As cancer types can be similar or vary significantly depending on their location in the body, one would expect certain cancers to have similar biological expression behaviour and others to differ. Thus, if the resulting clusters encapsulate a particular biology, then this cluster can be used to partition cancer types, uncovering cancers which share the same biology. To do this, additional hierarchical clustering of the samples of each cluster was performed to partition the cancers into two groups. One group contains all cancers that have upregulated genes in the cluster, and the other group has all samples which have downregulated expression. In the dataset used, the samples were sub-divided by label, into classes, or cancer types. Given a good clustering, a partition of a cluster should contain all of a particular sub-class of sample (cancer type). That is, we would expect cancers sharing some (perhaps unknown) biology to be grouped together. To quantify this, considering a single partition, the hypergeometric distribution was used to determine the probability of observing a particular enrichment of sample classes (cancer types) by chance. From this, a Bonferroni corrected pvalue was generated which was used to determine the quality of a particular cluster in reference to its biological usefullness. 3.2
Functional annotation enrichment criterion
In addition, an alternative information source to the GO was used to determine biological significance of a cluster. Each of the clusters were analysed through the R use of Ingenuity Pathway Analysis (Ingenuity Systems, www.ingenuity.com). The genes were overlayed with function and disease information provided by IPA. The overlay procedure takes a gene list as input and outputs the functions and diseases over-represented in the gene list, similar in process to GeneMerge mentioned above. Each of the terms has an associated p-value and all relationships have been extracted from various literature sources curated by experts.
8
Macintyre, Bailey, Gustafsson, Boussioutas, Haviv, Kowalczyk
The IPA results were used as a comparison to assess the accuracy of the GO annotation profiles reported for each cluster by GOMAC.
4
Cancer cDNA Microarray Test Data
For testing, a microarray dataset with various sample classes was required to demonstrate the potential of GOMAC to uncover biological similarities across classes. We used a published dataset [17] which has cDNA microarrays across 12 cancer types and their subtypes. The full dataset was filtered retaining only genes with greater than 400 signal intensity in the test channel (Cy5) and greater than 4 fold change (using per gene median normalised data) in at least 5 samples. This left 2185 genes and 165 samples: Breast(23), Colorectal(12), Gastric(7), Lung(Adenocarcinoma 10, Large Cell Carcinoma 8, Squamous Cell Carcinoma 9), Melanoma(11), Mesothelioma(5), Ovarian(21, Mucinous 11), Pancreatic(8), Prostate(5), Renal(12), Squamous Cell Carcinoma(11), Testicular(3), Uterine(9). The test set was clustered using regular k-means and GOMAC with the number of clusters C=10,20,30,40,50,100,200 and 300. The value C=40 provided the best granularity of GO terms for discussion and results presented in this paper are exclusively for C=40. An added bonus of this dataset is that novel biological hypotheses could be generated in terms of shared behaviour between cancers through using GOMAC.
5
Results
The dataset was clustered using the k-means clustering algorithm of Eisen et al [18] and with GOMAC. Additional hierarchical clustering was performed on the samples within each cluster using the Bioconductor Package Heatmap.2 [19]. The resulting dendrogram was cut so that the samples were partitioned into two groups. Table 1 contains the significance scores representing how well the partitioning of samples into two groups splits the sample sub-classes, without dividing the sub-classes themselves (histological enrichment criterion). Table 1 shows that GOMAC provided 3 additional biologically significant clusters over regular k-means clustering and improved the biological significance of approximately 55% of the partionable clusters. In addition, GOMAC resulted in a greater number of GO descriptors (terms) for the clusters. Ingenuity Pathway Analysis (IPA) was carried out on each cluster of genes to provide an external source of semantic validation (functional annotation criterion). Significantly reported functions and diseases for each cluster from IPA were grouped with the GO annotation profile of the cluster and the samples enriched by partitioning to see if there was any correlation. Table 2 gives a summary of the diseases and functions reported by IPA associated with a selection of the significant clusters.
Gene Ontology Assisted Exploratory Microarray Clustering
9
Table 1. The significance score reported in each instance is calculated on one of the partitions of samples. Only significance scores generated from the same partition sample size for the same cluster can be compared and are indicated with a *. N\A values were cases where the dendrogram could not be cut to partition the samples into two sizeable groups. In this case the cluster is likely to be representative of noisy data or ubiquitously expressed genes and is therefore uninteresting in this context. Clusters omitted from this table also fall into this category. The number of terms significnatly over-represented in the cluster are listed as an indication of the descriptive power of the clusters. Cluster k-means partition significance /GO terms 1* 3.6E-27 2 2* 2.8E-08 0 4 1.4E-08 1 5 3.9E-12 6 10* 2.4E-01 10 11 N\A 3 12 N\A 0 13* 4.9E-11 0 14 N\A 0 15 8.8E-20 0 16 5.2E-16 0 19 N\A 0
GOMAC partition significance /GO terms 4.7E-26 2 5.7E-05 1 N\A 0 4.5E-16 6 1.9E-02 10 8.9E-05 5 1.3E-13 0 1.9E-11 0 3.8E-18 0 1.6E-14 0 N\A 0 1.6E-02 1
Cluster k-means partition significance /GO terms 20* 3.6E-07 8 21* 1.4E-15 0 22 1.0E-14 1 24 2.6E-20 2 27 1.9E-10 1 33* 1.4E-10 5 36* 3.6E-07 0 37 N\A 7 38 N\A 0 39* 4.6E-09 2 40 N\A 0
GOMAC partition significance /GO terms 4.7E-06 8 1.3E-18 1 N\A 0 1.8E-17 2 N\A 0 6.0E-10 5 4.6E-09 1 3.6E-10 8 2.9E-09 2 3.6E-10 2 3.3E-07 1
Table 2. Three examples of the significant clusters identified by GOMAC are shown. The cancers identified are those that were partitioned into one group for that cluster. The genes belonging to the cluster are defined by the GO terms. The terms identified by the independent IPA analysis are reported and their p-values. Cluster GO terms 1 digestion steroid metabolism
5
38
Cancers Gastric Colorectal Muc. Ovarian Pancreatic
IPA Function/Disease metabolism of steroid transcription of GATA site digestive organ tumor pancreatic tumor colon cancer spleen development Breast guidance of motor axons urogenital system development Prostate size of prostate gland embryonic organ development breast cancer prostate gland development cancer of mammalia sex differentiation mammary tumor fatty acid metabolism genital tumor keratinization Lung-SCC ichthyosis epidermis development Mesothelioma development of epidermis SCC adhesion of cells differentiation of keratinocytes binding of stromal cells
P-value 3.06E-05 3.76E-04 4.33E-04 6.04E-04 7.15E-04 5.08E-06 1.25E-05 4.41E-05 9.87E-05 2.48E-04 4.67E-04 9.67E-05 2.03E-04 3.06E-04 3.40E-03 7.49E-03
10
6
Macintyre, Bailey, Gustafsson, Boussioutas, Haviv, Kowalczyk
Discussion and Future Work
Cancers from multiple sites in the body have been expression profiled in single datasets in the past. This was mainly done in order to design tools to identify the site of origin of Cancer of Unknown Primary [20, 21, 17]. In addition, meta analysis of multiple cancers was used to identify common themes in cancer gene expression [22]. The Gene Ontology is usually used only after the clustering of genes and samples has been done. Here we reasoned that since multiple genes are co-ordinately expressed by means of biological programs, such as cell types and organs, the use of the GO in the process of clustering would focus the analysis on the driving program rather than individual genes. Cumulative evidence during the last 50 years argues that cancer progression arises through accumulation of somatic changes in the cancer cell that confer selective advantage to the mutant cell in terms of extension and unlicensed extended lifespan. As these selection pressures are different in different organs of the body, one expects that some of the somatic changes would be organ specific. This point would be missed in classical expression profiles as different cancer types are not profiled on the same platform in the same instance. Therefore by using the cancer profiles of multiple samples in combination with GO clustering, we are positioned for the first time to address this possibility. While Table 1 demonstrates that both regular k-means and GOMAC can reveal gene clusters which can be partitioned to demonstate biology specific to certain cancer types, the improved significance and increased number of significant clusters provided by GOMAC suggests that clustering using the GO is advantageous. The greater number of GO terms uncovered by GOMAC also gives increased power in biological interpretation of the clusters. Therefore our method improves the ability to uncover biological processes that are specific to certain cancer types as each of the resulting clusters have been both reduced in noise and made more biologically informative. It is immediately obvious from the IPA overlay in Table 2 that genes associated with cancer processes have been identified. Moreover, many of the significant IPA terms actually match the cancers that were partitioned as being upregulated across the genes in the cluster. There are also examples of the overrepresented GO terms correlating with the IPA over-represented terms. This success in linking cancer types, with gene expression profiles and a statistically significant semantic description of the underlying biology, provides an excellent starting point for the exploration of the similarities and dissimilarities of various types of cancers. In fact, the GO terms identified for cluster 1 in Table 2, digestion and steroid metabolism, have clinical observations linked with the cancers significantly partitioned. The cancers in this cluster are predominantly derived from gastrointestinal and ovarian epithelium. The mucinous production of both these cancers may link them given steroid metabolism is featured in this cluster. Interestingly, the tumours in this dataset may be all derived from the gastrointestinal system. There are mucinous tumours of the ovary that have been found to be metastatic deposits from Gastric cancer primaries which have been termed Krukenberg tumours [23]. Furthermore, Krukenberg tumours have been
Gene Ontology Assisted Exploratory Microarray Clustering
11
linked to virilisation and hence another link with steroid metabolism. While this cluster was identified by standard k-means, it was also identified by GOMAC. This suggests that as well as GOMAC being able to identify a greater number of informative clusters than k-means (for example cluster 38 has a major shared similarity of squamous differentiation across the cancers in the group, with Mesothelioma being an exception), it can also retain initial informative clusters. Therefore, coupled with a similar analysis of normal tissues, these results can potentially uncover a combination of tissue specific and cancer effects which have not been identified before. The gene ontology tool however, suffers from a substantial flaw in its potential to assist the deciphering of genome language; the genes are curated according to whether they belong to a pathway, without discriminating between antagonistic to agonistic genes. Consequently, in our analysis, samples could appear to belong in the same group, while in fact they divide into two groups, based on whether the pathway is induced or repressed. This problem may be resolved by utilizing more advanced gene curation algorithms, such as those collected in Gene Set Enrichment Analysis [24], which represent genes that have been observed in microarray experiments as those responding to defined molecular changes, such as activating mutations or forced expression of defined genes. Interestingly, even before using such algorithms, integrating the GO into the clustering process improves the segregation of samples, and, in addition, it sheds new light on the biological processes that drive specific cancer types, and organ specific biological programs. Summary. We have shown through our analysis, that incorporation of additional biological information into the microarray clustering process in a biologically justified manner, can enhance the interpretability of microarray data. Specifically, we have shown the potential of such a method to unravel the complex nature of the biological processes involved in cancer. Ideally, our method would be repeated multiple times, while alternating the source of the ontology, the cancer types, and genes. Followed by ranking of the segregating lists according to significance, then formation of an integrated summary list, that records all possible drivers of the biological systematic variations among cancers in different organs. A key benefit of such an exercise would be hypothesis generation, in the field of cancer etiology with an organ specific focus.
References 1. Ashburner, M., et al: Gene ontology: tool for the unification of biology. Nat Genet 25 (May 2000) 25–29 2. Schlicker, A., Domingues, F., Rahnenfuhrer, J., Lengauer, T.: A new measure for functional similarity of gene products based on gene ontology. BMC Bioinformatics 7 (2006) 302 3. Zhang, P., Zhang, J., Sheng, H., Russo, J., Osborne, B., Buetow, K.: Gene functional similarity search tool (gfsst). BMC Bioinformatics 7 (2006) 135 4. Cheng, J., Cline, M., Martin, J., Finkelstein, D., Awad, T., Kulp, D., Siani-Rose, M.A.: A knowledge-based clustering algorithm driven by gene ontology. Journal of biopharmaceutical statistics 14 (August 2004) 687–700 PMID: 15468759.
12
Macintyre, Bailey, Gustafsson, Boussioutas, Haviv, Kowalczyk
5. Liu, J., Wang, W., Yang, J.: Gene ontology friendly biclustering of expression profiles. In: CSB 2004. Proceedings. 2004 IEEE. (2004) 436–447 6. Huang, D., Pan, W.: Incorporating biological knowledge into distance-based clustering analysis of microarray gene expression data. Bioinformatics (Oxford, England) 22 (May 2006) 1259–68 PMID: 16500932. 7. Pan, W.: Incorporating gene functions as priors in model-based clustering of microarray gene expression data. Bioinformatics (Oxford, England) 22 (April 2006) 795–801 PMID: 16434443. 8. Boratyn, G.M., Datta, S., Datta, S.: Incorporation of biological knowledge into distance for clustering genes. Bioinformation 1 (2007) PMC1896054. 9. Wang, H., Azuaje, F., Bodenreider, O., Dopazo, J.: Gene expression correlation and gene ontology-based similarity: an assessment of quantitative relationships. In: CIBCB ’04. Proceedings of the 2004 IEEE Symposium on. (2004) 25–31 10. Khatri, P., Draghici, S.: Ontological analysis of gene expression data: current tools, limitations, and open problems. Bioinformatics 21 (September 2005) 3587–3595 11. Castillo-Davis, C.I., Hartl, D.L.: Genemerge–post-genomic analysis, data mining, and hypothesis testing. Bioinformatics 19 (May 2003) 891–892 12. Al-Shahrour, F., Diaz-Uriarte, R., Dopazo, J.: Fatigo: a web tool for finding significant associations of gene ontology terms with groups of genes. Bioinformatics 20 (March 2004) 578–580 13. Martin, D., Brun, C., Remy, E., Mouren, P., Thieffry, D., Jacq, B.: Gotoolbox: functional analysis of gene datasets based on gene ontology. Genome biology 5 (2004) R101 PMID: 15575967. 14. Lee, S.G., Hur, J.U., Kim, Y.S.: A graph-theoretic modeling on go space for biological interpretation of gene clusters. Bioinformatics 20 (February 2004) 381– 388 15. Alexa, A., Rahnenfuhrer, J., Lengauer, T.: Improved scoring of functional groups from gene expression data by decorrelating go graph structure. Bioinformatics 22 (July 2006) 1600–1607 16. Zhong, S., Tian, L., Li, C., Storch, K.F., Wong, W.: Comparative analysis of gene sets in the gene ontology space under the multiple hypothesis testing framework. In: CSB 2004. Proceedings. 2004 IEEE. (2004) 425–435 17. Tothill, R.W., et al: An expression-based site of origin diagnostic method designed for clinical application to cancer of unknown origin. Cancer Res 65 (May 2005) 4031–4040 18. Eisen, M.B., Spellman, P.T., Brown, P.O., Botstein, D.: Cluster analysis and display of genome-wide expression patterns. Proceedings of the National Academy of Sciences 95 (December 1998) 14863–14868 19. Gentleman, R., et al: Bioconductor: open software development for computational biology and bioinformatics. Genome Biology 5 (2004) R80 20. Su, A.I., et al: Molecular classification of human carcinomas by use of gene expression signatures. Cancer Res 61 (October 2001) 7388–7393 21. Ramaswamy, S., et al: Multiclass cancer diagnosis using tumor gene expression signatures. PNAS 98 (December 2001) 15149–15154 22. Segal, E., Friedman, N., Koller, D., Regev, A.: A module map showing conditional activity of expression modules in cancer. Nat Genet 36 (October 2004) 1090–1098 23. Joshi, V.V.: Primary krukenberg tumor of ovary. review of literature and case report. Cancer 22 (December 1968) 1199–207 PMID: 4303165. 24. Subramanian, A., et al: Gene set enrichment analysis: a knowledge-based approach for interpreting genome-wide expression profiles. PNAS 102 (October 2005) 15545– 50 PMID: 16199517.