these graphic objects, which are all based on the same generic recognition algorithm. Keywords: Graphics .... Illustration of charbox extension. (a) Initial charbox ...
Genericity in Graphics Recognition Algorithms Liu Wenyin
Dov Dori
Faculty of Industrial Engineering and Management TechnionIsrael Institute of Technology, Haifa 32000, Israel {liuwy; dori}@ie.technion.ac.il We present the new version of the Graphics Recognition Module developed within the Machine Drawing Understanding System (MDUS) for the graphics recognition contest, to be held during the second IAPR Workshop on Graphics Recognition, Nancy, France, 1997. A generic integrated graphics recognition algorithm is adapted to meet the requirements of the contest: straight and circular, solid and dashed lines, horizontal and vertical text, and filled and hollow arrowheads. We present detailed algorithms for recognizing these graphic objects, which are all based on the same generic recognition algorithm. Keywords: Graphics Recognition, Text Segmentation, Line Detection, Arrowhead Detection
1. Introduction Graphics recognition, is a phase that follows vectorization and groups the raw wires resulting from the vectorization, according to a certain syntax into graphic objects. Text segmentation, line detection, and leader detection are examples of graphics recognition. Text segmentation can be done either at the raster level before vectorization, as in [1] and [2], or at the vector level, after vectorization, as in [3]. Fletcher and Kasturi [1] developed an algorithm for text string separation from mixed text/graphics image based on the generation of connected components and the application of Hough Transform to group together the components into logical character strings, which may then be separated from the text. Gao et al. [2] use small connected pixel areas as character candidates and group them into text string boxes, which can be of any orientation. Chai and Dori [3] proposed a vector-based algorithm for textbox extraction, which is done by clustering short bars that are close to each other through a region growing process. Lines are the most basic graphical primitives. They have two important attributes: style and shape. The line style refers to the continuity of the line, which may be solid (continuous), dashed, dash-dotted, or dash-dot-dotted. The line shape can be straight, circular, elliptic, free curved, or any other geometric shape. Bars (straight line segments) and polylines (bar chains) are relatively easy to detect, while arcs are more difficult, due to their complex geometry. Traditional Arc segmentation algorithms are based on either Hough Transform [4] or curvature estimation [5]. Vector-based arc segmentation has also been investigated [6]. Line style detection
has been studied by several groups [7-13]. Pao et al. [7] use a HT-based method to detect dashed circles and dashed straight lines in several steps. Vaxiviere and Tombre’s Celesstin system can detect both dashed lines and dash-dotted lines according to the French Standard NF E 04-103 [8]. Joseph and Pridmore [9] dealt with finding dashed lines in engineering drawings by looking for chains of short lines within the ANON system. Lai and Kasturi [10] have done work on detecting dashed lines in drawings and maps. They attempted to recognize dashed lines by linking short isolated bars under certain conditions in three passes. The dashed lines are not necessarily straight, as is the case in maps. Chen et al. [11] use the same method as in [10] to detect dashed lines of several patterns in the refinement of vectorized mechanical drawings. Agam et al. [12] and Dori et al. [13] have recently investigated the detection of dashed and dash-dotted lines with straight and curved shapes. The algorithm in [12] is pixel-based. The image of dashes is first separated from the drawing image and then processed using a set of tube-directional morphological operators to label the dashed lines. The algorithm in [13] is vector based. It applies the Sparse Pixel Vectorization algorithm [14] as a preprocessing step to produce solid vectors from image drawings. The algorithm examines only these bars instead of pixels and is therefore time efficient. Leader (arrowhead) detection has been investigated by Dori et al. [15], Lai and Kasturi [16], and Das and Langrana [17]. Dori et al. [15] search areas at wire endpoints for potential arrowheads by tracing lines orthogonal to the wire. If suitable variation of these line widths matches the arrowhead pattern, arrowhead candidates are found. Further test requires that there be a tail and a pointing reference. Lai and Kasturi [16] use the characteristics of arrowhead skeletonization, which are a long line and three short segments at the end, as a clue for arrowhead presence. Further test requires significant thickness change and enough black pixels in the arrowhead area. Das and Langrana [17] uses contour extraction of thick or filled in areas as processing of arrowhead detection. Suitable contour shapes are arrowhead candidates and their final direction is determined by the found dimension lines. In spite of the graphics recognition algorithms reported above, no research report has yet proposed to detect all classes of graphics in a generic, unifying algorithm. As of now, each class of graphic objects requires a particular detection algorithm. Moreover, in the process of detecting each class of graphics, almost all methods cluster all the potential constituent components at once, while the graphics attributes are determined later. This blind search procedure usually introduces inaccuracies in the grouping of the components, which ultimately account for inaccurate graphics recognition. A more flexible and adaptive approach is to constantly check the syntax rules and update the object’s parameters while grouping the components. This is the approach we follow in this work.
2. The Generic Graphics Recognition Algorithm The graphics recognition algorithms used in the Graphics Recognition Module (GRM) in MDUS are vector based, that is, the input is a set of vector fragments yielded by the Sparse Pixel Vectorization [14] module within MDUS. It advocates a
two step procedure, based on the Hypothesize-and-Test paradigm. The first step is the hypothesis generation, in which we assume the existence of a graphic object of the class being detected by finding its first key component. The second step is the hypothesis test, in which we prove the presence of such graphic object by constructing it from its first key component and its other component that are detected serially. The OPDs [18, 19] of the algorithm are shown in Figures 1 to 3. Figure 1 shows the first OPD of the algorithm, which includes two processes. In Figure 2, the Construction process of Figure 1 is blown up to reveal the following algorithmic details. An empty Graphic Object of the Graphic Class is first created by the “new” process. It is then filled with the Key Component object found by the FindKeyComponent process and transferred into the Construction process. The graphic object is further extended as far as possible in all possible directions by the Extension process—a stepwise recovery of its other components, which is blown up in Figure 3. First, an extension area is defined at the current extension direction. All candidates of possible components that pass the candidacy test are then found in this area and inserted into the candidate list, sorted by their nearest distance to the current graphic object being extended. The nearest candidate undergoes the extendibility test. If it passes the test, the current graphic object is extended to include it, and the process returns TRUE. Otherwise, the next nearest candidate is taken to pass the extendibility test, until some candidate passes the test. If no candidate passes the test, the extension process returns FALSE. After the current graphic object is extended to all extension directions, a final credibility test prevents the inclusion of false positives due to accumulative error. If the extended graphic object passes the test, it is added to the graphics database (GDB), otherwise it is deleted. Lenged Graphic Database (GDB) Object State/Value Process Aggregation-Particulation Agent link Instument link Effect link Consumption/Result link Process ownership indication Control link Process Blown up
{
Graphics Class Find Key Component Key Component Found Null return Construction
Figure 1. First level OPD of the Generic Graphics Recognition Algorithm.
All graphics recognition algorithms are specifications of the generic algorithm, in which, the processes FindKeyComponent, FillWith, FindMaxExtensionDirections, CredibilityTest, GetExtensionArea, CandidacyTest, and ExtendibilityTest, should be specified by the syntax of each particular class. The next three sections present the
details of the syntax specification of these processes for text segmentation, line detection, and leader detection, respectively. Graphics Class
Key Component
Construction new FillWith
Graphic Object
Result Success Failure delete =
Direction
0 Increase
Find Max Extension Directions
n
Compare With Result
Extension Result Success Failure CredibilityTest
Null
return
Result Success Failure
AddToGDB return
GDB A Detected Graphics
Figure 2. Blow up of the Construction process in Figure 1.
Graphic Object
Direction
Extension
GDB
Get Extension Area Slant Rectangle
Find Graphics Graphics List
SequentialRetrieval 0..m A Graphic Object Found Null CandidacyTest Candidate List
Result Failure Success
InsertAndSortByDistance SequentialRetrieval 0..m A Candidate Found Null False
ExtendibilityTest Result Failure Success
return True
Update return
Result
Figure 3. Blow up of the Extension process in Figure 2.
Readers that are not familiar with OPD representations may follow the processes and the control flows first, and refer to the details later.
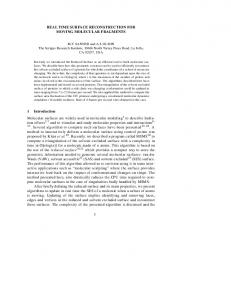
3. The Text Segmentation Algorithm In text segmentation, the charboxes (character box) are first segmented according to the features of character strokes (which are short, i.e., their maximal length-to-width ratio is 10). Close character boxes are then grouped to form either horizontal or vertical strings according to the boxes’ height to width ratio. Since only horizontal and vertical text is allowed, other slants are neglected. The text segmentation has three stages: charbox segmentation, text segmentation by charbox clustering, and final charbox and textbox determination. We define two classes: charbox (character box) and textbox (a string of charboxes). For charbox segmentation, the first key component is a stroke, i.e., a short bar, arc, or polyline, whose length is less than 10 times its width. The initial charbox is filled with the bounding box of the first stroke. The tentative orientation of a charbox is horizontal at this stage. There is only one extension direction. The extension area is the current charbox. The Candidacy test requires that the candidate be close enough to the already found strokes of the current charbox. The Extendibility test requires that the size of the union of the bounding boxes of the candidate and the current charbox be less than some predefined threshold. The Update process determines the final charbox as the union of the current charbox and the candidate. The Credibility test requires that the charbox be smaller than some predefined threshold. Figure 4 illustrates the charbox extension process.
(a)
(b)
(c)
(d)
Figure 4. Illustration of charbox extension. (a) Initial charbox construction with the bounding box of the first key component (stroke). (b) The slant stoke is found in the extension area, which is the current charbox, and the charbox is extended to become the union of the current charbox and the bounding box of the found stroke. (cd) Two more strokes are included in the charbox.
ABC ABC ABC (a)
(b)
(c)
Figure 5. Illustration of textbox extension. (a) Initial charbox construction with the first key component (charbox). (b) The initial textbox is extended to the left such that the left charbox is included in the textbox. (c) The textbox is further extended to the right.
For textboxes, the first key component is a charbox. The initial textbox is filled with the first charbox. The initial orientation is determined by the charbox aspect ratio: if the height of the charbox is bigger than its width, the textbox is horizontal, otherwise it is vertical. There are two extension directions, one towards left, and the other towards right. The extension area of a textbox is a charbox-sized rectangle located adjacent and to the left of the string if the current extension direction is 0, or
right of the string if the direction is 1. Any Charbox found in this area is clustered as a constituent of the current textbox if it is close enough (i.e., less than half the average charbox width) to the current textbox. Figure 5 illustrates the textbox extension process. The textboxes with single charbox are rotated by 90° and then extended in their new directions. If still no charbox can be included, their original orientation are restored.
4. The Line Detection Algorithm To apply the generic graphic object recognition approach to line detection, we have to “instantiate” it with the appropriate line syntax and semantics. We define six concrete line classes: bar (straight solid line), arc (circular solid line), dashed bar, dashed arc, (dash-dotted bar and dash-dotted arc). We abstract two line shape classes: straight and circular, and three line style classes: solid, dashed, and dashdotted. Each concrete line class inherits both from one of the two line shape classes and from one of the three line style classes. The first key component for a bar, or a dashed bar, or a dash-dotted bar is a single bar. The first key component of an arc is a polyline or a bar (a “monoline”). The first key component for a dashed arc or a dash-dotted arc is an arc or a bar. The initial line attributes are filled with the associated attributes of the first key components. All lines have exactly two endpoints. So a line can have at most two extension directions, one from each endpoint outward. The extension area is a square stretching from the current extending point outward along the direction tangent to the line at this point. The square size is determined by the allowable gap size of the line width and style. For solid lines, the size is twice the line width. For nonsolid lines, the size is twice the average gap between neighboring dashes of the current line. In the candidacy test, a thickness test is first done, which requires that the candidate and the current line have similar thickness, i.e., the absolute difference between the current line width and extending candidate width be less than a predefined threshold, which, in our application is set to 2 pixels. The collinearity of the line and the candidate is then checked. Finally, the proximity test checks if the distance between their closest ends is no more than an adaptive threshold determined by the line width and style, which is the same value as the extension area size. If the graphic object passes all three tests, it is inserted into the Candidate List sorted by increasing distance order. After all candidates are found, the first candidate in the candidate list is tested for extendibility to be joined to the current line. The extendibility test consists of both a shape test and a style test, which are discussed in the next two subsections. If the candidate passes the extendibility test, the current line’s attributes are updated using the candidate, and the process ends successfully. If not, the next candidate in the list is taken, if there is any, as input to the same procedure. If no candidate passes the test, the process ends unsuccessfully. 4.1 Line Shape Test and Line Shape Update For straight line detection, the line shape test requires that the distances of both endpoints of the candidate from the line’s media axis be less than half the current
line width, no matter what the line style is. In the line shape update process, the endpoint in the current extension direction is updated as the farther endpoint of the candidate. The length-weighted average of the current line width and the candidate width is used as the new line width. For circular line detection, the line shape test is the same as that of the Stepwise Recovery Arc Segmentation (SRAS) algorithm [20]. It apply to all the line styles we handle. Briefly, in the circular line shape test, a dynamic Potential Arc Center Area (PACA) is first defined, based on the current arc attributes. The PACA is a rectangle whose center is the current arc center and one of its edges is parallel to the current arc’s perpendicular bisector. The calculation of the size of the PACA depends on the radius and open angle of the current arc. After the PACA is determined, every point within it is tested as a candidate for being the new center. The average radius is first calculated by taking the average of the distances between the candidate—the potential arc center—and a number of characteristic points along the current arc’s medial axis. Since every (solid) arc results from a polyline or a group of polylines and bars, we use the original polyline and bar characteristic points to represent the arc’s characteristic points. When adding a polyline segment to the arc, we use the original polyline characteristic points in the radius update calculation. When adding a bar segment to the arc, we consider the two bar endpoints. The variance of the distances from the potential center to each one of these characteristic points is calculated for each potential center within PACA. The candidate with the minimal variance is selected as the final candidate. This point has to pass a final test, which requires that (1) the difference between the average arc radius calculated for this point and the distance from this point to each one of the arc’s characteristic points be less than half the width of the current arc; and (2) the difference between the same radius and the distance from this points to each one of the edges of the polyline formed by chaining all these characteristic points also be less than half the width of the current arc. If the final center candidate passes this test, it passes the entire shape test. The shape update process assigns it as the new arc center and extends the current arc with the new component, updating also the arc endpoints using the farthest endpoint of the newly added component as done in straight line extension. Updating the arc width is also similar to that of a straight line. 4.2 Line Style Test and Line Style Update The solid line style test requires that the candidate be a solid line, i.e., the gap (if there is any) between the current line and the candidate be less than twice the line width. The nonsolid line syntax specifies that a nonsolid line consists of at least 2 (or 3) equi-spaced dashes with the same line width, which are constrained by the same geometry and that the dashes are of about equal length in the case of a dashed line, and two alternating lengths, one for long dashes and very small length for short dashes (dots) in the case of a dash-dotted line. The nonsolid line style test requires the satisfaction of the following three conditions: •Gap similarity: The candidate should leave a gap that is similar to (i.e., between half and twice) the average gap of the current line.
•Length Similarity: The candidate’s length should be similar to (i.e., between half and twice) the average length of either the long dashes or the short dashes (dots). •Pattern: The candidate should follow the same pattern of alternating dashes and dots, i.e., dash-dash pattern for dashed lines, or dash-dot-dash pattern for dashdotted lines. Actually, the ratio of the number of dashes to the number of dots is used to control the pattern, allowing a predefined tolerance. The attributes of the dashed line, such as the average gap, average dash length, and average dot length are updated dynamically if the candidate extends the line. The Credibility test of line detection requires that all clustered components pass both the line shape test and the line style test once again with the final line attributes to avoid false detection due to cumulative error.
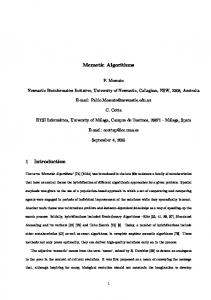
5. The Leader Detection Algorithm A leader is characterized as having an arrowhead, a thin tail attached colinearly to the back of the arrowhead (which may be filled or hollow), and a reference line at which the arrowhead points, attached orthogonally at the tip of the arrowhead. After sparse pixel vectorization [14], the filled arrowhead shown in Figure 6(a) frequently becomes several thick short bars, as in Figure 6(b). We select the tail, which is a thin bar, as the first key component of a leader. The arrowhead is the other component we want to find during the extension of the leader. The area for leader extension is a rectangle whose width is three times the tail width and whose length is nine times the tail width, and which stretches out from one endpoint of the tail, as shown in Figure 6(c). The thick bar found in this area is assumed to be the first component (the back part) of a filled arrowhead. The short orthogonal bar is assumed to be the first component of a hollow arrowhead. If the arrowhead is detected, the leader is completely detected because both its tail and arrowhead are found. The leader is also tried to be extended beyond the other endpoint of its tail in the same way to see if an arrowhead is also attached to the other edge of the tail, which is the case of a double arrowhead leader. In the initial construction of the filled arrowhead, the endpoint that is close to the tail is used as the back of the arrowhead and the other endpoint is used as the tip of the arrowhead. The arrowhead is further extended to its tip direction to find other parts (collinear short thick bars) of the arrowhead one by one while verifying that their widths gradually decrease until the width is less than the tail width, or until an orthogonal reference is encountered. This is similar to bar extension, except that a width decrease is required. first component to extend the arrowhead
arrowhead tip
leader tail arrowhead back reference
(a)
leader extending area
first component to extend the leader
arrowhead extending area
(b)
Figure 6. Leader detection. (a) image. (b) vectorization. (c) arrowhead detection.
(c)
We define a hollow arrowhead as an equi-lateral triangle whose edges are thin lines. For hollow arrowhead extension, two wedges of the hollow arrowhead, which intersect at the arrowhead tip, should be found simultaneously.
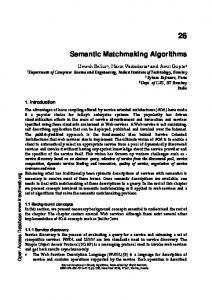
6. Experiments and Performance Evaluation We have tested the Graphics Recognition Module in MDUS with many drawings. Figure 7(a) is a small part of a synthetic image downloaded from the contest organizer’s URL [21]. Since the arrowheads are not displayed, we do only solid and dashed line detection and text segmentation. The result is displayed in Figure 7(b), in which segmented textboxes are displayed as rectangles. As we can see from Figure 7(b), the algorithm correctly detects a horizontal dashed line, a slant dashed line, an arc, several solid lines, and two textboxes. However, a slant dashed line is not detected because its dashes are missegmented as textboxes. The correctly detected slant dashed line is not extended to the most extent because the dash on one end is misdetected as a small arc. The overall performance evaluation of the algorithm with synthetic drawings has fully been done during the contest. As evaluated by the organizers of the contest, the algorithm is the best among all the three participants for mechanical engineering drawings recognition. However, although the algorithm is designed with some parametric tolerances and should be less noise sensitive, the noise perturbation effect is not fully tested. Further evaluation using degraded synthetic drawings should be done to test the robustness and noise sensitivity of the algorithm.
References [1] L.A. Fletcher and R. Kasturi, “A Robust Algorithm for Textbox String Separation from Mixed Text/Graphics Images”, IEEE Trans. PAMI, 10(6), pp 900-918, 1988. [2] Gao J., Tang L. Liu W. and Tang Z., “Segmentation and Recognition of Dimension Texts in Engineering Drawings”, ICDAR95, Montreal, Canada, pp 528-531, 1995. [3] I. Chai and D. Dori, “Extraction of Text Boxes from Engineering Drawings”, Proc. SPIE/IS&T Symposium on Electronic Imaging Science and Technology, Conference on Character Recognition and Digitizer Technologies, San Jose (CA, USA), SPIE Vol. 1661, pp 38-49, 1992. [4] R. S. Conker, “Dual Plane Variation of the Hough Transform for Detecting Non-Concentric Circles of Different Radii”, CVGIP, 43, pp 115-132, 1988. [5] P. L. Rosin and G. A. West, “Segmentation of Edges into Lines and Arcs”, Image and Vision Computing, 7(2), pp 109-114, 1989. [6] D. Dori, “Vector-Based Arc Segmentation in the Machine Drawing Understanding System Environment”, IEEE Transactions on PAMI, 17(11), pp 1057-1068, 1995.
[7] D. Pao, H. F. Li, and R. Jayakumar, “Graphic Feature Extraction for Automatic Conversion of Engineering Line Drawings”, ICDAR91, France, pp. 533-541, 1991. [8] P. Vaxiviere, and K. Tombre, “Celesstin: CAD Conversion of Mechanical Drawings”, IEEE Computer, 25(7), pp 46-54, 1992. [9] S. H. Joseph and T. P. Pridmore, “Knowledge-Directed Interpretation of Mechanical Engineering Drawings”, IEEE Trans. on PAMI, 14(9), pp 928-940, 1992. [10] C. P. Lai, and R. Kasturi, “Detection of Dashed Lines in Engineering Drawings and Maps”, ICDAR91, France, pp 507-515, 1991. [11] Y. Chen, N. A. Langrana, and A. K. Das, “Perfecting Vectorized Mechanical Drawings”, Computer Vision and Image Understanding, 63(2), pp 273-286, 1996. [12] G. Agam, H. Luo and I. Dinstein, “Morphological Approach for Dashed Lines Detection”, Graphics Recognition -- Methods and Application, eds. R. Kasturi and K. Tombre, (LNCS, vol. 1072), Springer, Berlin, pp 92-105, 1996. [13] D. Dori, Liu W. and M. Peleg, “How to Win a Dashed Line Detection Contest”, Graphics Recognition -- Methods and Application, eds. R. Kasturi and K. Tombre, (LNCS, vol. 1072), Springer, Berlin, pp 286-300, 1996. [14] Liu W. and D. Dori, “Sparse Pixel Tracking: A Fast Vectorization Algorithm Applied to Engineering Drawings”, ICPR96, Vienna, Austria, Vol. III (Robotics and Applications), pp 808-812, 1996. [15] D. Dori, Y. Liang, J. Dowell and I. Chai, “Spare Pixel Recognition of Primitives in Engineering Drawings”, Machine Vision and Applications, 6, pp 69-82, 1993. [16] C. P. Lai and R. Kasturi, “Detection of Dimension Sets in Engineering Drawings”, IEEE Trans. on PAMI, 16(8), pp 848-855, 1994. [17] A. K. Das and N. A. Langrana, “Recognition of Dimension Sets and Integration with Vectorized Engineering Drawings”, ICDAR95, Montreal, Canada, pp 347350, 1995. [18] D. Dori, “Object-Process Analysis: Maintaining the Balance Between System Structure and Behaviour”, Journal of Logic and Computation, 5(2), pp 227-249, 1995. [19] Liu W. and D. Dori, “Algorithm Specification Through Object-Process Diagrams”, To appear in Proceedings of the Third International Workshop on the Next Generation Information Techniques and Systems, Neve Ilan, Israel, June 30-July 3, 1997. [20] D. Dori and Liu W., “Arc Segmentation from Complex Line Environments— A Vector-Based Stepwise Recovery Algorithm”, ICDAR97, Ulm, Germany, pp 76-80, 1997. [21] http://graphics.nynexst.com/iapr-tc10/contest.html [22] Liu W. and D. Dori, “A Protocol for Performance Evaluation of Line Detection Algorithms”, Machine Vision Applications, 9(5), pp 240-250, 1997.
(a)
correctly detected dashed lines correctly segmented textboxes
dashes misdetected as textboxes (b)
correctly recognized arc missed dash due to being recognized as an arc
Figure 7. Graphics recognition result: (a) image, (b) recognized graphic objects.