A new field of application for the intelligent techniques and computer vision in the textile printing industry is investigated in this paper. An automatic video system ...
Poster P27
GENETIC ALGORITHM FOR TEXTILE PATTERN RECOGNITION Dan Marius Dobrea, Mirela Blaga “Gh. Asachi” Technical University, Iasi, Romania
Abstract A new field of application for the intelligent techniques and computer vision in the textile printing industry is investigated in this paper. An automatic video system – conceived to be used in an industrial environment – was designed with the purpose to discover different kinds of textile printing errors and to stop the printing process anytime an error appears. The main research goal of this paper was to test the concepts of the intelligent algorithm used to find the specific error pattern. The new introduced system consists of two main parts: the image processing module (IPM) and the genetic detection module. The system was not designed to take into consideration the harsh operating environments of the industrial applications or any other specific conditions such as: lighting, temperature, vibration. This aspect will make the point of our future research work. I. Introduction One of the main trends in textile industry consists in the reduction of the ordering size, requiring in the same time higher quality products and short delivery times. In the textile printing industry diverse textile prints are obtained from different complex repeated patterns such as the ones presented in Figure 1(a). At this moment, in order to obtain these complex patterns, the following techniques are widely used: flat-bed screen printing, rotary screen printing, ink jet textile printing, engraved roller printing and heat transfer printing. {a} {b} {b} {a}
{a} {b}
(b) Printing errors generated by the improper alignment of the printing screens (a) Figure 1. (a). A part of a baby sheet, (b). A specific sheet detail showing an error of printing
Among these the rotary screen printing and the ink jet textile printing are widely affected by an error known under different names, such as: misfit, out of registration, poorly registered or double image. It was argued that up to 10 % of the printed goods, designated as first quality products, contain some level of misfit error embedded in the printing. This out of registration ATC’06 – 34th Aachen Textile Conference, November 29-30, 2007
Poster P27
is a print defect caused by improper alignment of the printing screens or by an incorrect alignment of the different elements in a printing job. As a result, different colored elements on the printing job are incorrectly printed next to each other or over each other, Figure 1(b). For example, in Figure 1(b) the red squares, {a}, overlap the pink squares, {b}, and, as a result, different color areas are printed over another color areas and, more, white gaps appear on the printing. In the fabrics worldwide, in order to obtain first quality textile products, the quality inspection is generally made using the manual human inspection. All the limitations of the manual inspection, together with the consideration that the general trend in the textile industry is towards automation, have created an opportunity for the use of the automatic visual inspection systems. A study of the literature related to the textile pattern analyses reveals the difficulty encountered by the scientists in solving the problems that the textile industry raises to the intelligent systems and to the automatic vision inspection field of science. The majority of these papers deal with the textural defects or with the detection of the knit units in textiles. The detection of the knit units aims to locate blocks of grid nodes misplaced in order to underline different types of errors. As a rule, to detect different textile defects a set of images – covering the whole variety of defects encountered in the fabric –, is used as the input into the automatic video system. In the classical approach the system is composed of a preprocessing subsystem, used in feature extraction, and a classification module (e.g. neural network) used to classify the defects by means of the extracted features. In the training stage the classification system learns the defects and thus it becomes capable to obtain in the test stage the correct recognition of the defect(s). In order to extract the features characterizing a textile texture from an image the discrete cosine transform is widely used [1], [2]. Unfortunately, this transform did not give any good results [2]. The discrete cosine transform is an under-optimal Karhunen-Loeve transformation. From this reason other researchers used directly Karhunen-Loeve transformation, [3], [4] or an improved version of it [4]. One of the key factors in order to obtain higher classification rates is the features used in the classification system. In order to find the optimal features the following features or transforms were also used: statistics [5], [6], wavelets, [7], [8], independent component analysis [9], Markov random fields [4], Gaussian Markov random fields [10], Gabor filters [11], [12], etc. Also, there are some approaches that combine a large series of features to obtain superior results. In [2] it was used a combination of methods such as histogram manipulation, Gabor filtering and statistic moments. The correct recognition rate on the test set of images was 89% for five kinds of different defects. The authors of the paper [13] conducted a study using another combination of features: second-order gray level statistics, first-order difference statistics, gray level run length statistics and neighboring gray level dependence matrix. To implement the classification system the neural networks are widely used (e.g. multilayer perceptron trained with backpropagation algorithm [2] or support vector machine [6]). Another approach used in the detection of the flaw patterns is based on a Neyman-Pearson detector [3]. The unconventional methods are another methods used in the detection of the textile errors. Using distorted grid structures a specific knit-structure in a textile can be determined [14]. ATC’06 – 34th Aachen Textile Conference, November 29-30, 2007
Poster P27
The grid is modeled as a deformable template. This method is based on the theories of template matching and Bayesian image restoration. After the knit structure has been correctly located, the grid can underline some errors such as the location of the bend in knit-structure. II. Experimental work. Material and method The new implemented system consists of two main parts: the image processing module and the genetic algorithm (GA) detection module. Our method is based on an unconventional operational mode. Moreover, we have also a preprocessing stage. But, the preprocessing stage does not extract any features that will be subsequently used by a classification system. The main function of the preprocessing algorithms is only to obtain an image where a special pattern to clearly come out. This special pattern will appear only if a printing error occurs. If the textile is correctly printed this specific pattern will not be present. After the preprocessing stage, based on a template the GA will detect the specific pattern that characterizes a particular printing error. The both modules (the image processing and the genetic detection module) were developed and tested using the MATLAB® environment. II.1. The image processing module (IPM) The main objective of the IPM is to reveal the specific patterns that appear only when a printing error occurs. The second goal is to preprocess the acquired image in such a mode in order to minimize the data storage and the computing costs of the entire system. Since this application deals with images and all these types of applications are considered data-intensive and computing-intensive, the second objective is a very important one if we count the final goal: to obtain intelligent system able to discover, in real time, different types of printing defects.
(b)
(a)
The template used by the GA Zone 1
(c)
Zone 2
Zone 3
Areas were the specific pattern
(d)
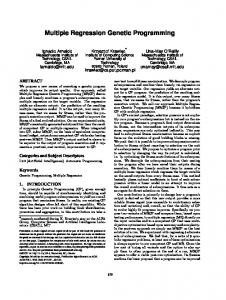
Figure 2. (a). The acquired image. (b). The gray image obtained in the first step of image processing module. (c). The filtered image. (d). The binary image. ATC’06 – 34th Aachen Textile Conference, November 29-30, 2007
Poster P27
In the first step of the IPM the acquired image is converted from a RGB image, Figure 2(a), to a gray scale one, Figure 2(b). In order to obtain the gray image, the RGB acquired image is converted to a NTSC one, where the hue and saturation planes were set to zero; finally, the image is converted back to RGB color space. In this final RGB image all the planes have the same information. From this image one of the color planes was considered to be the gray scale image. In Figure 2(b) the knit-structure of the material is present and easily visible. Mainly because the goal of this paper is to identify the printing error, the knit-structure of the textile material had to be removed. Moreover, the specific pattern (that appears when a printing error is present) is obtained at the intersection of different colored elements of the printing job. As a result, the algorithm designed to remove the knit-structure had to preserve the edge of the printed elements. In order to satisfy these requirements a 7-by-7 neighborhoods median filter was used. Hence, the value of each output pixel of the image, Figure 2(c), was determined by the median value of the neighborhood pixels. The algorithm arranged the pixel values of the analyzed window (7x7 pixels neighborhood) in an increasing order and picked up only the middle value. In the last step of the image processing algorithm the edges were find using the Canny algorithm. This method computes the local gradient using a derivative of a Gaussian filter. The main advantage of the method is given by the two thresholds used to detect strong and weak edges. The algorithm includes the weak edges only if they are connected to the strong edges. The result is presented in Figure 2(d). This resulting image is a binary one in which the Candy operator places the value 1 for the edges and the value 0 in the rest of the image. The specific pattern determined by a printing error has a rotated “T” form and it can be easily emphasized on the binary image, Figure 2(d). Further a GA is used to identify this particular pattern. II.2. The genetic detection module Modern stochastic optimization techniques, such as GA, proved to be an efficient solution to our problem. Such algorithms attempt to simulate Darwin’s theory of natural selection: the stronger individuals are likely to survive in a competing environment. In a similar way, the GA evaluates many solutions of an assigned problem and, by combining them, the best one can be found. A very important property of the GA-based search methods is that they maintain a population of potential solutions, while all other methods process a single point of the search space. Another strong point of the GA is its specific property given by the fact that its algorithm does not require functional derivative information to search for a set of parameters that minimizes (maximizes) a given objective function. The GA considers the solution of the optimization problem as an individual (whose characteristics are due to the genes of his chromosomes). The basic steps of the GA algorithm can be described as follows: • •
initialize population repeat • select individuals for mating • mate individuals to produce offsprings • mutate offsprings • insert offsprings into population until stopping criteria
ATC’06 – 34th Aachen Textile Conference, November 29-30, 2007
Poster P27
The employed GA algorithm was from the Genetic Algorithm Toolbox, version 1.2 developed by the Department of Automatic Control and Systems Engineering, University of Sheffield, England [15]. In order to identify the error, the GA algorithm used a special fitness function based on a template matching score. The k-th chromosome was expressed by using the form: Ck = ( xk, yk, αk )
(1)
The chromosomes encode both, the angle (α) of rotation and the center position (x, y) of the template, Figure 2(d). The template is a matrix of 17 x 17 pixels and it is presented in Figure 2(d). In this template the background takes the value 0 and the pattern takes the value 1. In order to find the error determined by a printing error, we compare parts of the binary image, image (x, y) with the different versions of the rotated template, pattern (i, j) using for this the coordinate position and the angle resulted from the GA evolutions. The fitness function for the k-th chromosome counts the number of disagreements between the template and the image zone: fitness
k
=
1 norm . factor
8
8
∑ ∑
i = −8 j = −8
image ( x k + i , y k + j ) − pattern ( i + 8 , j + 8 , α k )
(2)
It was tested different crossover methods (one point, two and three points), as well as different selection schemes: Rank Selection, Roulette Wheel Selection, Tournament Selection, Stochastic Uniform Sampling Selection, Stochastic Remainder Sampling Selection, etc. For our problem the most efficient crossover operator proved to be the two-point one, while the most effective selection scheme proved to be the Stochastic Remainder Sampling Selection. III. Results For the tests we have run, the medium number of generations for convergence was 145 (for a population of 30 individuals, with 0.9 probability of crossover and 0.001 probability of mutation) with an approximate run time of 3 seconds. In Table 1 we show for the same processed image (Figure 2(d)), the final stage of the genetic algorithm evolution for four different initial populations, indicating: the final best six individuals of the population (coordinates and the rotating angle of the associated template and corresponding fitness), the number of generations for convergence and the final solution. The detection unit had the ability to identify – in maximum 250 generations and without any doubts a specific pattern. In our case the GA stopped when the population converged – this was supposed to happen when the minimum fitness for at least 40% of the chromosomes was less than 0.01 from the best fitness of the current population. If in 250 generations the population did not converged we concluded that the pattern was not found and there was not any printing error.
ATC’06 – 34th Aachen Textile Conference, November 29-30, 2007
Poster P27
Table 1. The final solutions for four instances of the genetic algorithm (x coordinate, y coordinate, α rotating angle) → fitness
Population 1
Population 2
Population 3
Population 4
(244, 285, 193) → 0.36
(400, 275, 199) → 0.3182
(561, 240, 190) → 0.24
(244, 285, 193) → 0.36
(244, 285, 193) → 0.36
(399, 275, 199) → 0.3182
(561, 240, 190) → 0.24
(244, 285, 193) → 0.36
(244, 285, 193) → 0.36
(400, 275, 199) → 0.3182
(561, 240, 190) → 0.24
(244, 285, 193) → 0.36
(244, 285, 193) → 0.36
(400, 275, 199) → 0.3182
(561, 240, 190) → 0.24
(244, 285, 193) → 0.36
(244, 285, 193) → 0.36
(400, 275, 199) → 0.3182
(561, 240, 190) → 0.24
(244, 285, 193) → 0.36
(244, 285, 193) → 0.36
(400, 275, 199) → 0.3182
(561, 240, 190) → 0.24
(244, 285, 193) → 0.36
Generations
39
242
167
211
Solution
(244, 285, 193) → 0.36
(400, 275, 199) → 0.318
(561, 240, 190) → 0.24
Place
Zone 1, Figure 2(d)
Zone 2, Figure 2(d)
Zone 3, Figure 2(d)
Final best six individuals
(244, 285, 193) → 0.36 Zone 1, Figure 2(d)
IV. Conclusions In this paper we present a new approach to detect textile printing errors based on an unconventional type of intelligent system. The “heart” of the intelligent system is a GA. If in a classical classification system the recognition rate directly characterizes the algorithm performances, in this new system this parameter is replaced with the convergence time. The main problem of this new introduced system is the time interval required for convergence. For our case the GA converged in maximum 250 generations. The processing time from the image acquisition to the pattern identification is around 3 seconds. If we consider that the image processing unit and the genetic detection module are developed and implemented in the Matlab environment, it is easy to see that in order to boost up the execution time the both modules must further be implemented on C or C++ environment. The method reported in this paper is not a particular one. When a different printing error occurs and another specific pattern appears, the only algorithm modifications that must be considered are related to the definition of the new considered pattern. References 1.
Bennamoun, M., Bodnarova, A., Automatic visual inspection and flaw detection in textile materials: past, present and future; IEEE International Conference on Systems, Man, and Cybernetics, 11-14 Oct, 5, p. 4340-4343, (1998).
2.
Teodorescu, T-D., Chirita, R., Automatic feature selection for textile defects discrimination; Symposium on Signals, Circuits and Systems, 14-15 July, 2, p. 481-484, (2005).
3.
Mamic, G., Bennamoun, M., Automatic flaw detection in textiles using a NeymanPearson detector; 15th International Conference on Pattern Recognition, 4, p. 767-770, (2000). ATC’06 – 34th Aachen Textile Conference, November 29-30, 2007
Poster P27
4.
Ozdemir, S., Ercil, A., Markov random fields and Karhunen-Loeve transforms for defect inspection of textile products; IEEE Conference on Emerging Technologies and Factory Automation, 18-21 Nov, 2, p. 697-703, (1996).
5.
Abouelela, A., Abbas, I., Eldeeb, I., Nassar, S., A statistical approach for textile fault detection; Int. Conference on Systems, Man and Cybernetics, 4, p. 2857-2862, (2000).
6.
Murino, V., Bicego, M., Rossi, I-A., Statistical classification of raw textile defects, 17th International Conference on Pattern Recognition; 23-26 Aug., 4, p. 311- 314, (2004).
7.
Fujiwara, H., Zhong, Z., Hatta, H., Koshimizu, H., Visual inspection of textile surfaces with translation invariant wavelet shrinkage; 30th Annual Conference of IEEE Industrial Electronics Society, 2-6 Nov., 2, p. 1252- 1257, (2004).
8.
Xuezhi, Y., Jun, G., Grantham, P., Nelson, Y., Textile defect classification using discriminative wavelet frames; IEEE International Conference on Information Acquisition, 27 June-3 July, 5 pp., (2005).
9.
Sezer, O-G., Ertuzun, A., Ercil, A., Automated inspection of textile defects using independent component analysis; IEEE 12th Signal Processing and Communications Applications Conference, 28-30 April, p. 743- 746, (2004).
10. Cohen, F-S., Fan, Z., Attali, S., Automated Inspection of Textile Fabrics Using Textural Models; IEEE Transactions on Pattern Analysis and Machine Intelligence, 13(8), p. 803808, (1991). 11. Bodnarova, A., Bennamoun, M., Latham, S-J., A constrained minimisation approach to optimise Gabor filters for detecting flaws in woven textiles; IEEE International Conference on Acoustics, Speech, and Signal Processing, 6, p. 3606-3609, (2000). 12. Bodnarova, A., Bennamoun, M., Latham, S-J., Textile flaw detection using optimal Gabor filters; 15th International Conference on Pattern Recognition, 4, p. 799-802, (2000). 13. Siew L-H., Hodgson R-M., Wood E-J., Texture Measure for Carpet Wear Assessment; IEEE Transactions on Pattern Analysis and Machine Intelligence, 10(1), p. 92-105, (1998). 14. Hartelius K., Carstensen J-M., Bayesian Grid Matching; IEEE Transactions on Pattern Analysis and Machine Intelligence, 25(2), p. 162-173, (2003). 15. Genetic Algorithm Toolbox, Department of Automatic Control and Systems Engineering, University of Sheffield, England, http://www.shef.ac.uk/acse/research/ecrg/gat.html
ATC’06 – 34th Aachen Textile Conference, November 29-30, 2007