Genetic Algorithm Optimization for Mooring Systems Sérgio Alvares R. de S. Maffra Department of Computer Science PUC-Rio Rua Marquês de São Vicente, 225 Rio de Janeiro, Brazil
[email protected]
Marco Aurélio C. Pacheco Department of Electrical Engineering PUC-Rio Rua Marquês de São Vicente, 225 Rio de Janeiro, Brazil
[email protected]
Abstract The present article describes the application of Genetic Algorithms (GA) [1] to mooring systems used in offshore oil exploitation. The GA seeks an optimum positioning of the anchors that minimizes the vessel offset due to environmental conditions such as wind, wave and sea currents. The computation of the static equilibrium position of the vessel, as proposed by the GA, is accomplished by using the catenary equilibrium equation on each mooring line in order to obtain the out-of-balance forces on the vessel, and by using an iterative process for computing the final vessel’s equilibrium position. The GA evaluation function consists of the square of the sum of each vessel offset associated with each different set of environmental conditions. Examples which explore and validate the main features of the proposed algorithm are also presented and discussed.
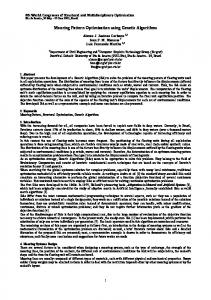
I. INTRODUCTION With the growth of the oil demand, companies have been forced to explore offshore oil reservoirs. The high cost of such operations has brought relevance to studies that seek to improve the technologies involved in offshore oil exploitation, such as mooring systems. Several factors must be taken into consideration when designing a mooring system, such as the composition of the mooring lines (they are generally composed of different materials with different physical properties and costs), the layout of the seabed (in order to avoid topographical constraints or the contact with lines belonging to a nearby mooring system), environmental conditions, and the amount of time during which a vessel has to remain anchored, among others. We believe that mooring systems is a domain that offers many opportunities for optimization strategies, as the choices involved on the design of such systems have a clear effect on their cost and effectiveness. Fig. 1 illustrates a typical mooring system considered in this work. Each mooring line is connected to an anchor, which lies on the seabed. The environmental conditions are modeled as external forces applied to the vessel. The placement of a line consists in choosing the spatial coordinates of the corresponding anchor. Given an initial state of the mooring system and a set of environmental conditions, we can evaluate the final static equilibrium position of the vessel by solving a system of nonlinear equations that arises when we treat each mooring line as a nonlinear spring attached to the vessel. The role played by the GA consists in providing the position of each anchor in the model.
Ivan Fábio Mota de Menezes Tecgraf PUC-Rio Rua Marquês de São Vicente, 225 Rio de Janeiro, Brazil
[email protected]
Vessel
Anchors Lines
Fig. 1: Typical mooring system.
The remaining sections of this work are organized as follows: Section II presents some of the important considerations regarding the design of mooring systems as well as the specific problem to be assessed. In Section III, the basic theoretical background on GA is presented together with a brief discussion about the proposed algorithm. Finally, some experiments and the results obtained are described in Section IV, followed by some conclusions about the present work.
II. MOORING SYSTEMS DESIGN Several factors must be taken into account when designing a mooring system, such as the time the vessel will remain anchored, the strength of the materials employed in the mooring lines, and the different sets of environmental conditions the vessel will be subject to, just to mention a few of them. Mooring lines may be composed of segments, each one made with materials with different physical properties and costs. Buoys or weights can be attached to them in order to deal with restrictions imposed either by other mooring systems or by the layout of the seabed. As it generally occurs in actual engineering problems, cost effectiveness is clearly an issue in mooring design sytems. The selection of materials, the definition of the environmental conditions imposed on the lines and any other design choices will influence both the cost and the effectiveness of the system. Genetic Algorithms [1] have proven to be an efficient search and optimization tool for problems with a large number of variables, difficult mathematical modeling and large search spaces. GAs are particularly useful in solving engineering problems, such as those of mooring systems. The design of mooring systems allows different optimization choices, such as the global cost of the system and the system’s reliability – which can be measured as a function of the maximum admissible tension on the
mooring lines and the actual tension applied to them – among others. The problem chosen to be treated is the minimization of the offset of a vessel, which can be defined here as the variation of its position due to external forces. Our goal is to obtain, for a set of previously defined mooring lines, the position of their anchors that will minimize the vessel offset.
III. GENETIC ALGORITHMS Evolutionary Algorithms are search tools whose main operators are inspired on natural evolution. Among these algorithms, we have selected GAs to handle the proposed problem. GAs perform search by means of a biological evolution simulation. At first, a population of individuals is randomly generated. Each individual (or chromosome) is a string that encodes, by means of a particular mapping, a potential solution to a given problem. The GA then performs selection, crossover and mutation operations over the individuals. These operations correspond, respectively, to the principles of survival of the fittest, recombination of genetic material and mutation observed in nature. The selection step is probabilistic, but it favors individuals that have been assigned higher fitness values. Fitness is a scalar measure of the performance of an individual according to the problem specification. The crossover operator splices the contents of two randomly chosen strings, producing two new individuals or offsprings. Finally, the mutation operator changes a particular string position at random and is applied with low probability. The search process is carried out through the generation of successive populations until a stop criterion is met. It is expected that the average population fitness will gradually increase along the generations [1,3]. In the design of mooring systems, the aim is to define the position of the anchors, which lie on the seabed, in order to achieve the equilibrium position of the vessel. The position of each anchor will be determined by the GA, described in the following sections.
the position of the vessel and the length of the mooring line through the following formulas:
X max = X vessel + X fairlead + L X mín = X vessel + X fairlead − L,
(2)
where X fairlead corresponds to the coordinate of the point where the mooring line is connected to the vessel. It is expressed in the vessel’s local coordinate system. L represents the mooring line’s length. There is one gene in the chromosome for each mooring line. B. Genetic Operators, Population Initialization, Selection and Reproduction The genetic operators adopted are simple mutation and one-point crossover. The initial population is created randomly and the selection of individuals for reproduction is based on a rank-based roulette wheel. The steady-state technique is used for the reproduction of a GAP percentage of the individuals in each generation [1, 3]. C. Fitness Evaluation Function A set of environmental conditions relevant to our mooring problem consists of wave, wind and sea current. We can convert each set defined by such environmental conditions into a resulting external force (Fi ) applied to the vessel. For each Fi , we can compute the corresponding vessel offset (d i ). Considering n acting environmental conditions, the fitness evaluation function (E) can be expressed as:
n E = ∑ di i= i
2
(3)
A. Chromosome Representation
D. Computation of the Offset
The representation establishes a straightforward mapping between the mooring system’s topology and the integer strings processed by the GA. The genes used in our GA are composed of the X and Y coordinates of the anchors (the Z coordinate is obtained by projecting the anchor’s position onto the plane that models the seabed). Each coordinate is a binary string representing a real number in a determined interval. Gene decoding is made by the following equation:
In the computation of the vessel offset, the mooring lines are treated as nonlinear springs which impose restoring forces on the vessel. Such forces, expressed as a function of the horizontal distance between the anchor and the fairlead, are obtained by means of the restoring curves of each mooring line – which are generated using the catenary equation. Once the out-of-balance forces are obtained, a new static equilibrium position of the vessel is computed by solving the following system of nonlinear equations:
X real = X binary ×
(Vmax
− Vmin ) + Vmin , 2 −1 k
(1)
where X corresponds to one coordinate; k is the length of the binary string representing X; and Vmin and Vmax are the coordinate domain limits. They are defined according to
K u = Fi − Rint ,
(4)
where K is the global stiffness matrix, u is the offset vector to be found, Fi corresponds to the external forces due to
the environmental conditions, and Rint is the resultant of the restoring forces considering all mooring lines. The solution of the above system of equations leads to a new position of the vessel. This computation is repeated until the displacement obtained is smaller than a given tolerance (convergence criterion) – that is, until the system reaches the final static equilibrium position. Further details on the computation of vessel offset can be found in [2]. E. Penalizing Invalid Solutions The solutions proposed by the GA that do not achieve convergence in the offset computation are penalized. Since the evaluation of the offset for non-converging solutions is not possible, it is set to the largest offset computed so far.
IV. RESULTS A. Parameters Table I shows the parameters common to all experiments: TABLE I General Parameters used in the Experiments. Sea Water Level Population Mutation Rate Crossover Rate GAP
500 m 50 0.001 0.60 0.95
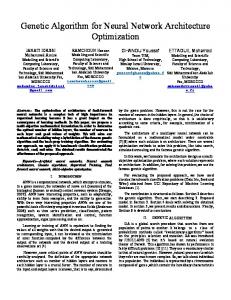
The performance graphs of the GA shown in each experiment correspond to an average of 10 trials of the evaluation for the best solutions at each generation [1].
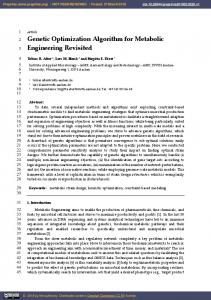
Fig. 2: Anchor Positions for Experiment 1
140 120 100 80
Best Offline
60 40 20 0
B. Experiment 1
0
5
10
15
20
25
30
35
600
The model used in this experiment consists of four identical mooring lines, without the presence of any environmental condition. Each variable was represented with 14 bits. The smallest offset computed for this configuration was 0.63 m. The solution is shown in Fig. 2. Contrary to one’s expectation, the lines are not uniformly distributed in the plane (Fig. 2). Note that the arrangement of the lines is not taken into consideration by the fitness function. Also, the tensions at the fairleads of lines A and D are greater than that of line C. Fig. 3 shows the average results of 10 experiments. Of the 15000 function evaluations performed in this experiment, only 232 did not achieve convergence. An optimal solution for this experiment would be an offset of 0.0 m, which would correspond to a symmetrical arrangement of the four anchors – for example, each anchor placed at the same distance from the vessel and with a 90o angle between each other.
500 400 Online
300
Average 200 100 0 0
5
10
15
20
25
30
35
Fig. 3: Performance Graphs for Experiment 1
C. Experiment 2 This experiment shows the configuration obtained for the same lines used in Experiment 1, but with the addition of an external force with direction (1,1,0) and intensity equal to 4200 kN. Each variable in this experiment was represented with 10 bits.
D. Experiment 3 Another experiment with four mooring lines, but with a few cases of environmental conditions acting on the vessel. Table II indicates the resulting external forces: TABLE II External forces acting on the vessel – Experiment 3. Direction ( 1, 1, 0 ( 0, 1, 0 ( 0,-1, 0 ( 1, 0, 0 (-1, 0, 0
) ) ) ) )
Intensity (kN) 0 3000 3000 3000 3000
It is important to emphasize how the algorithm uses the different environmental conditions. Each external force is applied independently. This means that the offset being minimized is the sum of the offsets caused by each external force. The anchor positions proposed by the algorithm must be adequate for all environmental conditions. The total offset computed for this experiment was 22.36 m. Fig. 4: Anchor Positions for Experiment 2
60.00 50.00 40.00 Best Offline
30.00 20.00 10.00 0.00 0
5
10
15
20
25
30
35
14000.00 12000.00 10000.00 8000.00
Online Average
6000.00 4000.00 2000.00 0.00 0
5
10
15
20
25
30
35
Fig. 5: Performance Graphs for Experiment 2
Notice how the tensions at the fairleads of lines A and D increased in order to balance the external force (Fig. 4). The offset computed for this experiment was 3.62 m.
Fig. 6: Anchor Positions for Experiment 3
The anchor positions proposed by the GA made lines A, C and D be more tensioned than line B. The triangular arrangement of these three lines offers good resistance for all cases of environmental conditions (Fig. 6).
900 800 700 600 500
Best
400
Offline
300 200 100 0 0
10
20
30
40
50
60
70
3000 2500 2000 Online
1500
Average
The minimum value found for the sum of all offsets was 78.92 m. Even though this value is much greater than the ones found in previous experiments, this can be an acceptable result. In general, offsets equal to 5% of the sea water level (500 m in this experiment) are commonly accepted. Since this value corresponds to the sum of all offsets, the average offset would be equal to 16.0 m, which is within the limits for an admissible offset. As one can see on Fig. 8, the tension at the fairlead of line E is smaller than those of the other mooring lines. A more effective use of line E would probably result in a smaller offset. Fig. 9 shows the performance graphs for the experiment. As the curve best indicates, had the experiment been carried on, better anchor positions could have been found.
1000 500
250 0 0
10
20
30
40
50
60
70
Fig. 7: Performance Graphs for Experiment 3
200
150 Best Offline 100
Of the 3000 function evaluations made in this experiment, 326 did not achieve convergence.
50
0 0
E. Experiment 4
5
10
15
20
25
30
35
1800
This experiment was made with a model containing eight mooring lines. The set of environmental conditions is the same one used in Experiment 3. The representation of each variable used 14 bits.
1600 1400 1200 1000
Online Average
800 600 400 200 0 0
5
10
15
20
25
30
35
Fig. 9: Performace Graphs for Experiment 4
In this experiment, almost 10% of the function evaluations did not achieve convergence (132 out of 1500).
F. Analysis of the experiments In the experiments with the presence of external forces, we have verified the non-convergence of up to 10% of the function evaluations performed. In some examples, this corresponds to the loss of an entire generation of the GA. Observing the average curve of the performance graphs, one can see how sensitive the fitness function is.
Fig. 8: Anchor Positions for Experiment 4
for this situation is to allow the algorithm to remove and include lines in the model. V. CONCLUSIONS We consider the experiment successful as a feasibility test of the use of Genetic Algorithms in the design of mooring systems. Nevertheless, the algorithm implemented must be revised for practical use. The study of currently used mooring systems (spread mooring, catenaries, taut legs and single-point mooring) can guide this revision [2]. VI. ACKNOWLEDGEMENTS
Fig. 10: Minimum and Maximum Distances for Anchors
There are two possible causes for the non-convergence of models: either the equilibrium was not possible with the external forces acting on the vessel or the check for an equilibrium situation was not possible due to errors on the generation of restoring curves, which represent the tensions at the top of each mooring line. One cause for the latter are the limits chosen for Vmax and Vmin. Fig. 10 illustrates the limits for which the generation of the restoring curves is possible. The current algorithm allows the anchors to be positioned under the vessel and does not take the sea water level into consideration. The limits it uses for the variables are greater than the physically feasible ones. Using as limits points C and D (Fig. 10) is certain to reduce the number of non-convergence errors.
Fig. 11: Importance of the Definition of Environment Conditions
Fig. 11 illustrates the importance of the definition of the external forces acting on the vessel. The model shown in this figure has no external forces. Note that with the anchor positions proposed by the GA the vessel is practically free on the X direction. Since the GA is guided by its evaluation function, it has no knowledge of such fact. For a practical algorithm it is necessary to introduce new considerations into the evaluation function of the GA. Among them, one that avoids problems like the one shown on Fig. 11 and one that makes sure that all lines are effectively used. Lines whose tension is much smaller than others’ in the same model are not being effectively used. One alternative
Most of the computation in the present work have been performed in Tecgraf/PUC-Rio (Techonlogy Group in Computer Graphics) [4] using the Prea3D program. The authors are especially grateful to the Prea3D group for providing the resources necessary for this research.The development of Prea3D program is supported by CENPES/PETROBRAS. The Genetic Algorithm implemented here was based on GENESIS, developed by John J. Grefenstette [5].
REFERENCES [1] D. Goldberg, “Genetic Algorithms in Search, Optimisation and Machine Learning”, AddisonWesley, 1989. [2] “Basic Concepts on Calculation of Anchoring Systems using Ariane program. User’s Manual”, Bureau Veritas do Brasil, 2000. [3] Z. Michalewicz, “Genetic Algorithms in Search, Optimisation and Machine Learning”, AddisonWesley, 1989. [4] Tecgraf/PUC-Rio, www.tecgraf.puc-rio.br [5] John J. Grefestette, “A User’s Guide To GENESIS”, Version 5.0, 1990.