Hindawi Publishing Corporation Sarcoma Volume 2008, Article ID 431019, 7 pages doi:10.1155/2008/431019
Research Article Genetic Profiling Differentiates Second Primary Tumors from Metastases in Adult Metachronous Soft Tissue Sarcoma Josefin Fernebro,1 Ana Carneiro,1 Anders Rydholm,2 Henryk A. Domanski,3 Anna Karlsson,1 ˚ Borg,1 and Mef Nilbert1, 4 Ake 1 Department
of Oncology, Institute of Clinical Sciences, Lund University Hospital, 221 85 Lund, Sweden of Orthopedics, Institute of Clinical Sciences, Lund University Hospital, 221 85 Lund, Sweden 3 Department of Pathology, Institute of Clinical Sciences, Lund University Hospital, 221 85 Lund, Sweden 4 Clinical Research Centre, Hvidovre Hospital, Copenhagen University, 2650 Hvidovre, Denmark 2 Department
Correspondence should be addressed to Josefin Fernebro,
[email protected] Received 23 July 2008; Revised 7 October 2008; Accepted 1 December 2008 Recommended by Cyril Fisher Purpose. Patients with soft tissue sarcomas (STS) are at increased risk of second primary malignancies, including a second STS, but distinction between metastases and a second primary STS is difficult. Patients and Methods. Array-based comparative genomic hybridization (aCGH) was applied to 30 multiple STS of the extremities and the trunk wall from 13 patients. Different histotypes were present with malignant fibrous histiocytomas/undifferentiated pleomorphic sarcomas being the predominant subtype. Results. aCGH profiling revealed genetic complexity with multiple gains and losses in all tumors. In an unsupervised hierarchical cluster analysis, similar genomic profiles and close clustering between the first and subsequent STS were identified in 5 cases, suggesting metastatic disease, whereas the tumors from the remaining 8 patients did not cluster and showed only weak pairwise correlation, suggesting development of second primary STS. Discussion. The similarities and dissimilarities identified in the first and second STS suggest that genetic profiles can be used to distinguish soft tissue metastases from second primary STS. The demonstration of genetically different soft tissue sarcomas in the same patient suggests independent tumor origin and serves as a reminder to consider development of second primary STS, which has prognostic and therapeutic implications. Copyright © 2008 Josefin Fernebro et al. This is an open access article distributed under the Creative Commons Attribution License, which permits unrestricted use, distribution, and reproduction in any medium, provided the original work is properly cited.
1.
INTRODUCTION
The first observations of an increased risk of secondary sarcoma development came from individuals treated for childhood cancers such as retinoblastoma, leukemia, Wilms’ tumor, Hodgkin’s lymphoma, and sarcoma [1–13]. However, also adult soft tissue sarcoma (STS) patients have been shown to be at higher risk of a second primary malignancy, with a particularly increased risk of a second primary STS [14–17]. STS have been associated with several hereditary syndromes, the most common being neurofibromatosis and the Li-Fraumeni syndrome [18]. Treatment-induced sarcomas include sarcomas associated with Stewart-Treeves syndrome and radiation-induced angiosarcomas, which develop median 10 years after radiotherapy [19]. However, after exclusion of STS in neurofibromatosis patients and STS that developed in irradiated fields, an increased risk of a second primary STS remains [17]. Metachronous STS
has been described in 1% of sarcoma patients [16, 17, 20] and this observation constitutes the basis for our study on similarities/differences in the genetic profiles of tumors from patients with multiple STS. We applied array-based comparative genomic hybridization (aCGH) that utilizes BAC clones with tiling coverage of the whole genome and allows detailed copy-number analysis, to a series of 30 metachronous STS of different histopathological subtypes from 13 patients. 2. 2.1.
PATIENTS AND METHODS Patients
Adult patients (≥16 years of age) who developed two or more STS at different anatomical sites before development of any detectable pulmonary metastases were eligible for the study. Patients with neurofibromatosis type I and the LiFraumeni syndrome were excluded. In the southern Swedish
2
−1
0
1
Case 10 1st STS Case 8 1st STS Case 11 2nd STS Case 13 2nd STS Case 3 1st STS Case 3 2nd STS Case 5 1st STS Case 6 3rd STS Case 6 2nd STS Case 6 4th STS Case 6 1st STS Case 9 1st STS Case 9 2nd STS Case 12 2nd STS Case 12 1st STS Case 2 1st STS Case 2 3rd STS Case 2 2nd STS Case 1 1st STS Case 1 2nd STS Case 4 2nd STS Case 7 1st STS Case 8 2nd STS Case 5 2nd STS Case 3 3rd STS Case 7 2nd STS Case 4 1st STS Case 10 2nd STS Case 11 1st STS Case 13 1st STS
cancer registry, 20 patients who fulfilled these criteria were identified. The tumors had been operated either at the musculoskeletal tumor center in Lund (n = 24) or at local hospitals in the southern Swedish health care region (n = 6). The clinicopathological reports were reviewed to confirm tumor location and to rule out that the second primary STS represented a local recurrence and the histopathological slides were reviewed by a sarcoma pathologist (H.D.) to confirm the diagnoses. Frozen tumor tissue was available from 16 tumors and paraffin-embedded tissue was used from 28 tumors without systematic differences related to tumor source. After DNA extraction, 7 individuals (14 tumors) were excluded because of poor DNA quality in at least one of the tumors from the same patient. High-quality aCGH data were obtained from 30 tumors (in 15 of which DNA was extracted from frozen tissue) from 13 patients (Table 1). These patients contributed with two to four STS and were mean 73 (28–83) years at diagnosis of the first STS. The second STS developed median 3 (1–7) years after the first STS. No neoadjuvant chemotherapy was given, and only one patient (case 5) had recieved postoperative chemotherapy after the first STS. Radiotherapy had been administered to four patients (postoperatively in case 5, 6, and 8, and preoperatively in case 1), but none of the second STS developed within the irradiated field. Clinical data for the 13 cases are presented in Table 1. The lower extremity was the most common tumor site (16 tumors) and 28 tumors were high-grade (grades 3 and 4 on a 4-tiered scale). The first STS included eight malignant fibrous histiocytomas/undifferentiated pleomorphic sarcomas (MFH/UPS), two leiomyosarcomas, two malignant peripheral nerve sheath tumors (MPNST), and one pleomorphic liposarcoma. The histopathological diagnosis of the second STS differed from the first in two patients; a leiomyosarcoma was diagnosed in a patient with two prior MFH/UPS and a leiomyosarcoma was diagnosed in a patient previously operated on for an MPNST. In the remaining patients, including the three cases from which three or four distinct tumors were analyzed, multiple STS of the same histopathological type were diagnosed. In 9/13 patients the STS developed at different anatomical locations, for example, different extremities or extremity and trunk wall. Three patients developed metachronous STS in the same extremity but at different locations, for example, lower leg and thigh (cases 8, 12, and 13) and one patient (no. 7) developed two STS in the same extremity; a deep-seated leiomyosarcoma in the medial thigh and five years later a subcutaneous leiomyosarcoma in the lateral part of the thigh (Table 1). Clinical follow-up was complete for a minimum of 8 years for the survivors. During follow-up, two patients (cases 12 and 13) developed local recurrences, 1 and 10 years after primary surgery. Lung metastases developed in 5/13 patients, median 50 (range 15–51) months after diagnosis of the primary tumor. Apart from the metachronous STS, two patients (cases 4 and 7) developed adenocarcinomas of the breast and the colon, respectively. Ethical permission for the study was granted from the Lund University ethics committee.
Sarcoma
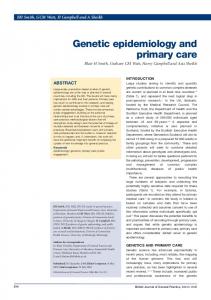
Figure 1: Unsupervised hierarchical cluster analysis of all 30 soft tissue sarcomas from 13 patients. The analysis was based on the ∼ 17 000 clones that survived the preprocessing filters, and close clustering of the metachronous STS was demonstrated in 5 patients (case 1, 2, 6, 9, and 12 marked with different colours), whereas the STS from the remaining 8 patients were scatter in the analysis. Clustering was done using the TMeV application from the TM4 microarray software suit.
2.2.
DNA extraction and array-based comparative genomic hybridization
Genomic DNA from frozen (n = 15) and paraffinembedded (n = 15) tumors was extracted using the Wizard Genomic DNA Purification kit (Promega, Madison, WI) and overnight proteinase-K digestion treatment followed by phenol-chloroform purification. When paraffin-embedded tissue was used, a fresh4-µm section was obtained, stained with hematoxylin & eosin and a representative tumor area was chosen. Thereafter, 1-mm tissue cores were obtained and used for DNA extraction. The tissue cores were pretreated in xylene before proteinase-K treatment and phenolchloroform purification. DNA quality was checked using a Ready-To-Go RAPD analysis kit (Amersham Biosciences, Buckinghamshire, UK), and the concentration was measured using a Nano drop (NanoDrop Technologies, Wilmington, Del, USA). Commercial genomic male DNA, derived from
80
82
80
79
76
77
75
60
83
73
28
77
76
M
F
F
F
M
F
F
F
M
M
M
F
M
Right foot
Right thigh
Right trunk wall
Left knee
Left thigh (laterally)
Right lower arm
Left lower arm
Right shoulder
Right lower leg
Lower leg
Right thigh
Right upper arm
Trunk wall
First tumor
Site
MFH/UPS
MFH/UPS
MPNST
MFH/UPS
LMS
MPNST
MFH/UPS
MFH/UPS
MFH/UPS
MFH/UPS
LS
MFH/UPS
LMS
Type
4
2
1
1
4
4
4
5
7
1
1
2
3
Type
Years after first tumor
MFH/UPS MFH/UPS
Right thigh∗
LS
MFH/UPS
LMS
Right thigh
Left shoulder
Left buttock
Left cheek
2
3
Right thigh
Back
Scalp
Left lower leg
Left thigh (medially)
Right thigh
Right lower leg
Left thigh
MFH/UPS
MFH/UPS
MPNST
MFH/UPS
LMS
LMS
MFH/UPS
MFH/UPS 9
Scalp
Third tumor
Site
Right lower leg†
Similar genomic profiles suggestive of metastatic disease
Second tumor
Site
Right lower arm
Different genomic profiles suggestive of second primary tumors
Years after first tumor
MET/50
Follow-up status/months
LMS
LS
MET/51
MET/51
TD/32
MET/15
TD/28
NED/56
NED/54
NED/163
TD/164
NED/36
TD/22
MFH/UPS MET/47
Type
MFH/UPS = malignant fibrous histiocytoma/undifferentiated pleomorphic sarcoma, LMS = leiomyosarcoma, LS = liposarcoma, MPNST = malignant peripheral nerve sheath tumor. ∗ Located 15 cm from the first tumor. † The patient developed one additional LS, left thoracic wall. MET: metastases, TD: tumor death, NED: no evidence of disease.
13
11
10
8
7
5
4
3
12
9
6
2
1
Case Sex Age no.
Table 1: Summary of clinical data from the 30 STS analyzed from 13 patients.
p/f
p/f
f/p
f/p
p/f
f/p
f/p
f/f
p/f
p/f
f/p/p
p/f/p
f/f
Tumor source frozen/paraffin
Josefin Fernebro et al. 3
4
Sarcoma Table 2: Recurrent high-level amplifications and homozygous deletions.
Chromosome
No of tumors
Cytoband
Start position
Size (Mbp)
HLA/Hz del∗
1
2
1p32.1
58571482
1.2
HLA
1
3
1q44
241558190
1.0
Hz del
3
2
3q23
141082484
0.51
Hz del
3
3
3p12.1–3
78780218
7.0
HLA
4
2
4q12
54016334
1.5
HLA
6
3
6p 12.3–21.2
37360640
11.4
HLA
9
6
9p21.3
21647433
2.4
Hz del
CDKN2A, CDKN2B, MTAP
10
2
10q23.31
89538420
1.5
Hz del
PTEN
11
2
11q13.4–5
71730097
5.3
HLA
13
13
13q14.2
47901160
0.65
Hz del
∗ HLA
Cancer related genes JUN
PDGFRA, KIT, CHIC2
RB1
= high level amplification, Hz del = homozygous deletion.
a pool of healthy individuals, was used as a reference (Promega, Madison, Wiss, USA). CyDye coupling/labeling was carried out using a random labeling kit (Invitrogen Life Technologies, Carlsbad, Calif, USA) according to the manufacturer’s recommendations. In short, 2-µg genomic tumor DNA and reference DNA were differentially labeled with fluorescent dyes, Cy3 for tumor tissue, and Cy5 for reference DNA. After a purification step, these were pooled, mixed with COT-1 DNA to block repetitive DNA sequences, dehydrated and resuspended in a formamidebased buffer (Invitrogen). The labeled DNA was then applied to arrays pretreated in washing solutions (Pronto! Microarray Reagent System, Corning Labsystems, Corning, NY, USA) and hybridization was performed for 48–72 hours at 37◦ C. The incubation was performed under cover slips for the DNA isolated from the frozen tumor material whereas the MAUI hybridization System (BioMicro systems Inc., Salt Lake City, Utah, USA) was used for the DNA derived from paraffin-embedded tumors. Dye-swaps (i.e., complementary hybridization in which Cy5 was used for tumor tissue and Cy3 for reference DNA) were used in three cases and allowed subtraction of dye-related noise. The slides were treated in post-hybridization washing solutions and finally scanned using an Agilent Microarray scanner (Agilent Technologies, Palo Alto, Calif, USA).
2.3. BAC array platform The BAC array slides used were produced at the Swegene DNA Microarray Resource Center, Department of Oncology, Lund University. These have an average resolution of 80 kb and contain a total of 32 433 BAC clones from the 32 k human genome high-resolution BAC rearrayed clone set, version 1.0 from the BACPAC Resource Center at Children’s Hospital Oakland Research Institute (Oakland, Calif, USA) (http://bacpac.chori.org/). The clones provide >99% coverage of the fingerprint map and current sequence assembly with a resolution of 100 kb.
2.4.
Data analysis
Image analysis and data extraction were carried out using GenePix Pro 4.1.1.4 version (Axon Instruments Inc., Foster City, CA, USA) and the quantified data matrix was then uploaded into the web-based BioArray Software Environment (BASE; http://gothmog.thep.lu.se/int/index) [21], where all data management and analysis were carried out. The background correction and intensities of Cy3 and Cy5 were calculated using the median feature and median-local background intensities of the uploaded files, and the intensity ratios were calculated using the background corrected spot intensities by calculating the log2 ratios of tumor to reference intensity. In BASE a preliminary filter, based on the flagging in the image analysis, was applied, and spots with a diameter 60% of the tumors) being deletions of 10q24.3–25.2, 13q12.1–12.2, 13q21.1–21.2, 16q13–23.2, 18q12.2–12.3, and amplifications of 1q21.3–23.1 and 19p13.3. Unsupervised hierarchical cluster analysis, based on the ∼ 27 000 clones that survived the filters in BASE, revealed close clustering of the tumors from five individuals without significant differences between the first and subsequent STS (43% and 41% of the genome altered) (Figure 1 and Table 1, cases 1, 2, 6, 9, and 12). These tumor pairs showed strong similarities between the genomic plots (Figure 2(a)) with a mean correlation of 0.7 (0.5–0.9). The many shared alterations outnumbered the few differences in all five cases and deletions identified in the first tumor were always present in the second STS. The median time interval between the first and second STS in these five patients was 1 (1– 7) year, and two of these patients subsequently developed lung metastases. In the remaining eight cases STS from the same individual did not cluster together and showed a significantly weaker correlation, mean 0.1 (0–0.4). These tumors had pronounced intertumor variability (30% of the genome being altered in the first tumor compared to 42% in the subsequent tumors), which was comparable to the interpatient variability, which had a mean correlation of 0.1 (0.04–0.2). In four of these cases, deletions present in the first tumor were not present in the subsequent tumor, which supports independent tumor origin. The second STS in these eight cases developed median 4 (1–5) years after the first STS and three of the patients later developed pulmonary metastases. 4.
DISCUSSION
Despite multidisciplinary and multimodality treatment, distant metastases develop in about 30% of STS patients. Hematogenous, pulmonary metastases predominate, whereas lymphatic spread occurs in