Civil 3D, it is recommended that you explore the tutorials after you have read
through the ... C:\Program Files\AutoCAD Civil 3D 2009\Help\civil_ug.pdf. Use
the ...
AutoCAD Civil 3D 2009
Getting Started
237A1-050000-PM01A
April 2008
©
2008 Autodesk, Inc. All Rights Reserved. Except as otherwise permitted by Autodesk, Inc., this publication, or parts thereof, may not be reproduced in any form, by any method, for any purpose. Certain materials included in this publication are reprinted with the permission of the copyright holder.
Trademarks The following are registered trademarks or trademarks of Autodesk, Inc., in the USA and other countries: 3DEC (design/logo), 3December, 3December.com, 3ds Max, ActiveShapes, Actrix, ADI, Alias, Alias (swirl design/logo), AliasStudio, Alias|Wavefront (design/logo), ATC, AUGI, AutoCAD, AutoCAD Learning Assistance, AutoCAD LT, AutoCAD Simulator, AutoCAD SQL Extension, AutoCAD SQL Interface, Autodesk, Autodesk Envision, Autodesk Insight, Autodesk Intent, Autodesk Inventor, Autodesk Map, Autodesk MapGuide, Autodesk Streamline, AutoLISP, AutoSnap, AutoSketch, AutoTrack, Backdraft, Built with ObjectARX (logo), Burn, Buzzsaw, CAiCE, Can You Imagine, Character Studio, Cinestream, Civil 3D, Cleaner, Cleaner Central, ClearScale, Colour Warper, Combustion, Communication Specification, Constructware, Content Explorer, Create>what's>Next> (design/logo), Dancing Baby (image), DesignCenter, Design Doctor, Designer's Toolkit, DesignKids, DesignProf, DesignServer, DesignStudio, Design|Studio (design/logo), Design Your World, Design Your World (design/logo), DWF, DWG, DWG (logo), DWG TrueConvert, DWG TrueView, DXF, EditDV, Education by Design, Exposure, Extending the Design Team, FBX, Filmbox, FMDesktop, Freewheel, GDX Driver, Gmax, Heads-up Design, Heidi, HOOPS, HumanIK, i-drop, iMOUT, Incinerator, IntroDV, Inventor, Inventor LT, Kaydara, Kaydara (design/logo), LocationLogic, Lustre, Maya, Mechanical Desktop, MotionBuilder, Mudbox, NavisWorks, ObjectARX, ObjectDBX, Open Reality, Opticore, Opticore Opus, PolarSnap, PortfolioWall, Powered with Autodesk Technology, Productstream, ProjectPoint, ProMaterials, Reactor, RealDWG, Real-time Roto, Recognize, Render Queue, Reveal, Revit, Showcase, ShowMotion, SketchBook, SteeringWheels, StudioTools, Topobase, Toxik, ViewCube, Visual, Visual Bridge, Visual Construction, Visual Drainage, Visual Hydro, Visual Landscape, Visual Roads, Visual Survey, Visual Syllabus, Visual Toolbox, Visual Tugboat, Visual LISP, Voice Reality, Volo, Wiretap, and WiretapCentral The following are registered trademarks or trademarks of Autodesk Canada Co. in the USA and/or Canada and other countries: Backburner, Discreet, Fire, Flame, Flint, Frost, Inferno, Multi-Master Editing, River, Smoke, Sparks, Stone, and Wire All other brand names, product names or trademarks belong to their respective holders. Disclaimer THIS PUBLICATION AND THE INFORMATION CONTAINED HEREIN IS MADE AVAILABLE BY AUTODESK, INC. "AS IS." AUTODESK, INC. DISCLAIMS ALL WARRANTIES, EITHER EXPRESS OR IMPLIED, INCLUDING BUT NOT LIMITED TO ANY IMPLIED WARRANTIES OF MERCHANTABILITY OR FITNESS FOR A PARTICULAR PURPOSE REGARDING THESE MATERIALS. Published By: Autodesk, Inc. 111 Mclnnis Parkway San Rafael, CA 94903, USA
Contents
Chapter 1
Introduction . . . . . . . . . . . . . . . . . . . . . . . . . . . . 1 Installation . . . . . . . . . . . . . . . . . . . Installing on a Single Computer . . . . . Installing on a Network . . . . . . . . . Highlights of AutoCAD Civil 3D . . . . . . . . What’s New in AutoCAD Civil 3D 2009 . Project Management . . . . . . . . Survey . . . . . . . . . . . . . . . . Pipe Networks . . . . . . . . . . . Labels . . . . . . . . . . . . . . . . Surfaces . . . . . . . . . . . . . . . Grading . . . . . . . . . . . . . . . Alignments . . . . . . . . . . . . . Profiles . . . . . . . . . . . . . . . Corridors . . . . . . . . . . . . . . Mass Haul . . . . . . . . . . . . . . Google Earth . . . . . . . . . . . . Hydraulics and Hydrology . . . . . Sample Data Provided with the Program . . . . Tutorial Drawing Files . . . . . . . . . . Getting Started Guide Drawing Files . . . Best Practices Guide Drawing Files . . . . Sample Drawing Templates . . . . . . . . Learning How to Use AutoCAD Civil 3D . . . .
. . . . . . . . . . . . . . . . . . . . . . .
. . . . . . . . . . . . . . . . . . . . . . .
. . . . . . . . . . . . . . . . . . . . . . .
. . . . . . . . . . . . . . . . . . . . . . .
. . . . . . . . . . . . . . . . . . . . . . .
. . . . . . . . . . . . . . . . . . . . . . .
. . . . . . . . . . . . . . . . . . . . . . .
. . . . . . . . . . . . . . . . . . . . . . .
. . . . . . . . . . . . . . . . . . . . . . .
. . . . . . . . . . . . . . . . . . . . . . .
. . . . . . . . . . . . . . . . . . . . . . .
. . . . . . . . . . . . . . . . . . . . . . .
. . . . . . . . . . . . . . . . . . . . . . .
.1 .1 .2 .2 .2 .2 .2 .3 .3 .3 .3 .4 .4 .4 .4 .4 .5 .5 .5 .5 .5 .6 .6
iii
Getting Started Guide . . . . . . . . . . . . . . Online Tutorials . . . . . . . . . . . . . . . . . Help System . . . . . . . . . . . . . . . . . . . . Civil 3D Best Practices Guide . . . . . . . . . . . Moving from Land Desktop to Civil 3D Guide . Skill Builders . . . . . . . . . . . . . . . . . . . Autodesk Training Programs and Products . . . . . . .
Chapter 2
. . . . . . .
. . . . . . .
. . . . . . .
. . . . . . .
. . . . . . .
. . . . . . .
. . . . . . .
.6 .7 .7 .7 .7 .8 .8
. . . . . . . . . . . . . . . . . . . . . . .
. . . . . . . . . . . . . . . . . . . . . . .
. . . . . . . . . . . . . . . . . . . . . . .
. . . . . . . . . . . . . . . . . . . . . . .
. . . . . . . . . . . . . . . . . . . . . . .
. . . . . . . . . . . . . . . . . . . . . . .
. . . . . . . . . . . . . . . . . . . . . . .
. . . . . . . . . . . . . . . . . . . . . . .
. . . . . . . . . . . . . . . . . . . . . . .
. . . . . . . . . . . . . . . . . . . . . . .
. . . . . . . . . . . . . . . . . . . . . . .
. . . . . . . . . . . . . . . . . . . . . . .
. . . . . . . . . . . . . . . . . . . . . . .
. . . . . . . . . . . . . . . . . . . . . . .
. . . . . . . . . . . . . . . . . . . . . . .
. 11 . 13 . 15 . 16 . 16 . 18 . 19 . 20 . 21 . 24 . 25 . 25 . 25 . 26 . 27 . 28 . 29 . 31 . 33 . 35 . 35 . 36 . 37
Using Styles and Settings . . . . . . . . . . . . . . . . . . . . . 39 Managing Styles . . . . . . . . . . . . Types of Styles . . . . . . . . . . . . . Object Styles . . . . . . . . . . . Label Styles . . . . . . . . . . . Managing Label Styles . . Table Styles . . . . . . . . . . . Table Tags . . . . . . . . . . . . Band Styles . . . . . . . . . . . Profile and Section View Styles . Using Styles with Layers . . . . . . . . Label Objects . . . . . . . . . . . . .
iv | Contents
. . . . . . .
Designing with Objects . . . . . . . . . . . . . . . . . . . . . . 11 Object Model . . . . . . . . . . . . . . . Object Relationships . . . . . . . . Object Interface . . . . . . . . . . . . . . Toolspace for Object Management . Prospector Tab . . . . . . . . . Settings Tab . . . . . . . . . . Survey Tab . . . . . . . . . . . Toolbox Tab . . . . . . . . . . Menu Standardization . . . . . . . . Shortcut Menus . . . . . . . . . . . Layout Tools . . . . . . . . . . . . . Consistent Editing Methods . . . . Item View . . . . . . . . . . . Grips . . . . . . . . . . . . . . Panorama Window . . . . . . Property Editors . . . . . . . . AutoCAD Properties Editor . . Exercise: Familiarization Tour . . . . Standard Controls for Styles and Labels . Precision Layout Strategies . . . . . . . . Object Building Blocks . . . . . . . . . . Corridors . . . . . . . . . . . . . . Pipe Networks . . . . . . . . . . . .
Chapter 3
. . . . . . .
. . . . . . . . . . .
. . . . . . . . . . .
. . . . . . . . . . .
. . . . . . . . . . .
. . . . . . . . . . .
. . . . . . . . . . .
. . . . . . . . . . .
. . . . . . . . . . .
. . . . . . . . . . .
. . . . . . . . . . .
. . . . . . . . . . .
. . . . . . . . . . .
. . . . . . . . . . .
. . . . . . . . . . .
. . . . . . . . . . .
. . . . . . . . . . .
. . . . . . . . . . .
. 39 . 41 . 41 . 43 . 46 . 48 . 48 . 49 . 50 . 51 . 54
Table Creation and Label Types . . . . . . . . . . . . . . . . . . . . . . 54 Object Settings . . . . . . . . . . . . . . . . . . . . . . . . . . . . . . 55 Exercise: Object and Label Styles . . . . . . . . . . . . . . . . . . . . . 57
Chapter 4
Designing Drawing Standards . . . . . . . . . . . . . . . . . . 61 Creating Templates . . . . . . . . . . . Drawing Settings . . . . . . . . . Layer Standards . . . . . . . . . . Object Styles . . . . . . . . . . . . Label Styles . . . . . . . . . . . . Plan Production Tools . . . . . . . . . . Enhancing Drawings with Visualization Exercise: Drawing Settings . . . . . . .
Chapter 5
. . . . . . . . . . . . . . . . . . . . . . . . Tools . . . . .
. . . . . . . .
. . . . . . . .
. . . . . . . .
. . . . . . . .
. . . . . . . .
. . . . . . . .
. . . . . . . .
. . . . . . . .
. . . . . . . .
. . . . . . . .
. . . . . . . .
. 61 . 63 . 64 . 65 . 65 . 66 . 66 . 67
Managing Project Data . . . . . . . . . . . . . . . . . . . . . . 69 The Collaborative Environment . . . . . Autodesk Vault . . . . . . . . . . . . . . Access to Autodesk Vault . . . . . . Autodesk Vault Set Up . . . . . . . Database Projects and Folders . User Accounts and Roles . . . External References (xrefs) . . . . . . . . Data Shortcuts . . . . . . . . . . . . . . . Exercise: Creating a Data Shortcut . . . .
Chapter 6
. . . . . . . .
. . . . . . . . .
. . . . . . . . .
. . . . . . . . .
. . . . . . . . .
. . . . . . . . .
. . . . . . . . .
. . . . . . . . .
. . . . . . . . .
. . . . . . . . .
. . . . . . . . .
. . . . . . . . .
. . . . . . . . .
. . . . . . . . .
. . . . . . . . .
. . . . . . . . .
. 69 . 69 . 71 . 71 . 71 . 72 . 74 . 75 . 77
Getting Started Exercises . . . . . . . . . . . . . . . . . . . . . 81 Points . . . . . . . . . . . . . . . . . . . . . . . . . . . . . . . . . . . 81 Surfaces . . . . . . . . . . . . . . . . . . . . . . . . . . . . . . . . . . 86 Grading . . . . . . . . . . . . . . . . . . . . . . . . . . . . . . . . . . 90 Parcels . . . . . . . . . . . . . . . . . . . . . . . . . . . . . . . . . . . 94 Alignments . . . . . . . . . . . . . . . . . . . . . . . . . . . . . . . . 99 Profiles . . . . . . . . . . . . . . . . . . . . . . . . . . . . . . . . . . 106 Sections . . . . . . . . . . . . . . . . . . . . . . . . . . . . . . . . . . 110 Pipe Networks . . . . . . . . . . . . . . . . . . . . . . . . . . . . . . 117 Corridors . . . . . . . . . . . . . . . . . . . . . . . . . . . . . . . . . 122 Survey . . . . . . . . . . . . . . . . . . . . . . . . . . . . . . . . . . 126 Object and Label Styles . . . . . . . . . . . . . . . . . . . . . . . . . 131 Visualization . . . . . . . . . . . . . . . . . . . . . . . . . . . . . . . 138 Label Objects . . . . . . . . . . . . . . . . . . . . . . . . . . . . . . . 143 Plan Production Tools . . . . . . . . . . . . . . . . . . . . . . . . . . 149
Glossary . . . . . . . . . . . . . . . . . . . . . . . . . . . . . 153
Contents | v
Index . . . . . . . . . . . . . . . . . . . . . . . . . . . . . . . 169
vi | Contents
Introduction
1
AutoCAD® Civil 3D® is a design and drafting program that supports a wide range of civil engineering tasks. The AutoCAD Civil 3D Getting Started guide introduces the program and provides some initial hands-on experience, using sample data included with the product. This first chapter contains brief descriptions of the significant features in AutoCAD Civil 3D and provides advice for AutoCAD Land Desktop users who are learning about AutoCAD Civil 3D.
Installation You install AutoCAD Civil 3D using the Installation wizard that opens automatically when you insert the product media. Using the Installation wizard you can access several pages of links, from which you can open online versions of the documentation and locate other information to support the product.
Installing on a Single Computer To install AutoCAD Civil 3D on a single computer, click the Install Products link on the first page of the Installation wizard. The Installation wizard provides links with answers to common installation questions. For information about installing AutoCAD Civil 3D on a single computer, consult the Stand-Alone Installation Guide. To access this guide, in the Installation wizard, click the Read the Documentation link, then click Stand-Alone Installation Guide.
1
Installing on a Network To deploy AutoCAD Civil 3D on a network, click the Create Deployments link on the Installation wizard. For information about deploying AutoCAD Civil 3D on a network, consult the Network Administrator's Guide. To access this guide, in the Installation wizard, click the Read the Documentation link, and then click Network Administrator’s Guide.
Highlights of AutoCAD Civil 3D AutoCAD Civil 3D® is designed for land-development professionals, such as civil engineers, surveyors, engineering technicians, and drafters. Subsequent chapters of this Getting Started guide introduce the objects and styles that are the main structural features of the application.
What’s New in AutoCAD Civil 3D 2009 This release of AutoCAD Civil 3D includes new features and enhancements to existing features, as described in the following sections. More details about these enhancements are available in the New Features topic of the Help and in the New Features Workshop.
Project Management You can access the Data Shortcut commands on the Toolspace Prospector tab. This feature now provides a Data Shortcuts external editor. Also, you can use the new project export feature, for packing a set of Vault project files into a ZIP archive, and a related project import feature, for extracting the files into another project environment.
Survey You can generate Mapcheck reports by selecting labels in the drawing. A new reporting tool highlights observation tolerance errors for angle, distance, elevation, and coordinate values in the Event Viewer vista. The Survey Link Extension enables you to download data from survey data collectors and
2 | Chapter 1 Introduction
convert raw data into .fbk files. Survey figure editing commands are now available.
Pipe Networks A new command enables you to select a series of pipes and structures in the drawing, and then rename or renumber them. You can use a spanning label for pipes displayed in a profile. You can use a pipe end cleanup option in profile views.
Labels You can now label most AutoCAD Civil 3D objects that are contained within an Xref. For line, curve, and spiral labels on alignment, parcels, and general line and curve labels, there are new label anchor points such as start, middle, and end. General line and curve labels can now be included in parcel tables.
Surfaces You can now reorder surface operations and can weed points to control the number of points that are used when creating a surface (TIN). This feature has been enhanced with more intelligent memory management, data restriction for improved performance, and point weeding to achieve a simplified surface which results in improved performance for large surfaces.
Grading You can have dynamic feature lines from alignments,profiles, and corridors. You can name feature lines for easier identification, and can apply styles to a selection set of feature lines. You can prioritize feature line styles to determine split point elevations and can create a feature line from the alignment geometry. Numerous new feature line commands make it easier to edit elevations.
What’s New in AutoCAD Civil 3D 2009 | 3
Alignments You can associate agency-specific standards during the alignment and profile design process to ensure compliance with standards. Additionally, you can use a new post-design error-checking mechanism, which checks the alignment and profile geometry for entities that violate the associated standards. You can now control label styles for different alignment and profile geometry points in order to label these in different ways. You can also label superelevation critical points along an alignment. You can create alignment entities using the best fit tools.
Profiles You can create stacked profile views and anchor superelevation band labels to superelevation diagrams. You can associate agency-specified standards during the alignment and profile creation process. Also, you can use the error-checking mechanism which checks for violations of the associated standards. You can create profile entities using the best fit tools.
Corridors You can use survey figures, grading feature lines, polylines, and pipe networks as subassembly targets in a corridor. The View/Edit functionality has been enhanced.
Mass Haul A new Mass Haul Diagram wizard is available to generate a mass haul diagram that remains dynamic in relation to the corridor model.
Google Earth You can publish render materials on entities for display in Google Earth. Also, you can import elevation data in a current Google Earth view into AutoCAD Civil 3D as a mesh.
4 | Chapter 1 Introduction
Hydraulics and Hydrology Optionally, you can install three new hydraulics and hydrology applications from the AutoCAD Civil 3D installer. Use the stand-alone applications, Hydraflow Storm Sewers Extension and Hydraflow Hydrographs Extension, for hydraulic analysis and planning. Use the Hydraflow Express Extension application to perform common hydrology tasks, such as designing culverts and inlets. For more information, click the Help menu in each of these applications.
Sample Data Provided with the Program To help you learn how to use AutoCAD Civil 3D and start experimenting with its features, the product media includes sample drawings and data files.
Tutorial Drawing Files Use these files with the tutorials that are part of the AutoCAD Civil 3D Help system. After installation, the default location of the files is the following folder: C:\Program Files\AutoCAD Civil 3D 2009\Help\Civil 3D Tutorials\Drawings
Getting Started Guide Drawing Files Use these drawing files with the Exercises chapter of this Getting Started guide. There is one file for each feature-specific concept discussed in that chapter. After installation, the default location of the files is the following folder: C:\Program Files\AutoCAD Civil 3D 2009\Getting Started Guide
Best Practices Guide Drawing Files Use these files with the Best Practices guide. After installation, the default location of the files is the following folder:
Sample Data Provided with the Program | 5
C:\Program Files\AutoCAD Civil 3D 2009\Best Practices Guide
Sample Drawing Templates AutoCAD Civil 3D also provides several drawing templates that contain sample content for settings, styles, and organization of objects. Use these files as a basis for developing your own content. After installation, the files are located in the same folder as the AutoCAD templates. To create a file from a template: 1 Click File menu ➤ New. 2 In the Select Template dialog box, select the template you want to use. The AutoCAD Civil 3D templates are at the top of the list, with names such as _AutoCAD Civil 3D (Imperial) NCS Base.dwt.
Learning How to Use AutoCAD Civil 3D AutoCAD Civil 3D provides learning materials to get you started using the software and complete documentation to serve as a reference. User documentation for AutoCAD Civil 3D includes: ■
Getting Started guide (this guide)
■
Online tutorials
■
Help system
■
Best Practices guide
■
Moving From Land Desktop to Civil 3D guide
■
Skill Builders
Getting Started Guide The Getting Started guide introduces important concepts in AutoCAD Civil 3D. After reading through it, and doing some of the exercises with the sample files provided, you should feel comfortable enough with the application to start experimenting on your own.
6 | Chapter 1 Introduction
Online Tutorials Access the online tutorials on the AutoCAD Civil 3D Help menu. The tutorials offer an in-depth guided tour of the major features of AutoCAD Civil 3D, using realistic engineering drawings and data. For a thorough knowledge of AutoCAD Civil 3D, it is recommended that you explore the tutorials after you have read through the conceptual information provided in the Getting Started guide.
Help System The AutoCAD Civil 3D Help system is provided in HTML format with a table of contents, an index, and a search function. You can print out the Help topics that interest you. To print entire sections, you might prefer to work from the PDF version of the Help system. By default, this document is available at the following location: C:\Program Files\AutoCAD Civil 3D 2009\Help\civil_ug.pdf Use the Search tab in the Help to find topics that contain a particular word or phrase. For the best results when searching for a phrase, enclose the words in quotation marks, for example, “Quantity Takeoff.” Search results appear in the left pane. The Help system home page lists topics by classifying them by task, by feature, and by job role. The home page also includes links to the Learning Resources page, the Workflow topics, the New Features Workshop, Tutorials, the Best Practices guide, and the Moving from Land Desktop to Civil 3D guide.
Civil 3D Best Practices Guide The new AutoCAD Civil 3D Best Practices guide provides best practices information to help you optimize your use of AutoCAD Civil 3D. This guide includes chapters for aspects of AutoCAD Civil 3D such as project management, templates and style optimization, and specific features including surfaces, grading, pipe networks, and corridors.
Moving from Land Desktop to Civil 3D Guide Many Land Desktop users are transitioning to Civil 3D. The Moving from Land Desktop to Civil 3D guide provides concepts, best practices, and procedures for
Online Tutorials | 7
successfully moving from Land Desktop to Civil 3D. This guide is available on the Help menu. It contains information on how to successfully plan for and transition an organization from using Land Desktop to using Civil 3D. This guide also contains information on tools for moving Land Desktop data into Civil 3D.
Skill Builders AutoCAD Civil 3D Skill Builders are advanced exercises that enable you to practice performing design tasks using Civil 3D drawings. Skill Builders are available from the AutoCAD Civil 3D website. To view and download AutoCAD Civil 3D Skill Builders, visit http://www.autodesk.com/civil3d-skillbuilders.
Autodesk Training Programs and Products Training programs and products from Autodesk help you learn the key technical features of your Autodesk software and improve your productivity. For the latest information about Autodesk training, visit http://www.autodesk.com/training or contact your local Autodesk office.
Autodesk Authorized Training Centers Be more productive with Autodesk software. Get trained at an Autodesk Authorized Training Center (ATC) with hands-on, instructor-led classes to help you get the most from your Autodesk products. Enhance your productivity with proven training from over 1,400 ATC sites in more than 75 countries. For more information about Autodesk Authorized Training Centers, contact
[email protected] or visit the online ATC locator at http://www.autodesk.com/atc.
Autodesk Courseware Autodesk publishes many courseware titles each year for users at all levels to improve their productivity with Autodesk software. The preferred training materials of Autodesk partners, these books are also well-suited for self-paced, standalone learning. All courseware simulates real-world projects with hands-on, job-related exercises. Autodesk Official Training Courseware (AOTC) is developed by Autodesk. Autodesk Authorized Training Courseware (AATC) is developed by Autodesk partners, including titles in a growing number of
8 | Chapter 1 Introduction
languages. Autodesk Official Certification Courseware (AOCC) teaches the knowledge and skills assessed on the Certification examinations. Visit http://www.autodesk.com/aotc to browse the Autodesk Courseware catalog.
Autodesk Certification Gain a competitive edge with your career by obtaining Autodesk Certification, validating your knowledge and skills on Autodesk products. Autodesk provides an end-to-end solution for assessing your readiness for certification, preparing for certification, and obtaining certification. For more information on Autodesk Certification, visit http://www.autodesk.com/certification.
e-Learning Autodesk e-Learning for Autodesk Subscription customers features interactive lessons organized into product catalogs. Each lesson is 20-40 minutes in length and features hands-on exercises, with an option to use a simulation or the software application. You can also use an online evaluation tool that identifies gaps in skills, determines what lessons will be most helpful, and gauges learning progress. If you are a member of Autodesk subscription, you can access e-Learning and other subscription services from within your Autodesk product. For more information about Autodesk subscription resources, visit http://www.autodesk.com/subscription.
Autodesk Training Programs and Products | 9
10
Designing with Objects
2
The underlying object model in AutoCAD Civil 3D creates some major efficiencies in the engineering design process. Because of this model, changes to one object can affect related objects, and object styles can control many aspects of object appearance and behavior. This chapter describes both the object model and the AutoCAD Civil 3D user interface for working with objects.
Object Model The architecture of AutoCAD Civil 3D ensures that each object, such as an alignment or a parcel, has a standard set of attributes and relationships to other objects. These objects are “intelligent” in the sense that they automatically react in predictable ways to changes in related objects. As a result, you do not need to spend hours ensuring that design revisions are transferred correctly among surfaces, alignments, profiles, sections, labels, tables, and other objects. The tedious tasks of redrafting and relabeling are eliminated. Design options and “what if” scenarios can be created more easily and analyzed with precision, resulting in significant process improvements.
11
Grading
Alignments
Parcels
Surfaces
Points
Exploded representation of the object model
12 | Chapter 2 Designing with Objects
Object Relationships The following illustration shows a simplified view of object relationships and data flow in an AutoCAD Civil 3D drawing:
Object relationships and data flow
Object Relationships | 13
Field survey data creates figures and points that can be used to generate an existing ground surface and parcels. This surface is referenced as other objects are created in the design process, resulting finally in a designed surface. Parcels, existing ground surfaces, pipe networks, and gradings can be created independently, or from data sources not shown in the illustration. Such objects are usually linked to other objects during the design process, if not at the beginning. The object type with the most complex set of relationships is the corridor, because it requires data from an alignment, profile, and assembly. Changes to any object automatically flow along the arrows to dependent objects, with predictable results. For example, if you correct the elevations of an existing ground surface, updates flow to any related grading objects, corridors, profiles, and pipe networks. As a result, all values represented in labels and tables are also updated. In the design process, after you create an alignment you can create many profiles and sections. However, the display of these in profile views and section views is optional and separate from the flow of data required to create the final product—a designed surface. Similarly, the data from objects, such as parcels and alignments, can be output to a table or report if desired.
14 | Chapter 2 Designing with Objects
Object Interface The user interface of AutoCAD Civil 3D reflects the object architecture of the application. The major elements are shown in the following illustration:
AutoCAD Civil 3D User Interface
The following notes describe the numbered items in the illustration: 1 Toolspace. For object management. Uses four tabs: Prospector; for navigating through the object collections, Settings; for managing styles and settings, Survey; for managing survey data, and Toolbox; for generating object reports. 2 Item view. For a list view of the contents of the selected folder or a graphic view of the selected object. 3 Layout tools. For creating and editing objects, such as gradings or alignments. 4 Standardized menus. For consistent access to the full range of commands.
Object Interface | 15
5 Tabbed property editors. For modifying individual objects and their attributes. Each part of the user interface is described in more detail in the following sections.
Toolspace for Object Management The Toolspace window provides an object-oriented view of your engineering projects. The window is divided into four parts or tabs: Prospector tab, Settings tab, Survey tab, and Toolbox tab.
Prospector Tab On this tab, all of the objects in a drawing or project are arranged in a hierarchy that you navigate in standard, Windows Explorer–like fashion. To access this tab, click General menu ➤ Toolspace. To view all the collections in the Prospector tree, select Master View from the list at the top of the Prospector tab. The collections available here are Open Drawings, Projects, Data Shortcuts, and Drawing Templates. Note that Projects lists projects available after you have logged into an Autodesk Vault server and Vault database. A site collection includes objects that are related to one another because they share topology. The following illustration shows a typical structure. The Oak Street site folder contains collections for alignments, grading groups, and parcels that belong to the site. The Parcels folder contains the parcel objects defined for the Oak Street subdivision. Note that the view selected is Active Drawing.
16 | Chapter 2 Designing with Objects
The Prospector tab in Toolspace
Toolspace for Object Management | 17
Settings Tab On this tab, styles are organized for different object types. Even in a blank drawing, most of these styles are present in a standard hierarchy. You can create and modify styles in a drawing, then save it as a template. Subsequent drawings based on the template will automatically have the same set of styles available. You can modify object, label, and table styles. You can also control settings for drawings and commands. To access this tab, click General menu ➤ Toolspace. In the following illustration, label and table styles for parcels have been defined:
Each type of object can have an unlimited number of styles.
Predefined label styles can be applied to any parcel in the drawing.
The Settings tab in Toolspace
18 | Chapter 2 Designing with Objects
Survey Tab To access this tab, click Survey menu ➤ Open Survey Toolspace. This tab displays survey project data, organized within databases for survey projects, equipment, and figure prefixes. The project databases record the survey points, networks, and figures. The equipment databases record standard deviations and other operational parameters of individual pieces of survey equipment. The figure prefix databases record the conversion routines that are applied when creating lots, buildings, or other figures from survey points.
The Survey tab in Toolspace
The contents of the Survey tab are not specific to a drawing. This tab reflects the survey data in your AutoCAD Civil 3D Projects folder, so it facilitates access to survey data from multiple drawings. The surveyed points and figures in a project can be converted to Civil 3D points and parcels.
Toolspace for Object Management | 19
Toolbox Tab To access this tab, click General menu ➤ Toolbox. This tab organizes reports for each object type. The reports provide useful engineering data from a drawing in a compact, portable format. AutoCAD Civil 3D includes many standard reports. Some are in LandXML format, with predefined or custom XSL style sheets. Other reports are .NET format, with custom dialog boxes that allow you to select the data and various options.
The Toolbox tab in Toolspace
You can add your own reports to the Toolbox menu. These reports can be in a variety of formats, including XML, VBA, COM, or .NET.
20 | Chapter 2 Designing with Objects
Menu Standardization The menus in AutoCAD Civil 3D are designed to be as consistent as possible for all objects, making it easy to find the command you are looking for. This standardization reflects the fact that the workflows for creating, editing, and annotating various objects are quite similar. The object creation commands are at the top of the menu structure, because logically they are the first steps in any workflow. They are followed by the editing commands, and then, the annotation commands. Note that all feature menus provide access to the labeling and table creation commands.
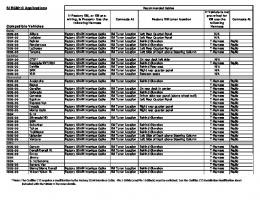
Comparison of the Pipes, Parcels, and Alignments menus
In this release of AutoCAD Civil 3D, the Grading feature line editing commands are also available on the Parcel and Survey menus. Use these commands to edit parcel geometry as well as parcel elevations. You can also use the feature line commands to edit survey figures, including control points.
Menu Standardization | 21
Comparison of the Parcels and Survey menus
AutoCAD Civil 3D comes with several workspaces that you can use as-is or change according to your preferences. Workspaces are sets of menus and toolbars grouped together to enable you to customize workspace settings. AutoCAD Civil 3D workspaces include Civil 3D Complete, Design, Annotation and Drafting, Survey and Topographical, and Visualization and Rendering. For more information about using workspaces, see the Help system. The Annotation menu in the Annotation and Drafting workspace is designed to facilitate the creation of annotation labels and tables. The Annotation menu provides access to all label and table commands. The feature menus, such as the Pipes, Parcels, and Alignment menus, also include options for the creation of labels. To modify label styles and settings, use the Add Labels command to access the Add Labels dialog box. This command is located on both the feature (Civil 3D Complete workspace) and Annotation (Annotation and Drafting workspace) menus. For a quicker method to add labels when your styles are already set up, you can use the direct creation method for specific label types. For example: Parcels menu ➤ Add Parcel Labels ➤ Single Segment. To access the Add Labels dialog box to edit or create features label styles, use Parcels menu ➤ Add Parcel Labels ➤ Add Parcel Labels. See the Help system for instructions on creating labels for features and objects.
22 | Chapter 2 Designing with Objects
Annotation Label and Table menus
Menu Standardization | 23
Shortcut Menus AutoCAD Civil 3D uses shortcut menus extensively. These menus are displayed when you right-click either one or more objects in the drawing, or an individual item in Toolspace. You use shortcut menus for quick access to common functions and commands. Here are two examples from the Prospector tab. The menu on the left is displayed when you right-click an alignment object on the Prospector tab. The menu on the right is displayed when you right-click a parcel.
Shortcut menus for an alignment and a parcel on the Prospector tab
The options on the shortcut menus on the Settings tab are also very similar for different object types.
24 | Chapter 2 Designing with Objects
Layout Tools AutoCAD Civil 3D provides separate dialog boxes, called Layout or Creation Tools, for designing surfaces, alignments, grading, and other features. Each layout tools dialog box provides access to object-specific design and editing commands in a floating dialog box.
Layout tools for Grading, Alignments, and Pipe Networks
Consistent Editing Methods Object editing in AutoCAD Civil 3D uses an approach that is quite consistent for all objects. The main editing tools are described in the following sections.
Item View When you click an object or an object collection on the Prospector tab, for example, Points or Alignments, an item view appears. An item view can be either a list view or a graphical view, depending on the object selected.
Layout Tools | 25
The item view presents a table in which you can review and edit data for each object in the selected collection. For example, if you select a point group, the item view table includes a row for each point in the group.
Click a table cell to edit the value.
Item view showing a group of points
Grips When you select an object in the drawing, grips appear on the object. You can use these grips to click and drag the object to a new location. For example, when editing alignments, you can use grips to move points of intersection or points of line-arc tangency.
Direction of drag
Editing an alignment by dragging the grip at the midpoint of a curve
26 | Chapter 2 Designing with Objects
When you use a grip to drag a label object to a new location, a round reset grip appears. You can click this round grip to return the label to its original location. No matter how many times you have moved the label, the reset grip will restore it to its original location.
Use the round grip to reset label location
Panorama Window Some object types, such as alignments and profiles, use the Panorama window to display a table of entities that make up that object. The Panorama window is a floating, dockable window that you can keep open as you work. It can include several tables, called vistas, on different tabs. Panorama data shown in black text can be edited; data shown in gray text cannot be edited.
Consistent Editing Methods | 27
Panorama window showing an alignment
Property Editors When you right-click any object on the Prospector tab, and then click Properties, you can view all the AutoCAD Civil 3D properties of that object, and edit some of them. These properties typically include the styles, labels, related objects, and some structural details of the current object.
28 | Chapter 2 Designing with Objects
Properties editor showing properties for a surface (above) and a point group (below)
AutoCAD Properties Editor When you right-click an object in the drawing, and then click Properties, the AutoCAD Properties dialog box is displayed. You can use this dialog box to review and edit AutoCAD properties, such as the layer on which the object is drawn. You can view the style assigned to the object, and can also change it here. You can also edit an object style on the Settings tab of Toolspace. Right-click the object style. Click Edit to open the Style dialog box.
Consistent Editing Methods | 29
Click a table cell to edit the value.
Editing AutoCAD properties for an alignment
30 | Chapter 2 Designing with Objects
Exercise: Familiarization Tour In this exercise, you will explore the Toolspace and Workspace settings. Using an alignment as an example, you will explore objects and styles located on the Toolspace Prospector and Settings tabs. You will also examine the workspace menus. To view Toolspace tabs in AutoCAD Civil 3D 1
Open the file C:\Program Files\Autodesk Civil 3D 2009 \Getting Started Guide\GSG_alignments.dwg. To access the Toolspace, click General menu and click Toolspace. In Toolspace, on the Settings tab, expand the Alignment collection. Note the Alignment Styles, Design Checks, Label Styles, Table Styles, and Commands collections.
2
Right-click the drawing GSG_alignments.dwg. The context menu provides access to dialog boxes where you can edit drawing settings, label style defaults, LandXML settings, and table tag numbers.
Exercise: Familiarization Tour | 31
3
In Toolspace, on the Prospector tab, expand the Sites collection and expand Conway Farms and its Alignments. Right-click East-West Drive. The context menu enables you to open dialog boxes to view and change properties such as Object Style and reference points. Make changes as desired and click OK. Now expand the Parcels collection and observe how parcel data is displayed by opening the Properties dialog box. You can also edit object styles, create mapcheck or inverse reports, or edit properties that you can define such as parcel address.
4
Now you will explore the workspace settings. You can customize the workspace menus to suit your particular tasks or preferences. In the lower right of the Civil 3D interface, click the Workspace Switching icon and select Annotation and Drafting and observe how the menus are reorganized.
5
Select the Annotation menu. Note the commands for adding labels and tables. This menu facilitates the labeling process during the drafting stage of your project. Experiment with the workspace settings and customize them for your design needs. Click again to open the Workspace Settings dialog box. Use this
32 | Chapter 2 Designing with Objects
dialog box to customize the order and display of the settings.
Standard Controls for Styles and Labels Every AutoCAD Civil 3D object has a style assigned to it. These styles are created, assigned, and managed in a consistent way for all objects. All objects have an object style and can have one or more label styles. Some objects have table styles as well. You can browse the collections of styles in a drawing, on the Settings tab of the Toolspace window, as shown in the following illustration:
Style collection folders on the Settings tab of the Toolspace window
To create a new style or to edit an existing style, right-click the style on the Settings tab, and then click Edit. The Style dialog box for labels is called the Label Style Composer. It contains a preview window that makes it easy to adjust label location and appearance.
Standard Controls for Styles and Labels | 33
Label Style Composer dialog box showing a point label style
There are many ways to open the Label Style Composer: ■
Right-click an existing style and click Edit.
■
Right-click an existing style and click New.
■
Right-click a label style type and click New.
■
You can also access the Label Style Composer from the Label Style Control, which is available in many dialog boxes.
You can also access the Label Style Composer while working directly in your drawing. To quickly access the composer while in the drawing, select a label. Then right-click and select either Properties or Label Properties. In the AutoCAD Properties palette, click the label style to display a list of available styles. For more information about styles and labels, see the chapter Using Styles and Settings (page 39) in this guide.
34 | Chapter 2 Designing with Objects
Precision Layout Strategies When creating objects, such as horizontal alignments, parcels, and profiles, you may need to use several different methods. Sometimes you want to draw quick freehand versions, other times you have specific distances and angles to enter. AutoCAD Civil 3D supports both methods of working. The main layout tools have settings that you can use to control some design elements while you draw each object. For example, when drawing alignments or profiles, you can create a series of linked tangents and add curves later, or you can have curves of standard dimensions inserted at each tangent intersection as you draw. Similarly, you can specify a default area for each parcel and a minimum frontage distance. You can also use the transparent commands to specify precise point locations while you are laying out an object. From a current point in an alignment or parcel, you can specify the next point using standard surveying methods, such as angle and distance, northing and easting, latitude and longitude, or point number. As shown in the following figure, for a profile, you can specify a point by various methods, such as station and elevation or grade and distance. In each case, you use the command by entering a short code on the command line (for example, ‘bd for bearing and distance) or by clicking an icon on the Transparent Commands toolbar.
Distance transparent command in progress on a profile view
Object Building Blocks Corridors and pipe networks share a similar complex structure, in that both objects are built up from standard components. These components exist in a catalog, and you can modify them to create additional components.
Precision Layout Strategies | 35
Corridors A corridor is created from one or more assemblies, which are standard roadway cross-sections. You design an assembly from subassemblies, such as lanes, curbs, shoulders, and ditches. The subassemblies are provided in a set of catalogs, which you can review by clicking General menu ➤ Catalog or General menu ➤ Tool Palette Window.
Roadway assembly (left), with subassemblies shown in a tool palette (right)
Each subassembly has a defined cross-section, and some subassemblies automatically adapt to their location. For example, the slope of a road lane changes as superelevation is applied, and a side slope automatically creates either a cut or fill slope, depending on the relative elevation of the existing surface. The dimensions of a subassembly, such as the width of a lane or the height of a curb are stored as properties. If you want to create a new subassembly based on an existing one, use this simple procedure: 1 Right-click a subassembly in the Tool Palette, copy it, and paste it. 2 Right-click the subassembly that you copied and click Properties. 3 Rename the subassembly and modify the numeric parameters. You can also create custom subassemblies from AutoCAD polylines. In this case, you must also specify the subassembly behavior within an assembly and in the process of corridor creation. You can define custom subassemblies and their behavior using Visual Basic for Applications (VBA) scripts, then use the AutoCAD Civil 3D COM application programming interface (API) to link these to the main application.
36 | Chapter 2 Designing with Objects
A subassembly definition references point, link, and shape codes. Points are the vertices of the subassembly, and they can be attachment points for adjacent assemblies. Links are the line segments or curves between the points. Shapes are two-dimensional polygons that represent the cross-sectional shape of the subassembly. The following figure shows a coding diagram for a Basic Curb and Gutter subassembly:
Pipe Networks A pipe network is constructed from various pipes and structures that appear in a parts list. You can see the available lists on the Toolspace Settings tab by expanding the Pipe Network ➤ Parts Lists collection. AutoCAD Civil 3D includes a utility called Part Builder, which you can use to edit the dimensions of parts and create new ones. You can create a new part by saving an existing one with a new name, and then modifying its dimensions in various tables.
Detail from a Part Builder edit window for a concentric cylindrical structure.
Pipe Networks | 37
38 | Chapter 2 Designing with Objects
Using Styles and Settings
3
Styles determine the display format and some aspects of the behavior of objects and their labels. This chapter explains how you can use various settings and the versatile set of styles in AutoCAD Civil 3D to establish CAD standards and promote efficiency at every stage of the design process.
Managing Styles You can use styles to control object appearance and behavior, with flexibility and ease, and to establish design standards. If you are the CAD manager in your organization, you may find that time spent creating styles for others to use pays off in terms of efficiency and standards compliance. AutoCAD Civil 3D is an object-oriented program that works with intelligent objects. The objects reference a style, which can be changed at any time. Any style can be copied by dragging it from one drawing to another. The new drawing knows where to put that style in the Settings tree. You can then apply the new style to existing objects. Any label style can be copied by creating a child style. A child style derives its default settings from its parent, the existing style. To create a child style for a label, on the Toolspace Settings tab, right-click a label style. Click New. In the Label Style Composer dialog box, make changes to the settings as desired and click OK. The child style will appear underneath the parent style in the Settings tree. See the Labels and Settings (page 57) exercise at the end of this chapter. You can use styles to manage the display of objects at different phases of a project. In the following illustration, the upper drawing uses surface and parcel styles appropriate for a preliminary layout, while the lower drawing uses different styles for the final presentation:
39
Early layout phase
Final drawing phase
Using customized surface and alignment styles for different phases of a project
40 | Chapter 3 Using Styles and Settings
Types of Styles AutoCAD Civil 3D includes styles for objects, their labels, data tables, and the bands that annotate profile views and section views. Each of these styles is described in the following sections.
Object Styles Each object type includes a Basic style. Use this style as it is, or as a basis for building custom styles. You can create styles to meet the needs of a particular project, a group of users, or any other design requirement. Groups of styles can be collected into a template (.dwt) file, so that all drawings based on that template share the same style configuration. All object types have similar style controls, and a similar set of style collections on the Toolspace Settings tab. You access the style editing dialog boxes by right-clicking one of the styles and then clicking Edit. The following illustration shows some common style editing tasks for points, surfaces, and alignments:
Types of Styles | 41
1 Point style: using a custom marker 2 Surface style: smoothing contours 3 Alignment style: changing the color of the line components
1
2
3
Editing the style for three different types of objects
42 | Chapter 3 Using Styles and Settings
In addition to feature-specific styles, AutoCAD Civil 3D includes multipurpose styles that apply to several objects. Most of these styles apply to grading objects and corridor assemblies, and control the appearance of components, such as markers, feature lines, and slope patterns.
Label Styles Labels are associated with many objects, and their content is updated whenever the object itself is changed. Labels are also controlled by styles. You can modify the label styles in the same way that you modify the object styles: right-click a style name on the Toolspace Settings tab, and then click Edit. You can create and save label sets for alignments, profiles, and sections, which allows you to apply multiple label types in one operation. For example, an alignment label set could include labels for major stations, minor stations, and geometry points. Labels can include text, blocks, lines, ticks, and leaders. You can easily create labels and preview their appearance in the Label Style Composer dialog box, as shown in the following illustration:
Label Styles | 43
Alignment station labels and parcel area labels appear in the drawing as they appear in the preview of the Style Composer.
Previewing customized label styles for alignment stations and parcel area
44 | Chapter 3 Using Styles and Settings
Table styles can also be customized.
When composing a label style, you work with the following types of attributes: ■
Location. Controls the location of the label in relation to the object.
■
Text. Specifies which object data is displayed, and sets the size, color, and font for the text.
■
Appearance and Visibility. Defines the bounding box, color, lineweight, linetype, and other aspects of label appearance, and sets the visibility of any of the label components.
■
Dragged State. Determines how a label changes if it is dragged away from the default location to a place where it is more readable. For example, you can specify the addition of a leader line with arrow.
■
Plan Readability. Automatically rotates any upside-down label text so it is readable in plan view. Otherwise, if labels are oriented in relation to an object, they might be displayed upside-down.
■
Orientation. Sets the rotation angle of the labels in relation to the object you are labeling, the current view, or the world coordinate system (WCS).
Setting the label style defaults provides an efficient way to standardize some key aspects of label appearance and behavior for all objects in the drawing. To review and edit these defaults, right-click the drawing name on the Toolspace Settings tab and click Edit Label Style Defaults. All label text is controlled by the Text Component Editor. To access the Text Component Editor, in the Label Style Composer dialog box, click the Layout tab. Select a component from the Component Name list, or create a new text component. Under Text, click the Value column for Contents, and then click . You can use this editor to simultaneously edit the text for an entire group of labels.
Label Styles | 45
Use the Properties list at the top of the dialog box to specify which object property to include in the label. For example, a parcel area label can include properties such as the parcel area, perimeter, number, and street address. Each property component can include character strings and data codes, as shown on the screen on the right. After you select a property to include, use the table on the left to specify the format of text inside the double brackets (). When you finish modifying the values, click the right arrow at the top of the dialog box to send the updated component to the screen on the right. Use the screen on the right to modify the standard text strings outside the brackets and to cut and paste entire components.
Managing Label Styles Use the AutoCAD Properties palette to manage most labels. The palette displays the Standard AutoCAD properties and also the label properties such as Label Style and whether the label is visible, flipped, or pinned. You can simultaneously edit an entire group of labels. For example, you can create additional label text for inclusion on all labels by performing a single action. Some types of labels, such as station labels, are group type labels. To edit a group of labels, right-click a label, which highlights the group, and click either Label Properties or Properties to access the AutoCAD Properties palette. Also, you can select and edit a single label. To edit a single label within a label group, use Ctrl+left-click to select a label. Right-click the label and click either Label Properties or Properties to access the Properties palette. To select more than one label (subentity) within a group of labels, continue to press Ctrl and click additional labels.
46 | Chapter 3 Using Styles and Settings
You can use the Style Selection menu in the Properties palette to bulk-edit label properties. This is a convenient method of editing labels without having to navigate to the Toolspace Settings tab. You can quickly create, edit, or copy styles while working directly within the drawing.
Select the Edit/Create option to open the Select Style dialog box where you can create a new style, copy the currently selected style, create a child style, or edit the currently selected style using the Label Style Composer. You can now directly edit or change a label style using the Edit Label Style option. In the drawing, select the label to edit. Right-click and select Edit Label Style. You can also edit an existing label style in Toolspace. In Toolspace, on the Settings tab, right-click the label style you want to edit and click Edit. Use the
Label Styles | 47
Label Style Composer to edit the label. In the Label Style Composer, click to access the Text Component Editor.
Table Styles AutoCAD Civil 3D provides automated data tables for points, surfaces, parcels, alignments, and quantity takeoff. As shown in the following illustration, these tables provide a concise display of object data as an alternative to using object labels. The table styles control the data properties and the displayed components of the table. Data properties include the data format, order of columns, text style, and whether the table title and column headers are repeated if the table is split. Display components include the borders, separators, fill, and text. You can control the visibility, color, linetype, and scale of each component.
Example data table for the Ridge Road alignment
Table Tags Use the Table Tag Numbering dialog box to set the default starting number and increment options for table tags. To access the Table Tag Numbering dialog box, navigate to the Toolspace Prospector tab. Then, right-click the drawing name, and select Table Tag Numbering. You can also access this dialog
48 | Chapter 3 Using Styles and Settings
box from the Add Labels dialog box. You can use General line and curve labels alone or with parcel segment labels to create a table. The table tag settings for segment labels are no longer controlled by the site and can be found in the drawing settings, DWG node and is drawing-wide. By default when creating table tags, the settings control the starting number, and increment number.
Use this dialog box to set your table tags automatically
Note that duplicate tags are not created unless you manually create them with the EditParcelTagNumbers command. When table tags are created, it prevents the creation of duplicate tag number within the drawing. When renumbering table tags, you can create duplicates by changing the starting number or increment in the settings (table tag renumbering section of the dialog). Table tags support the following tag mode labels: general line, general curve, parcel line, parcel curve, alignment line, alignment curve, and alignment spiral.
Band Styles Profiles and sections are displayed in a graph format. These profile views and section views can be annotated with data bands along the top and bottom of the grid. Each band marks significant points along the length of the profile
Band Styles | 49
or section. For example, in a profile view, you can have separate bands for vertical geometry, horizontal geometry, superelevation data, and pipe networks. The following illustration shows part of a profile data band above a horizontal geometry band. In the profile data band, at each major station you see the elevations of the existing ground and finished grade profiles. The horizontal geometry band shows the location of a curve and some engineering data about the curve.
Part of two profile view data bands
Separate band styles exist for each band type. In each style definition, you can specify what data to display and details of the band format, such as the height and position of the band (above or below the grid), and the color of components, such as borders and labels. If you want a standard set of bands for use with profile or section views, you can define these as a band set and apply them as needed.
Profile and Section View Styles You modify the appearance of a profile view the same way you modify the appearance of other objects, by changing its style. The profile view style controls the format of the graph on which the profiles are displayed, as well as the title and annotations on the axes. Customizing profile view styles is a good example of how styles can be modified for different stages of your project. In the design phase, you may use one profile style that has few grid elements and limited annotation. By limiting annotation and grid elements you reduce drawing size and improve drawing performance. During the plotting stage of the design, a second style may be used that includes extensive annotation and uses more graph elements
50 | Chapter 3 Using Styles and Settings
than the design style. For more information about profile and section view styles, see the AutoCAD Civil 3D Help.
Using Styles with Layers Most objects in AutoCAD Civil 3D have several components. For example, a surface includes contours, triangles, and points. You can control how these components are displayed either by using layers or by setting the display properties directly in the object style. You use the Layer Properties Manager dialog box or the object styles dialog boxes respectively to do this. The Display tab of the object styles dialog boxes provides a number of settings that are similar to those in the Layer Properties Manager dialog box, such as visibility, color, linetype, and lineweight. This duplication means that you can control object appearance using only styles, only layers, or a combination of the two. Display properties defined in the object styles dialog boxes override the settings defined for the drawing layers in the Layer Properties Manager dialog box. For example, you can use two different styles to distinguish the display of existing ground and finished grade surfaces, even if they are drawn on the same layer. The following illustration shows how you can use both style settings and traditional layers to control the display characteristics of an object. The style shown in the upper drawing directly modifies the color and visibility of the
Using Styles with Layers | 51
surface components, so that the surface points are turned on and colored red, even though the layer on which the points are drawn (0) is turned off and colored white in the Layer Properties Manager dialog box. The style shown in the lower drawing assigns the surface components to layers already defined in the drawing. In this case, the color of the major and minor contours is set by the C-TOPO-MAJR and C-TOPO-MINR layers.
52 | Chapter 3 Using Styles and Settings
Visibility and color of the surface components are controlled by settings on the Display tab of the Surface Style dialog box.
Visibility and color of the surface components are controlled by the layer assignment.
Managing object appearance using style settings (above) and layers (below)
Using Styles with Layers | 53
Label Objects Most labels are implemented as independent label objects and are not highlighted when the parent object is selected. Label object properties are separate from the parent object. You can use the LIST command to display the label properties. Label objects can include references to other AutoCAD Civil 3D objects by including Referenced Text components. The layer behavior of label objects is different. For example, their new default layers are specified in the Drawing Settings and can be changed using the AutoCAD Properties palette (rather than modifying the label style with the Label Properties dialog box). You can control the behavior of labels in one of two ways, by referencing either the layer in the style or the layer that the label resides on. In previous releases of AutoCAD Civil 3D, all group type labels were subentities of the parent object. If the parent object was frozen, the labels would disappear with the frozen parent object. Independent object labels are no longer subentities of the parent object. However, if you desire to control the object layer in conjunction with a parent object, you can set the layer that the label resides on to 0, which will make it behave as if it were a subentity of the parent object. In this case, with the layer set to 0, if the layer of the parent object is frozen, the label will also be frozen (and will no longer be visible).
Table Creation and Label Types In this release of AutoCAD Civil 3D, when creating parcel tables, you can select general line and curve label types and parcel segment labels, including any line or curve labels, that are applied to a line, curve, feature line, or polyline. You can create an alignment segment label that references a general line or curve style for inclusion in a table. General line and curve label styles now have a Tag Mode that supports general line and curve labels, parcel segment labels that reference a general line or curve style, and alignment segment labels that reference a general line or curve style. The Add Table commands (Add Line, Add Curve, and Add Segment) are available on the Lines/Curves menu, the Grading menu (for feature lines), and the Survey Menu (for figures and survey figures). The Renumber Tags command is also available on these menus.
54 | Chapter 3 Using Styles and Settings
Object Settings Settings in AutoCAD Civil 3D provide many preset values, ranging from values, such as drawing units, scale, and coordinate system, to optional defaults, such as the layers that the different objects are created on, and the use of tooltips. You can access the setting dialog box by right-clicking the appropriate collection on the Toolspace Settings tab, and then clicking Edit Feature Settings. You can work with three levels of settings: ■
Drawing settings establish values for the whole drawing. If you are creating a drawing template, ensure that these are set correctly.
■
Feature settings control behavior for a particular feature, such as Parcels or Grading.
■
Command settings apply to individual commands within a feature, such as the CreateParcelByLayout command within the Parcels feature.
Each lower level object in the settings hierarchy can either inherit or override settings in the level above it. The following illustration shows an override set for area units at the Parcels feature level. The arrow in the Child Override column of the Drawing Settings dialog box (upper drawing) indicates that an override has been set at a lower level. The check mark in the Override column in the Parcel Settings dialog box (lower drawing) indicates that the value set in this dialog box overrides the setting at a higher level. At the drawing level you can cancel an override by clicking it. You can prevent overrides by locking a setting.
Object Settings | 55
Area units for parcel objects are acres, overriding the drawing setting. For other objects, area units remain set to square meters.
How feature settings can override drawing settings
56 | Chapter 3 Using Styles and Settings
Exercise: Object and Label Styles In this exercise, you create and modify a child label style. Using parcel labels as an example, you will learn how to create a child style and observe how changes to parent styles affect the child styles. To create and change label styles in AutoCAD Civil 3D 1
Open the file C:\Program Files\Autodesk Civil 3D 2009\Getting Started Guide\GSG_styles.dwg. In Toolspace, on the Settings tab, expand the Parcel collection, and then expand the Label Styles collection. Now expand Area and right-click the Standard style. Click New.
2
On the Label Style Composer dialog box Information tab, the new style name is Standard [Child]. Make changes as desired and click OK. Observe that in the Label Style collection, the new child style appears under Standard.
Exercise: Object and Label Styles | 57
3
Right-click Standard and click Edit. In the Label Style Composer dialog box, on the Layout tab, change the Border Visibility setting to True. Note that now a visible border is displayed around the label. Click OK to close the dialog box.
4
Right-click the Standard [Child] Label and click Edit. On the Layout tab, observe that the change to the parent style has affected the child style, which now also has a Border Visibility setting of True.
58 | Chapter 3 Using Styles and Settings
Exercise: Object and Label Styles | 59
60
Designing Drawing Standards
4
This chapter outlines a process for creating drawing templates. You can use drawing templates to save time by establishing a consistent format for drawings and a standard design process.
Creating Templates AutoCAD Civil 3D provides a number of features that contribute to a standard appearance and behavior for all your drawings. These can all be specified in a drawing template, which is saved as a .dwt file. Your organization may need several templates for different customers or project types. Then, whenever you start a new drawing, you can open a template that contains all the required settings and styles. The general process for setting up a template is described in the following sections.
61
STA=22+00.00
Units and precision for alignments are set in the template file.
LOT: 1 Area: 8321.86 sq. m 0.83 hectares
Lot labels are controlled by a parcel label style, which could also be defined in the template file.
Defining standards using a template file and a label style
62 | Chapter 4 Designing Drawing Standards
Drawing Settings As a basis for configuring your drawing settings, choose an existing template that is closest to your needs. To see the available templates, click File menu ➤ New. If you want some preset object styles, the four templates that have names beginning with “_AutoCAD Civil 3D”, are recommended. The names of these templates, such as AutoCAD Civil 3D (Imperial) NCS Base.dwt, indicate some of their settings. The metric or imperial label indicates the main unit of measure. After choosing your initial template, the next step is to review and edit settings. On the Toolspace Settings tab, right-click the drawing name and click Edit Drawing Settings. The Drawing Settings dialog box includes five tabs and many settings.
Use the table on the Object Layers tab to assign objects to layers, and create or rename layers. When designing your use of layers, consider the following points: ■
Objects on the same layer are turned on and off together if you change the layer visibility. For maximum display flexibility, spread objects and their components across several layers.
■
The color of a layer affects all objects assigned to that layer that are drawn in a style that uses the ByLayer color setting. If you set up styles this way, you can change the color of many objects by simply changing the layer color.
Use the Abbreviations tab as a central location in which to set the abbreviations used in object labels, especially for alignment and profile geometry points. Using the Ambient Settings tab requires a careful review, because it provides global default settings, such as the precision of numeric values, and the visibility of tooltips. One very useful setting is the General setting, Save
Drawing Settings | 63
Command Changes To Settings. If you set this to Yes, then whenever you change a setting, such as the radius of an alignment curve, it is saved as the default value for next time. Another important setting on this tab is Independent Layer On. This must be set to No if you want to be able to control object visibility by turning layers on and off. On the Ambient Settings tab, you see a blue arrow in the Child Override column next to any setting that is changed for one or more features (objects) in the drawing. You can cancel the override by clicking the arrow, and you can click the lock icon to lock any setting and prevent overrides at the feature level.
After configuring the ambient settings, you should work down through Point, Surface, and other features in the Settings tree, right-clicking each feature and selecting Edit Feature Settings. Doing this allows you to examine the default styles for each feature and its labels, the feature name format, and other settings that you may want to modify. The ambient settings you configured at the drawing level are available at the feature level in case you want to override them.
Layer Standards Maintaining a standard for the use of layers is easier if you have a drawing template with predefined layers, and styles that reference those layers when objects are created. For additional consistency, save your template as an AutoCAD standards file (.dws format). Then, in the template, enter the STANDARDS command and in the Configure Standards dialog box, link the standards file to the template. If you want to enforce the standards, you can click the Settings button and activate notifications of standards violations, or
64 | Chapter 4 Designing Drawing Standards
override such violations. For more information, see Define Standards in the AutoCAD help.
Object Styles Ideally, your drawing template will have the perfect set of styles for your projects, but this usually takes some time to evolve. To assist the process, create a demonstration drawing that contains one or more surface, alignment, and other object types. Or you can explore the Sample_styles.dwg, that is supplied with AutoCAD Civil 3D. After a default installation, you can find this file at: C:\Program Files\AutoCAD Civil 3D 2009\Best Practices Guide\Sample_styles.dwg. This provides a good laboratory in which to display and develop styles. Consider designing styles to reflect the information requirements at different times in the project. For example, create styles for objects in the design phase, and other styles for their final presentation. Also, you can create styles for different users of the drawings, showing object details and labels that present the data each type of user needs.
Label Styles The styles for labels are another template item that should be developed with a top-down approach, similar to that for drawing settings and feature settings. At the drawing level, click Edit Label Style Defaults. In this context, you can set global standards such as those for text font, size, and label behavior around curves. As with the object styles, after setting label style defaults you can review the feature-level settings and apply any required overrides. In this release of AutoCAD Civil 3D, you can use general line and curve label styles for parcel segment labels, and for alignment line and curve labels. Previously, general line label styles could be used to label only lines, curves, and polylines. The general line label styles are now available from the parcel, alignment, grading, and survey menus. For more information, see Label Objects (page 54). Parcel tables now support general line and curve label types and display either general line and curve labels or parcel segment labels. For more information, see Table Creation and Label Types (page 54).
Object Styles | 65
Plan Production Tools You can use AutoCAD Civil 3D plan production tools to automate the process of creating construction documents from your designs. Select an alignment in your drawing, and using the plan production tools, you can quickly create sheets that automatically display the desired data. You can use the View Frames wizard to create view frames along an alignment. Click General menu ➤ Plan Production Tools ➤ Create View Frames to open the View Frames wizard. After creating the view frames, you can easily create sheets for construction plans. Click General menu ➤ Plan Production Tools ➤ Create Sheets to open the Create Sheets wizard. See Plan Production Tools (page 149) to explore the view frame and sheet creation process. For more information about Plan Production tools, see Plan Production Tools in the Help system.
Enhancing Drawings with Visualization Tools AutoCAD render materials can greatly enhance the appearance of your drawings by simulating real world materials for a more realistic view of the design. Experiment with the render materials to determine which will work best for your drawings. You can use this feature to enhance renderings of surfaces, corridors, and pipe networks. Click View menu ➤ Render ➤ Render to render the object with the selected material. Click View menu ➤ Render ➤ Materials to open the Render Materials dialog box, where you can create new materials and add or remove materials from the current drawing. For more information, see Render Materials in the Help system.
66 | Chapter 4 Designing Drawing Standards
Exercise: Drawing Settings In this exercise, you will open a file that contains alignments and look at some ways to work with drawing settings in AutoCAD Civil 3D. Using alignments as an example, you will learn how to edit the drawing settings to specify the default layer on which new objects will be created. To set up object layers in AutoCAD Civil 3D 1
Open the file C:\Program Files\Autodesk Civil 3D 2009 \Getting Started Guide\GSG_alignments.dwg. Click View menu ➤ Zoom ➤ Window. Draw a rectangle that includes the sketch lines at the bottom. Your view of the drawing should look like this.
2
In Toolspace, on the Settings tab, right-click the name of the drawing and click Edit Drawing Settings.
3
In the Drawing Settings dialog box, click the Object Layers tab. This tab shows the default layers on which the various objects are created. You will change the default layer for alignments.
Exercise: Drawing Settings | 67
4
On the Object Layers tab, in the Alignment row, click the C-ROAD value. In the Layer Selection dialog box, select the C-ROAD-CNTR row. Click OK twice to exit the Settings dialog boxes.
5
Click Alignments menu ➤ Create Alignment From Polyline. In the drawing, click the cyan polyline at the bottom of the drawing.
6
In the Create Alignment dialog box, for Alignment Style, select Major Road. Note that the Alignment Layer is set to C-ROAD-CNTR. New alignments will be placed on this layer. Click OK.
7
The new alignment is drawn on the C-ROAD-CNTR layer, using the Major Road style.
68 | Chapter 4 Designing Drawing Standards
Managing Project Data
5
The project management feature of AutoCAD Civil 3D is based on Autodesk Vault, a database for storing and sharing data among members of a project team. This chapter explains how to set up and use Autodesk Vault to manage your projects. The project management system also includes the data reference methods known as External References (xrefs) and Data Shortcuts, which you can use for less complex and smaller projects.
The Collaborative Environment The project management system supports shared access to project files by an entire design team. There are three mechanisms for the sharing of design data within a project: ■
Object references in Autodesk Vault
■
External references
■
Data shortcuts
Before deciding which method to use, consider the complexity of drawings, the number of drawings involved, the size of your project team that will access and edit the files, and your requirements for ease of use as opposed to your need for data security. Each mechanism is best suited to particular project requirements.
Autodesk Vault The heart of the project management system is a set of project folders in an Autodesk Vault database. These folders can contain databases of point objects, along with official copies of surfaces, alignments, and other objects. When you
69
want to edit a particular drawing, you can check it out from the database, which locks it so that other users can get a read-only copy, but cannot edit the drawing. As shown in the following illustration, you can import some read-only reference objects from the Vault database, such as surfaces or alignments into a drawing. These reference objects participate in the design process within your local drawing. You can change their style and labeling, but you cannot change their geometry.
Reference Surface
Parcel Drawing
Reference Alignments
A user with edit permissions for the reference object can check out the drawing that contains the master copy and change it. When the edited version is checked back into the database, any open drawing that contains a reference copy is updated with markers in the Prospector tree and the Windows System Tray, advising the user that the drawing does not include the latest version of the reference object. The user can choose to update the object or not. Whenever a drawing that contains a reference object is opened, it automatically retrieves the latest version of the reference object.
70 | Chapter 5 Managing Project Data
Access to Autodesk Vault When you install AutoCAD Civil 3D, you have the option of installing a stand-alone Autodesk Vault database on your computer. This database is good for experimenting with project management commands, but it cannot support multiple users. The other option is to install the Autodesk Vault server on a network, which creates a multi-user production system. In either case, you can access the Autodesk Vault database on the Toolspace Prospector tab, Master View. Simply right-click the Projects icon and click Log In. Alternatively, on the Windows Start menu, launch the Autodesk Vault application.
Autodesk Vault Set Up If you follow a few general guidelines for creating user accounts and databases, you can ensure that your system balances data security with ease of use.
Database Projects and Folders You can create project directories and folders within either AutoCAD Civil 3D or Autodesk Vault. However, a drawing can contain objects from only one project. In the same project you should include all data and drawings that can possibly relate to each other, to facilitate object sharing. The standard project folder structure for AutoCAD Civil 3D is shown in the following illustration:
Access to Autodesk Vault | 71
In this example, a project named Park Project includes collections of drawings, alignments, and surfaces. Placeholders exist for points, pipe networks, and a survey database. The object collections, such as Alignments, include all objects that are shared within the project, for read-only use by members of the project team. The security framework for project folders is described in the following section.
User Accounts and Roles Each person using your Autodesk Vault database has one of three main user roles: ■
Administrator
■
Vault Editor
■
Vault Consumer
Permissions can be applied to individual users and to user groups. With careful planning, you can minimize the amount of configuration required and create a flexible security system. For example, rather than assigning permissions to each user, you can save time by creating project-specific user groups or
72 | Chapter 5 Managing Project Data
job-based groups, such as Engineers, Project Managers, and Data Technicians. Then, you can add users to the groups and set permissions once for each group. Later, you can move users from one group to another to change their permissions.
Administrator The Administrator role has the highest level of permissions, and is able to do all tasks on the server and within Autodesk Vault databases. Only an administrator can create user accounts, user groups, and databases on the server, and set access permissions. For security purposes, only a few users should have administrator permissions, but enough so that an administrator is always available during work hours.
Vault Editor A Vault Editor has full read-write permissions within Autodesk Vault, and is able to create new projects and folders in the database, add files, and edit files. Assign this user role to anyone who needs to create drawings and share objects within the database.
Vault Consumer A Vault Consumer has read-only access to the database, and is able to get reference versions of objects for use in drawings saved outside of the database. Assign this role to anyone who does not regularly share objects or add drawings to a project.
Autodesk Vault Set Up | 73
External References (xrefs) You can insert into your current drawing an external reference (xref) of the entire contents of another drawing as a display-only object. To insert an xref, click Insert menu ➤ External Reference and in the Select Reference File dialog box, insert a specified drawing (.dwg) into your current drawing. Objects in the referenced drawing cannot be edited, but you can control the display of separate components with the Layer Manager.
Xref Advantages Xrefs may be as simple as a single object or as complex as a complete design. Keep in mind that xrefs insert into your current drawing the entire contents of the drawing. The advantage of xrefs is that they can be used with different DWG types. Xrefs are ideally used when you will not need to manipulate objects within the referenced file. They can also be used with either data shortcuts or Autodesk Vault. Another advantage of using xrefs is that you can label them in your current drawing. Because parcel data is not supported by Vault, you can import parcel xrefs and then can annotate them as you would any other object. You can also create parcel tables using xrefs. It is recommended that you do not label xref data in the source drawing, but rather in the current drawing. NOTE Any changes to the source drawing will be reflected in the current drawing’s xref labels.
Xref Constraints Xrefs are display-only and they provide no access to object data such as surface elevations or alignment length. For example, you cannot create a surface profile from a surface in an xref. Both data shortcuts and Vault object references provide access to object data. Xrefs are best used when you do not need to edit objects within the referenced file. Links can be easily moved and reference files renamed with ease. Use caution as xrefs do not provide the security mechanism that Autodesk Vault does.
74 | Chapter 5 Managing Project Data
Data Shortcuts You can use a data shortcut to import a complete reference copy of an object into one or more drawings. Data shortcuts offer great flexibility, and you can easily learn to use them. The data shortcut method is ideal for use by small design teams in which all members have access to a shared network location. In this release of AutoCAD Civil 3D, there is a new Data Shortcut Editor that facilitates this process. Use this editor to create data shortcuts and folders in which to store the reference copies.
Data Shortcut Advantages Data shortcuts are a convenient way to share object data that is entirely based on drawings without the complication of maintaining a database. These objects automatically update when you open a file in which you have referenced data. Reference objects are data shortcuts that can have styles and labels that are different from the source drawing. Data shortcuts can be used to reference surface, alignment, profile, pipe network, and view frame group objects. An example of a data shortcut would be to reference an alignment into a drawing in which you want to create profiles. You can use the data shortcut to keep profiles in a separate drawing from the alignment, to abide by the best practice of “one object per drawing.” For more information about data shortcuts, see Using Data Shortcuts in the Help system. For Data Shortcut Editor information, see Data Shortcut Editor Help.
Data Shortcuts | 75
Parcel Drawing
Surface Object
Data Shortcut
Use a data shortcut to reference a surface object into a drawing
Data Shortcut Constraints Data shortcuts do not provide data versioning or security controls. They should be used only when team members have equal access to project files.
76 | Chapter 5 Managing Project Data
Exercise: Creating a Data Shortcut In this exercise, you will learn how to create a data shortcut by referencing data from another drawing. You will reference surface object data into a parcel design drawing and create a data shortcut from the Data Shortcuts node on the Toolspace Prospector tab. This exercise also demonstrates how to access the new Data Shortcuts Editor and use it to create the reference. To create a data shortcut in AutoCAD Civil 3D 1
Open the file C:\Program Files\Autodesk Civil 3D 2009\Getting Started Guide\GSG_alignments.dwg. Keep the drawing open, but minimize it for now. Open the file C:\Program Files\Autodesk Civil 3D 2009\Getting Started Guide\GSG_parcels.dwg. In Toolspace, on the Prospector tab, in Master View, right-click Data Shortcuts and click New Data Shortcuts Folder. In the New Data Shortcut Folder dialog box, specify the name as Data Shortcut Test. Click OK.
Exercise: Creating a Data Shortcut | 77
2
In Toolspace, on the Prospector tab, in Master View, right-click Data Shortcuts and click Create Data Shortcuts. In the Create Data Shortcuts dialog box, click the check box to select EG TOPO FINAL to include in the data shortcut. Click OK. The data shortcut is created.
3
Maximize GSG_alignments.dwg. In Toolspace, on the Prospector tab, in Master View, expand the Data Shortcuts collection. Under Surfaces, right-click EG Topo Final and click Create Reference.
4
In the Create Surface Reference dialog box, click the Source Surface arrow to see the entire source surface file path. Click OK.
5
In the Prospector Tree, expand the Surfaces collection to verify that the EG TOPO FINAL surface object is displayed. The data shortcut has been successfully entered and is now referenced in the GSG_alignments.dwg. Right-click EG TOPO FINAL and click Zoom. The drawing view zooms to the surface object as shown here.
78 | Chapter 5 Managing Project Data
6
Now, you will explore the new Data Shortcut Editor, which is a separate application. This editor can be used for bulk operations on data shortcuts. On the Windows Start menu navigate to your list of programs. Open the AutoCAD Civil 3D program group and click Data Shortcuts Editor. The editor opens in a separate window. Explore the interface and close the application.
Exercise: Creating a Data Shortcut | 79
80
Getting Started Exercises
6
This chapter explains and illustrates the concepts underlying AutoCAD Civil 3D features. Each feature section in this chapter has a corresponding drawing file. Each drawing illustrates the concepts introduced in that section. You can open the file to see examples of the objects and their various components. There is also a corresponding exercise for each feature, which gives you some basic hands-on experience with AutoCAD Civil 3D. The drawings also provide a good “sandbox” environment in which to explore product features and settings beyond the exercises.
Points The central repository for point information is the project database. The database is typically located on a central server and shared by a number of users, who attach the database to their drawings. However, point presentation is handled in the drawing. Point groups reference the point data directly and are responsible for drawing the points. Point groups have an override that forces all points in the group to use both that group’s preferred point style and point-label style, rather than the styles assigned to the individual points. You can insert or import points from different sources and in different formats. For example, you can define sets of description keys to help organize the insertion of points. Description keys use the raw description of incoming points to control the creation of each drawing point, including the following actions: ■
Assigning the point to a specific layer
■
Assigning a point style
■
Assigning a point label style
■
Translating the raw description into a full description
■
Rotating or scaling the point symbol
81
Points can also be created directly in the drawing, using a wide variety of methods, which are all available from the Points menu.
Points Drawing Open the file: C:\Program Files\AutoCAD Civil 3D 2009\Getting Started Guide\GSG_points.dwg. The drawing contains two named views. To go to a named view: 1 Click View menu ➤ Named Views. 2 In the View dialog box, click the view you want. Click Set Current. Click OK.
82 | Chapter 6 Getting Started Exercises
Named view: points_all
Road Centerline point group
Storm Manholes point group
Pond point group
Landscape Trees point group
Named view: points_detail
Point label style Manholes includes an arrow and leader line.
Point style Tree-20ft Pine has labels turned off.
Pond point group uses the Number and Elevation Only point label style.
Some point groups showing different uses of point styles and point label styles
Points | 83
Points: Getting Started Exercise In this exercise, you open a file that contains points and examine some of the ways to manage objects in AutoCAD Civil 3D. Using points as an example, you will learn how to use an item view of objects, and how to use the Properties dialog box. To view point lists and edit properties in AutoCAD Civil 3D 1
Open the file C:\Program Files\AutoCAD Civil 3D 2009\Getting Started Guide\GSG_points.dwg. Click View menu ➤ Zoom ➤ Window. Draw a rectangle in the upper left corner to zoom your view of the drawing so that it looks like this.
2
In Toolspace, click the Prospector tab. Expand the list of point groups, as shown in the illustration. The icon next to each point group indicates that you cannot expand the point group to the level of individual points. You can view the points in the item view.
3
Click the Road Centerline point group in the list. An item view of all the points contained in the group is displayed in Toolspace. Note that you can edit the individual points in the item view.
84 | Chapter 6 Getting Started Exercises
4
Right-click the Road Centerline point group. Click Properties. In the Point Group Properties dialog box, click the Include tab. The point group contains all the points with raw descriptions that match CLRD.
5
In the Point Group Properties dialog box, click the Query Builder tab. Both tabs point to the same Raw Description data. These tabs provide two different ways in which you can modify a point group.
6
Click the Include tab. Clear the check box for With Raw Descriptions Matching. Select With Numbers Matching. Enter 755,757 in the text box. Click OK. Note that only two points remain in the point group item view.
Points: Getting Started Exercise | 85
Surfaces You can work with two types of surfaces: TIN (triangulated irregular network) and grid. For each of these types, you can create volume surfaces, which are differential surfaces created from two existing surfaces. Surface styles define the appearance of any surface. They can also be used to control the visibility of any analysis that has been performed on that surface. Watersheds can be drawn on the surface, with information about the type of drainage area and where each area drains to. Boundaries define the visible area of a surface. Only the area within the boundary is included in calculations, such as for total area and volume. You can also define masks to hide or show parts of a surface for editing or presentation purposes, while still including that area in calculations. Breaklines are used on TIN surfaces to define linear features that triangles cannot cross, such as retaining walls or streams. Breaklines affect triangulation of the surface. You can define different sets of contours, for example, for different intervals. Smoothing is provided for the surface object as a whole, which gives better results than simply smoothing the contours. In AutoCAD Civil 3D, the build process for surfaces is incremental. Whenever data is added or corrected, the surface is updated. Each surface has a definition list. This list contains all the operations performed on the surface. By turning the operations on and off, you can return a surface to a previous state or modify it to support different types of analysis.
Surfaces Drawing Open the file: C:\Program Files\AutoCAD Civil 3D 2009\Getting Started Guide\GSG_surfaces.dwg. The drawing contains two named views. To go to a named view: 1 Click View menu ➤ Named Views. 2 In the View dialog box, click the view you want. Click Set Current. Click OK.
86 | Chapter 6 Getting Started Exercises
Named view: surfaces_all
EG surface boundary
FG surface boundary
Contours with smoothing
Watershed analysis (labels turned off )
Named view: surfaces_detail
Elevation analysis (colored 3D faces) Slope arrows turned on
Breakline
Surfaces showing boundaries, contours, elevation analysis, and slope arrows
Surfaces | 87
Surfaces: Getting Started Exercise In this exercise, you open a file that contains surfaces and look at some ways to work with styles in AutoCAD Civil 3D. Using surfaces as an example, you will learn how to create new styles, and how to use styles to change the appearance of an object. To create or change a surface style in AutoCAD Civil 3D 1
Open the file C:\Program Files\AutoCAD Civil 3D 2009\Getting Started Guide\GSG_surfaces.dwg.
2
In Toolspace, on the Settings tab, expand the list of surface styles, as shown in the illustration. The triangle icon next to a surface style indicates that the style is applied to at least one surface in the drawing.
3
Right-click the Finish Grade surface style. Click Copy. In the Surface Style dialog box, on the Information tab, for Name, enter Finish Grade Contours.
88 | Chapter 6 Getting Started Exercises
4
Click the Display tab. In the Visible column, click the light bulb icons to turn on both Major Contour and Minor Contour. Turn off Elevations and Slope Arrows. Click OK. You have created a new surface style. Next, you will apply it to a surface.
5
In Toolspace, on the Prospector tab, expand the list of surfaces. Click the Surfaces collection in the list. An item view of the surfaces in the drawing appears in Toolspace. Note that the name of the style assigned to the FG surface is Finish grade.
6
Right-click the FG surface in the list. Click Surface Properties. In the Surface Properties dialog box, click the Information tab. For Surface Style, select Finish Grade Contours from the list. Click OK.
7
The new style is applied to the FG surface. The drawing is updated.
Surfaces: Getting Started Exercise | 89
Grading You create a grading by selecting a base line in the drawing, and then specifying a projection method and target, for example, grade at 3:1 to meet an existing surface. Save time and effort by predefining such values and saving them as grading criteria. Subsequent gradings you create will use the current criteria. You can also create named grading styles that combine specific display properties, such as colors. In addition to using the current criteria, any grading you create uses the current style. A grading normally consists of a face bounded by a base line, a target line, and several projection lines. The base line can be any open or closed figure from which you want to project the grading. It can be a feature line or a lot line. A feature line is any linear feature in the drawing, such as a ridge line, building footprint, or the bottom of a swale. The target for the grading can be a surface, a distance, or an elevation (absolute or relative). Each site can include grading groups, which bundle individual gradings into named sets. Before creating a grading, you must create a new grading group, or select one that already exists. A surface can be created from a grading group, and a grading group can be pasted into a surface. The surface will then be updated if you change the grading. After you create a grading group, volume tools within AutoCAD Civil 3D show you the amount of cut and fill required for the grading design. You can raise or lower the grading group incrementally to adjust volume requirements. You can also change the elevation of points along a grading base line, change the grade of a base line, or modify the grading criteria.
90 | Chapter 6 Getting Started Exercises
Face Base line
Feature line
Target line Projection line
Criteria uses slope of 3:1 with a surface target .
Gradings using different criteria
Grading group
The components of a grading object
Grading | 91
Grading: Getting Started Exercise In this exercise, you examine the properties of a grading and adjust its elevation to change cut and fill volumes. At any time during this exercise, you can look at the grading in three dimensions. To do this, right-click the grading object and click Object Viewer. To edit a grading in AutoCAD Civil 3D 1
Open the file C:\Program Files\AutoCAD Civil 3D 2009\Getting Started Guide\GSG_grading.dwg. You see a grading that is projected to a surface from a rectangular base line. The grading surface has its own contour lines, separate from those of the existing ground (surface EG). The faces of the grading have a slope pattern with short line segments along the upper edge of the face.
2
Click Grading menu ➤ Grading Utilities ➤ Grading Volume Tools. This toolbar shows the volume of fill required for the grading as designed. Click pane.
to open or close the History
3 Click to lower the grading group by one meter. Note the decrease in fill volume. The upper left corner of the grading is almost at the ground surface.
92 | Chapter 6 Getting Started Exercises
4 Click to automatically balance cut and fill volumes. Click OK in the AutoBalance Volumes dialog box. The volumes are balanced, within a tolerance factor, and a portion of the grading is set below the existing ground. You can identify cut slopes in the 2D plan view wherever the short lines of the slope pattern are on the outside edge of the grading. 5
Click Grading menu ➤ Create Grading to open the Grading Creation Tools.
6
On the Grading Creation Tools toolbar, near the right end, click Elevation Editor. Click any point along the rectangular base line of the grading. The Grading Elevation Editor opens, showing the elevation and grade at each corner of the base line. As you click each row of the table, a triangular marker appears in the drawing to mark the corresponding corner of the base line. You can click in the elevation cell for any row in the table and change the elevation. The related grades change automatically.
Grading: Getting Started Exercise | 93
Parcels AutoCAD Civil 3D provides a site topology that includes intelligent parcel objects. Each parcel is an independent object that usually represents real estate parcels or lots. You can also import parcels as simple polylines and then convert them to parcel objects. Parcels consist of a series of segments that can be edited individually. Editing parcel segments dynamically updates the parcel properties. Deleting a segment can result in one parcel merging with another. Each site contains one collection of parcels. The hierarchy of parent site and child parcels is managed on the Prospector tab in Toolspace. The parent site represents the original area to be subdivided. By creating a number of separate sites, you can manage large projects with many lots grouped in separate blocks. You can create parcels one at a time or as a group, with settings for the default area and minimum frontage of each parcel. Parcel layout tools give you precise control over parcel area and the angle of each lot line. Parcel styles determine the appearance of the parcel, including fill patterns for the area and linetypes for the segments. There are separate label styles for parcel areas and parcel segments.
Parcels Drawing Open the file: C:\Program Files\AutoCAD Civil 3D 2009\Getting Started Guide\GSG_parcels.dwg. The drawing contains two named views, as shown on the following page. To go to a named view: 1 Click View menu ➤ Named Views. 2 In the View dialog box, click the view you want. Click Set Current. Click OK.
94 | Chapter 6 Getting Started Exercises
Named view: parcels_all
Right-of-way parcel Region for residential lots
Named view: parcels_detail
Parcel style uses area fill
Area label
Segment label
Parcels and parcel components
Parcels | 95
Parcels: Getting Started Exercise In this exercise, you create a series of equal-sized parcels and learn how to edit parcel styles and parcel command settings. Using parcels as an example, you will learn how AutoCAD Civil 3D has automated some routine tasks in the design process. To create parcels and their labels in AutoCAD Civil 3D 1
Open the file C:\Program Files\AutoCAD Civil 3D 2009\Getting Started Guide\GSG_parcels.dwg. Zoom in to the extents of the large blue parcel, Oak Street_1.
2
Click Parcels menu ➤ Create Parcel By Layout. In the Parcel Layout Tools dialog box, if necessary, click to see the default settings for parcel creation. Set Automatic Mode to On.
3
Click (Slide Angle - Create) to open the Create Parcels - Layout dialog box. Set the Parcel Style to Residential and the Area Label Style to Parcel Name & Area. Click OK.
96 | Chapter 6 Getting Started Exercises
4
Follow the command-line prompts: Pick a point inside the parcel to be subdivided. Pick a frontage start point along the bottom edge of the parcel, near the curve on the left side. Pick a frontage end point near the curve on the right side of the parcel. Press Enter to accept default values for frontage angle (90 degrees) and parcel area (1 acre). The original parcel is subdivided into six. The first one retains the original name (Oak Street_1) and style.
5
Zoom in around a few of the new residential parcels. Click Parcels menu ➤ Add Parcel Labels ➤ Add Parcel Labels. In the Add Labels dialog box, set the Label Type to Multiple Segment. Click Add, but do not close the dialog box. Click the area label of any parcel to automatically add a label to each segment of the parcel. Specify which direction to add the labels. Click on a few more parcels to label them.
6
In the Add Labels dialog box, set the Label Type to Single Segment. Set the Line Label Style to Span Bearing-Distance-Crows Feet. Click along the bottom edge of the residential parcels to place a label for the line that spans multiple parcels. Curved indicators called “crow’s feet” mark the ends of the labeled line. This label is designed for placement below a line. If you apply it to the top
Parcels: Getting Started Exercise | 97
segment of a residential parcel, rightclick the label and select Flip Label. 7
For further exploration, you can edit Parcel command settings. On the Toolspace Settings tab, expand the Commands collection. Right-click CreateParcelByLayout to display the Edit Command Settings - CreateParcelByLayout dialog box. Expand the Default Styles. Set the Parcel Style property to Parent Parcel and click OK. Open the Create Parcels - Layout dialog box as you did in Step 1 and Step 2. Note that the default Parcel Style is now Parent Parcel.
98 | Chapter 6 Getting Started Exercises
Alignments Horizontal alignments are used to represent roads and other linear objects that follow a path in space. Alignments can include lines, curves, and spirals, which can be joined by constraints. When you edit an alignment, for example, by dragging a grip, the components of the alignment can maintain tangency to one another. You can create alignments from existing polylines, or by using alignment layout tools in AutoCAD Civil 3D. You can edit an alignment either by grip editing or by using the edit commands. Some of the creation and editing options are as follows: ■
Draw a series of tangents, then add curves or spiral-curve or spiral-line groups at the PIs (Points of Intersection).
■
Draw single lines, curves, and spirals.
■
View and edit the dimensions of alignment components.
■
Apply superelevation to the curves along an alignment.
Use station equations to change station-distance references at any point without physically changing the geometry of the alignment.
Alignments Drawing Open the file: C:\Program Files\AutoCAD Civil 3D 2009\Getting Started Guide\GSG_alignments.dwg. The drawing contains two named views, as shown on the following page. To go to a named view: 1 Click View menu ➤ Named Views. 2 In the View dialog box, click the view you want. Click Set Current. Click OK.
Alignments | 99
Named view: alignments_all
Alignments drawn with tangent-totangent curves
Parallel alignment labels used for local roads
Preliminary center lines sketched using lines and curves
Named view: alignments_labels
Station reference point at start of alignment Major road uses different line and label styles from local roads Station label
Design speed label
Alignments: lines, curves, and labels
100 | Chapter 6 Getting Started Exercises
Alignments: Getting Started Exercise In this exercise, you explore the Alignment Layout toolbar and learn how to edit alignments with grips. You can edit alignments, create new alignments, and use a variety of AutoCAD commands, while still having access to the Alignment Layout Tools toolbar, to perform layout commands. You can edit alignment geometry using the Panorama and Layout Parameters windows, and use grip edits to update the alignment dynamically. To edit alignments 1
Open the file C:\Program Files\AutoCAD Civil 3D 2009\Getting Started Guide\GSG_alignments.dwg. Click Alignments menu ➤ Create Alignment by Layout, to open the Create Alignment - Layout dialog box. Click OK to open the Alignment Layout Tools window. Note that the toolbar stays displayed while you work in the drawing.
Alignments: Getting Started Exercise | 101
2
In the drawing, click the alignment in the middle of the drawing so that the blue grips are displayed. In the Alignment Layout Tools, click to display the alignment’s Panorama vista, which lists alignment entity information, such as Type, Length, and Direction. Click another alignment and observe that the Panorama vista now lists the data for that alignment.
3
Now you will create and edit an alignment. Click Alignments menu ➤ Create Alignment by Layout. In the Create Alignment - Layout dialog box, set the Site to Conway Farms. Click OK.
4 On the toolbar, click Tangent (No Curves).
Tangent-
In the drawing, specify a starting point. Observe that data values are populated in the Layout Parameters dialog box. Specify an end point. Click Enter to end the command. Major Station Labels are displayed, looking something like this. 5
Click to select the new alignment. On the Alignment Layout Tools, click the Alignment Grid View button to open the Panorama vista. Click the square grip at the right end of the alignment. The grip turns red to show that it is active. Drag it to the right to lengthen the alignment. Observe that the Length, End Station, and End Point data is updated in the Panorama vista.
102 | Chapter 6 Getting Started Exercises
6
Now you will explore how to edit drawings using Lines and Curves drafting tools. Zoom in on the right side of the drawing so that it appears as shown here. First you will create a line perpendicular to an existing line. Click Lines/Curves menu ➤ Create Lines ➤ Line Perpendicular From Point. You are prompted to select an arc or line object. Select the top horizontal line in the drawing view. Now select the point where the perpendicular line will start. Enter 55 to select the length of the perpendicular line. The drawing appears as shown here.
7
Click Lines/Curves menu ➤ Create Lines ➤ Line Tangent From Point. You are prompted to select an arc or line object. Select the vertical line in the drawing as shown here.
Alignments: Getting Started Exercise | 103
8
Now select the point where the tangent line will start. When prompted, click the line to select the length of the tangent line (where it will end). The drawing appears as shown here.
9
Now you will create a curve between two connected lines. Click Lines/Curves menu ➤ Create Curves ➤ Curve Between Two Lines. At the bottom of the drawing, select a horizontal line as the first tangent and then select the connected vertical line. Now you are prompted with multiple options with which to determine the size of the arc. Select length (L) and enter 111. The drawing appears as shown here. For further exploration, try using the various methods of determining the size of lines and arcs.
104 | Chapter 6 Getting Started Exercises
10
Now you will convert the newly created arc entity to an alignment. Click Alignments menu ➤ Create Alignment By Layout. In the Alignment Layout Tools, click Convert AutoCAD Line and Arc. You are prompted to select an arc or line to convert. Select the arc and observe that it is now defined as an alignment.
Alignments: Getting Started Exercise | 105
Profiles Profiles (also known as vertical alignments), are derived from horizontal alignments in the drawing. There are two types of profiles. Surface profiles, often called existing ground (EG) profiles, are extracted from a surface. Layout profiles, often called finished grade (FG) profiles, represent a designed surface such as a road. A profile can be dynamic, in which case it is linked to a surface to reflect updates to the surface or the horizontal alignment. It can also be static, to preserve a record of a surface at a particular time. You can use three types of vertical curves in a profile: parabolic, asymmetric parabolic, and circular. You create static profiles in various ways, such as importing a text file, importing an XML file, or by using the Profile Layout Tools dialog box. Edit a profile by grip editing or by using the edit commands in the Profile Layout Tools dialog box. Profiles are displayed in graphs called profile views. Profile views are separate objects that have their own sets of styles. You can add data bands to annotate the profile view with stations and elevations, horizontal geometry points, or other useful data. You can save several data bands in a set that can be easily applied to other profile views.
Profiles Drawing Open the file: C:\Program Files\AutoCAD Civil 3D 2009\Getting Started Guide\GSG_profiles.dwg. The drawing contains two named views, as shown on the following page. To go to a named view: 1 Click View menu ➤ Named Views. 2 In the View dialog box, click the view you want. Click Set Current. Click OK.
106 | Chapter 6 Getting Started Exercises
Named view: profiles_all
Grade break and elevation profiles defined by profile label styles Axes and grid defined by profile view styles
Data bands defined by profile view band styles
Named view: profiles_detail
Profile label shows a tangent grade
Surface and layout profiles
Surface and layout profiles displayed in a profile view
Profiles | 107
Profiles: Getting Started Exercise In this exercise, you open a file containing profiles and experiment with grip editing in AutoCAD Civil 3D. Using profiles as an example, you will learn how objects can be dynamically updated in response to changes in another object. To make dynamic updates in AutoCAD Civil 3D 1
Open the file C:\Program Files\AutoCAD Civil 3D 2009\Getting Started Guide\GSG_profiles.dwg.
2
Click View menu ➤ Zoom ➤ Extents. Click View menu ➤ Zoom ➤ Window. Draw a rectangle that includes the profile view at the top and the EastWest alignment at the bottom.
3
On the AutoCAD Layers toolbar, click . In the Layer Properties Manager dialog box, click the light bulb next to the CROAD-PROF-FGRD layer to turn it off. This turns off the FG profile in the profile view and makes the green EG profile easier to see.
108 | Chapter 6 Getting Started Exercises
4
In the drawing, click the alignment so that the blue grips appear, as shown in the illustration. Drag the grips to modify the alignment dynamically. As you modify the alignment, the profile will update at the same time.
5
The green profile in the profile view at the top of the drawing represents the intersection of the alignment with the existing ground surface. The profile looks like this before you modify the alignment.
6
Click the square grip at the far left of the alignment. (Try to watch the green profile as you complete the following step.) The grip turns red to show that it is active. Drag it a little farther to the left and then release it.
7
Note that the profile has been extended to include the addition to the alignment. It now looks something like this. (You may want to experiment further and see the effect of editing the alignment curves before you close this drawing.)
Profiles: Getting Started Exercise | 109
Sections Sections, or cross sections, are cut across a linear feature to a specified distance on the left and right of a center line. Sections are typically sampled at given stations along a horizontal road alignment. Edits to an alignment update the sections as well. Sections are located on sample lines that cut across the alignment. Sample lines have their own styles and can be labeled. A set of sample lines makes up a named collection called a sample-line group. Sections are displayed in a graph called a section view. A section view is very similar to a profile view. It consists of a grid or graph with attributes that are controlled by section-view styles. You can also display data bands above or below the section view. You can plot individual sections for a specific sample line, or all the sections for a group of sample lines. To plot multiple sections, use a paperspace viewport to set up the sheet. Sections, like alignments and profiles, support label sets. Label sets enable you to save and apply an unlimited number of different types of labels.
Sections Drawing Open the file C:\Program Files\AutoCAD Civil 3D 2009\Getting Started Guide\GSG_sections.dwg. The drawing contains two named views, as shown on the following page. To go to a named view: 1 Click View menu ➤ Named Views. 2 In the View dialog box, click the view you want. Click Set Current. Click OK.
110 | Chapter 6 Getting Started Exercises
Named view: section_detail
Sample lines belong to the East-West sample line group
Stations and sample-line names are displayed by the sample-line-group label style Section view for this sample line is shown below
Named view: section_view
Centerline Section line
Right swath width Data band
A group of sample lines and a section view across one of them
Sections | 111
Sections: Getting Started Exercise In this exercise, you open a file that contains sections and revisit the process of applying custom styles in AutoCAD Civil 3D. Using sections as an example, you will learn how to select an individual object and apply a new style to it. To change label styles in AutoCAD Civil 3D 1
Open the file C:\Program Files\AutoCAD Civil 3D 2009\Getting Started Guide\GSG_sections.dwg. The drawing looks like this. There are several sample lines crossing an alignment.
2
In Toolspace, on the Prospector tab, expand the list of alignments (under Sites/Conway Farms). Expand the East-West Drive alignment. Then expand Sample Line Groups and the East-West sample line group. Note the black dot glyph which indicates sample lines exist in the drawing. Click on Sample Lines to display the list of sample lines in List View, as shown in the illustration. Next, you will select one of the sample lines and change the label style.
112 | Chapter 6 Getting Started Exercises
3
Right-click Sample Lines and then click Sample Line Group Properties. In the Sample Line Group Properties dialog box, click the Sample Lines tab and then, select the row for sample line 8. Select the Edit Group Labels button. In the Sample Line Labels dialog box, change the label style to Name & Section Marks in the Pick Label Style dialog box, then click OK. Click Apply. Click OK to close the Sample Line Labels dialog box.
4
The sample line is updated in the drawing, as shown in the illustration. Next, you will update the existing section view for this sample line. Click View menu ➤ Named Views. Click section_view. Click Set Current. Click OK.
5
In Toolspace, on the Prospector tab, expand Section View Groups. Select Individual Section Views. In the List View, right-click the section view 3+50.00 (1). Click Properties.
6
In the Section View Properties dialog box, on the Information tab, for Object Style, select Standard. Click OK.
Sections: Getting Started Exercise | 113
7
The section view is updated in the drawing, as shown in the illustration.
114 | Chapter 6 Getting Started Exercises
Mass Haul Diagrams: Getting Started Exercise In this exercise, you will open a file that contains sections and explore the process of creating mass haul diagrams in AutoCAD Civil 3D. Use mass haul diagrams to graphically display a partial or overall view of earthwork volumes. They are used to analyze aspects of the design, such as the distance over which cut and fill will balance, the amount of material to be moved, and the direction of movement. To generate a mass haul diagram, your drawing must contain an alignment, a sample line group, and a list of materials. Any corridor from which you generate a mass haul diagram will have a baseline alignment, and many will have one or more sample line groups. You will also explore the use of the Mass Haul Diagram Creation wizard and learn how to edit a mass haul line style. To create mass haul diagrams in AutoCAD Civil 3D 1
Open the file C:\Program Files\AutoCAD Civil 3D 2009\Getting Started Guide\GSG_sections.dwg. Click Sections menu ➤ Compute Materials. In the Select A Sample Line Group dialog box, Basic Road is the assigned alignment. The sample line group is SLG-1. Note that a sample line group must be selected to create mass haul diagrams. Click OK.
2
The materials exist in the drawing so you do not have to create them. In the Edit Material List dialog box, note the materials: Corridor surface and Basic Road Corridor Surface - (1)
Mass Haul Diagrams: Getting Started Exercise | 115
3
Click Sections menu ➤ Create Mass Haul Diagram. In the Create Mass Haul Diagram wizard, note that the General page specifies the alignment and the Sample Line Group. You can add an optional description to further describe the mass haul diagram.
4
Click Mass Haul Display Options or Next. To see the display options, click the Choose A Material To Display As Mass Haul Line option. Note the options for volume and grade materials.
5
Click Balancing Options to see the Balancing page, which is used to select the free haul distance, as well as the type, location, and capacity of borrow pits and dump sites. Select the Free Haul Distance check box.
116 | Chapter 6 Getting Started Exercises
6
Click Create Diagram. Then select a point in the drawing to insert the diagram. The mass haul view diagram is created in the drawing.
7
Right-click the black mass haul line and select Edit Mass Haul Line Style. In the Mass Haul Line Style dialog box, on the Display tab, for Mass Haul Line, double-click Color. In the Select Style dialog box, change the color to red. Click Apply. Click OK. The mass haul line displays as red in the drawing.
Pipe Networks You can use the pipe networks feature to design and model networks that support the flow and function of a utility system, such as a storm or sanitary sewer. You build a model of a pipe network using individual parts, much like a real-world pipe network, connecting pipes in your network either with or without using structures, such as manholes or catch basins, and adding inlet or outlet structures, such as headwalls, to mark the terminating end of a pipe run. After you have created your initial network design, you can view and edit network parts in virtually unlimited ways within plan view or in a profile view. You can also view the pipe network parts in a section. Preset design rules control the slope of pipes, their depth relative to a surface, and the sizing of the structures that connect the pipes. This is useful when you are designing a gravity system, such as a storm or sanitary sewer.
Pipe Networks Drawing Open the file C:\Program Files\AutoCAD Civil 3D 2009\Getting Started Guide\GSG_pipe_networks.dwg. The drawing file contains three viewports: the pipe network in plan view, the profile view of some of the network pipes and structures, and the same parts in a section view.
Pipe Networks | 117
The left pane shows a pipe network segment made up of two manhole structures connected by pipes. The network parts have been placed at a specified offset from an alignment, and are drawn in a profile view created using the same alignment (upper-right pane). A sample line placed at station 7+71 was used to create a section view (lower-right pane) that shows a cross-section view of the pipe network parts located at the station. You can edit the positions of the pipe network parts manually by using editing grips in either plan, profile, or section view, or by directly editing their properties.
Plan view shows the layout of pipe network parts in relation to other drawing objects Profile view shows the vertical layout of pipe network parts and alignment
Road section includes cross-section views of pipe network parts Layout, profile, and section views of a pipe network segment
118 | Chapter 6 Getting Started Exercises
3D view of pipe network segment
Pipe Networks | 119
Pipe Networks: Getting Started Exercise In this exercise, you edit a simple pipe network. Using the pipe network as an example, you will learn how to configure the pipe network layout tools, and to use the tools to create a new pipe that connects two structures. To create pipe network parts 1
Open the file C:\Program Files\AutoCAD Civil 3D 2009\Getting Started Guide\GSG_pipe_networks.dwg. The drawing window shows three views of parts in a pipe network: plan view, profile view, and cross-section view.
2
In Toolspace, on the Prospector tab, expand the collections of Pipe Networks and Networks. Expand the Network – (1) item. When you select the Pipes or Structures item found under the pipe network collection, part information is displayed in the item view, as shown in the illustration.
3
Right-click Network – (1). Click Edit Network. The Network Layout Tools toolbar contains all the tools you need to create or edit a pipe network, and lists the names of the alignment and surface that are referenced when parts are created.
120 | Chapter 6 Getting Started Exercises
4
In the Pipe List, select 18 inch Concrete Pipe. Ensure that the button to the right of the Pipe List is toggled to (Downslope). Click the button to the right of the Pipes list and click Pipes Only.
5
In the drawing window, in the plan view, place your cursor over the structure that is offset from station 7+71 on Conway Farms Drive. A connection marker is displayed (shown in the illustration) that indicates that the pipe will connect to the structure if you click at that location. Click the structure to connect the pipe end to it. Pan to the structure that is offset from station 1+00 on East-West Drive. With the connection marker active, click the structure to connect the pipe to it. Press Esc to end the command.
Pipe Networks: Getting Started Exercise | 121
Corridors Corridors are used for roads and similar structures that follow a designed route across the terrain. A corridor is a detailed three-dimensional design that combines data from a horizontal alignment, a profile view, and an assembly. The corridor can automatically reflect changes to any of the parent data. Subassembly objects such as road lanes, curbs, and shoulders form the building blocks for an assembly. When you apply the assembly to an alignment and a profile, a corridor is generated in three dimensions. At each point along its linear path, the corridor adapts to conditions, such as superelevation and cut or fill requirements.
Corridors Drawing Open the file C:\Program Files\AutoCAD Civil 3D 2009\Getting Started Guide\GSG_corridors.dwg. The drawing contains three viewports. Although the corridor, profile view, and assembly are all within the same drawing, the viewports help you see the object relationships. In the left pane, the horizontal alignment starts at the top of the corridor and runs to station 1658 at the bottom. In the profile view, station 0 is on the left side, and green vertical lines across the grid show the start and end points of the horizontal curves. In the assembly view, you can see that the corridor assembly includes two road lanes, a curb on the left, a sidewalk on the right, and side slopes on each side. The side slope subassembly (BasicSideSlopeCutDitch) is designed to create a ditch only on cut slopes, and the ditches are visible along the corridor. You can use the Object Viewer to see the corridor in a three-dimensional view that shows the cut and fill regions. Click the corridor, then right-click and click Object Viewer. Click near the bottom of the Object Viewer window, then click and move the cursor up to tilt the corridor. If you want to pan or zoom the display, right-click inside the Object Viewer window.
122 | Chapter 6 Getting Started Exercises
Corridor shows the design in relation to the surface
Profile shows the vertical layout and the surface
Assembly is a template for corridor cross-sections Elements of a corridor design
Corridors | 123
Corridors: Getting Started Exercise In this exercise, you examine the section views along a corridor and dynamically update the corridor by changing the layout profile. To review and edit corridor sections 1
Open the file C:\Program Files\AutoCAD Civil 3D 2009\Getting Started Guide\GSG_corridors.dwg. The drawing contains viewports that display a corridor, profile view, and assembly.
2
Click Corridors menu ➤ View/Edit Corridor Section. In the drawing window, click to select the corridor. The corridor is replaced with a view of the corridor cross-section and the existing ground surface at station 0. Note that the fill slopes are shown at this point.
3
On the View/Edit Corridor Section Tools Toolbar, select station 5+50. You see the section view at this station, which is in a fill area along the first curve.
124 | Chapter 6 Getting Started Exercises
4
Select station 9+50. This station is on the second curve, where the corridor has deep cut slopes. In the section, you can see the ditch that is automatically inserted on cut slopes. If you want to see other sections in this part of the corridor, click the arrows on the View/Edit Corridor Section Tools toolbar. Close the toolbar to close the view of the corridor cross-section.
5
In this step, you change the cut slope near the beginning of the corridor to a fill slope. In the profile view, click the layout profile. The points of vertical intersection (PVIs) are marked with red triangles. Click and drag the first PVI upward until the profile is completely above the surface. Click to place it in the new location. The corridor rebuilds, and the cut slope with ditches is replaced with a fill slope.
6
Click the corridor. Right-click, and then click Corridor Properties. In the Corridor Properties dialog box, on the Surfaces tab, click the Surface Style entry (Standard) and change it to Border & Contours. Click OK twice. When the corridor is rebuilt, contour lines are displayed on the corridor surface.
Corridors: Getting Started Exercise | 125
Survey You can use the survey tools in AutoCAD Civil 3D to import survey field data, analyze and correct it, and convert survey data into Civil 3D objects. Survey data is organized into databases, whose data is visible in Toolspace, on the Survey tab. The survey databases can either be integrated with your Autodesk Vault project management database, or stored locally.
Survey Drawing Open the file C:\Program Files\AutoCAD Civil 3D 2009\Getting Started Guide\ GSG_survey.dwg.
126 | Chapter 6 Getting Started Exercises
Survey | 127
Survey data imported from a field book
Buildings, lots, and roadway figures created from the survey data
128 | Chapter 6 Getting Started Exercises
Survey: Getting Started Exercise In this exercise, you import a fieldbook data file and create figures that represent buildings, lots, and roadways in a residential area. NOTE To prepare for this exercise, copy the fieldbook file Cedar-3.fbk from C:\Program Files\AutoCAD Civil 3D 2009\Getting Started Guide and paste it into your Civil 3D Projects folder. Default location of this folder is C:\Civil 3D Projects. To import a field book 1
Open the file C:\Program Files\AutoCAD Civil 3D 2009\Getting Started Guide\GSG_survey.dwg. Click Survey menu ➤ Open Survey Toolspace.
2
In the upper left corner of the Toolspace Survey tab, click (User Settings). Set Import Defaults to ■
Show Interactive Graphics YES
■
Insert Figure Objects NO
■
Insert Survey Points YES
Click OK to close the User Survey Settings dialog box. 3
In the Figure Prefix Databases collection, right-click Sample and click New. In the New Figure Prefix dialog box, set the name to BLDG and the Style to Building Outline. This setting ensures that each survey figure that has a name prefixed with BLDG will be drawn with the preset style Building Outline. Click OK to close the dialog box.
Survey: Getting Started Exercise | 129
4
Right-click Survey Databases and create a new database named Forest. In Toolspace, expand the Forest database, right-click Networks and create a new network named Cedar Properties.
5
Right-click the network Cedar Properties, click Import Field Book, then select the file Cedar-3.fbk. Review the Import Defaults, then click OK. The network of survey points is loaded into your drawing. Each point is also a Civil 3D point object that you can see on the Toolspace Prospector tab.
6
On the Survey tab, right-click Figures ➤ Insert Into Drawing. The figures for buildings, lots, and other details are drawn. Further exploration: On the Survey tab, refresh the Figures collection and ensure that the figures are visible in the List View. Then go to the Prospector tab, Survey collection. Right-click a figure and click Browse to Survey Data. On both the Prospector and Survey tabs you can right-click a figure and zoom to it.
130 | Chapter 6 Getting Started Exercises
Object and Label Styles The object styles in AutoCAD Civil 3D have general attributes, such as object color, visibility of components, linetypes, and fill patterns. Similarly, label styles work with text format, data content, location, and graphic elements, such as leader lines and bounding boxes. Within your design process, object and label styles should be created with specific purposes in mind, such as representing objects at different approval stages, or displaying the right information for different types of users. Before you create object styles, it makes sense to experiment with editing styles for different objects and to learn the available controls. Style components vary according to object type, but most object and label styles are accessible in the same two ways: ■
In Toolspace, on the Prospector tab, right-click an object and click Properties to see the object style. Some objects also show the label style here. Click the list button next to the style name and select Edit Current Selection to review or edit the style components.
■
In Toolspace, on the Settings tab, expand the object collection to see all the styles for that object, organized by types. Right-click any style name and click Edit to review or edit the style components.
For objects, you can access labels from the main object menu either by clicking Add Label or by using the Annotation menu (available when the Annotation and Drafting workspace is selected). You can create sets of labels for alignments, profiles, and sections in order to manage multiple labels easily. After the set is defined, it can be applied to or removed from an object in a single operation. The Getting Started exercises for object styles and label styles make use of the same drawing.
Object and Label Styles Drawing Open the file C:\Program Files\AutoCAD Civil 3D 2009\Getting Started Guide\ GSG_styles.dwg.
Object and Label Styles | 131
132 | Chapter 6 Getting Started Exercises
Object styles for a surface, parcels, and an alignment, showing stylization
Label styles, including two alignment labels in a dragged state
Object and Label Styles | 133
Object Styles: Getting Started Exercise In this exercise, you examine object styles for alignments and parcels, and learn how to change the styles. To review and modify object styles 1
Open the file C:\Program Files\AutoCAD Civil 3D 2009\Getting Started Guide\GSG_styles.dwg. Click View menu ➤ Named Views, and set the current Model View to Alignment CloseUp. You now have a good view of the alignment Oak CL, which is drawn in Design Style.
2
In Toolspace, on the Prospector tab, expand the Sites, Oak Street, and Alignments collections. Right-click Oak St. CL and click Properties. On the Information tab, change the Object Style to Plot Style. This demonstrates how easy it is to change an object’s appearance if you have preset styles available.
3
Click View menu ➤ Named Views, and set the current view to Parcels. In Toolspace, on the Prospector tab, expand the Parcels collection in the Oak Street site.
134 | Chapter 6 Getting Started Exercises
4
In Toolspace, on the Prospector tab, right-click one of the parcels, then click Properties. In the Parcel Properties dialog box, on the Information tab, note the Object Style name. On the list next to the style name, click Edit Current Selection to see the components of the style on the Display tab and the Design tab. Feel free to change style definitions here and apply the results to the drawing. See Style Notes following this exercise for sample style details to change.
5
In Toolspace, on the Prospector tab, right-click the Parcels collection and click Properties. Note the Parcel Style Display Order field, which determines how styles overlap in the drawing. While the Parent Parcel style is at the top, you see the magenta border of the site parcel. Select a different style, then use the Up and Down arrows to move this style to the top. In the drawing, note that the outer border of a parcel with the selected style is visible instead of the magenta border.
Style notes ■
In the Parcel Style dialog box, on the Display tab, use the light bulbs to control visibility of parcel borders and fill patterns.
■
Residential style, used on Oak Street_1, has a fill distance of 50 feet, which indicates how far in from the border the fill is applied.
■
New Parcels style, used on New Parcels 2 & 5, has fill pattern ANSI31 rotated 315 degrees (–45).
Object Styles: Getting Started Exercise | 135
Label Styles: Getting Started Exercise In this exercise, you examine label styles for alignments and parcels, and learn how to change them. To review and modify label styles 1
Open the file C:\Program Files\AutoCAD Civil 3D 2009\Getting Started Guide\GSG_styles.dwg. Click View menu ➤ Named Views, and set the current view to Label View.
2
On the alignment, click one of the Design Speed labels. A blue editing grip appears. Click the grip (it turns red) and drag it to a new location. You see the dragged state of this label. To return the label to its normal place, select it, then right-click and click Reset All Group Labels. Hold down the Ctrl key and click one of the green curve labels, then right-click and click Flip Label.
3
Now we will examine the style settings for the design speed labels. In Toolspace, on the Settings tab, expand the Alignment ➤ Label Styles ➤ Station ➤ Design Speed collection. Right-click the Standard label and click Edit.
136 | Chapter 6 Getting Started Exercises
4
In the Label Style Composer dialog box, on either the General or Layout tab, note the Preview window is set to show the Design Speed Label Style. The Preview will change to show the effects of your changes to style settings.
5
On the Layout tab, note that you change settings separately for three components of this label. Select Design Speed and experiment with changing the settings on the Layout tab for Anchor Component, Anchor Point, Border Visibility, and Border Type. Select the Line component and experiment with changing settings for Line Length and Angle.
6
Select the Station Component, select the Text Contents value in the right column, then click . The Text Component Editor dialog box is displayed. Note that the Properties list provides many preset values that you can add to the label by clicking the blue arrow at the upper right. In the editing window on the right, change the text STA to STATION, then click OK. The style change is displayed in the Preview. In the Label Style Composer dialog box, click OK. The style change is displayed in the drawing.
Label Styles: Getting Started Exercise | 137
Visualization You can use the visualization tools in AutoCAD Civil 3D to create enhanced design drawings using model rendering materials that correspond to specific real world materials in a design. AutoCAD render materials simulate the characteristics of materials such as asphalt, concrete, and gravel. To visualize a material with a render material, the material must be included in the current drawing. You can easily add materials to a drawing from the tool palette or by dragging materials used in one drawing into another drawing. You can also create a new render material, and save it to use as part of a drawing template or copy it into other drawings. In AutoCAD Civil 3D, you can apply render materials to features, such as surfaces and surface masks, corridor surfaces and corridor surface boundaries, and pipes and structures.
138 | Chapter 6 Getting Started Exercises
View using Civil 3D styles such as 2D wireframe and 3D realistic
Rendered image of a surface object simulated with grass and the underlying concrete drainage pipes and catch basins
Visualization | 139
Visualization: Getting Started Exercise In this exercise, you explore how to select AutoCAD render materials to simulate the appearance of pipe networks. When a pipe is created, the render material assigned to the pipe is defined in the Pipe or Structure part(s) list. After you add a part to the drawing, you can edit the render material for the part by using the Render Material option on either the Pipe Properties or the Structure Properties (Information tab) dialog box. To select render materials 1
Open the file C:\Program Files\AutoCAD Civil 3D 2009\Getting Started Guide\ GSG_pipe_networks.dwg.
2
In the drawing, right-click a pipe segment and select Pipe Properties to display the Pipe Properties - Pipe dialog box. Click the Information tab and note the Render Material at the bottom of the dialog box.
140 | Chapter 6 Getting Started Exercises
3
Click the displayed render material to open the list of available materials. Click . You are prompted to select an object from the drawing. Select another segment of the pipe and observe that the Pipe Properties dialog box is displayed again. Click OK to close the dialog box.
4
Click View menu ➤ Render ➤ Materials to display the Render Materials available in the drawing. You can use the tool palette to add, remove, or create new render materials for the current drawing. You can also copy materials from one drawing to another drawing.
Visualization: Getting Started Exercise | 141
5
You can also select render materials for pipes or structures by navigating to the Toolspace Prospector tab. Expand the Pipe Networks collection. Then expand the Networks collection and expand Network - (1). Click Pipes or Structures to open the Prospector list view shown here. Select a pipe and click its corresponding material in the Render Material column to display the Select Render Material dialog box.
142 | Chapter 6 Getting Started Exercises
Label Objects You manage label objects in AutoCAD Civil 3D with standard AutoCAD commands as well as Civil 3D commands. You can use the AutoCAD Properties palette to edit multiple labels in a single operation. For example, you can use the Properties palette to access the Text Component Editor in order to simultaneously edit text content for a group of any number of labels. If you are editing a drawing that includes dozens of pipe network parts with corresponding labels, you can edit the text, change the appearance, or reset the location of all of the labels at the same time by using multiple selection. It is important to remember that you can also select subentities of group type labels with the Ctrl-click selection method in order to edit individual labels one at a time. As independent objects, label objects are not “subentities” of a parent object. They reside on their own layer, the default of which is controlled using drawing settings. The Getting Started exercises for label objects makes use of the same drawing as profiles.
Label Objects | 143
Standard AutoCAD Properties
Label Properties
Label Properties controlled with AutoCAD Properties palette
144 | Chapter 6 Getting Started Exercises
Group Labels Context Menu
Label Objects | 145
Managing Label Objects: Getting Started Exercise You can use the label objects in AutoCAD Civil 3D to manage multiple labels by editing one or more properties with the AutoCAD Properties palette. The label objects are versatile. You can select individual label subentities using Ctrl-click in order to edit single labels that belong to the group. Label objects are controlled using standard AutoCAD commands in the Properties palette. You can control properties such as color, layer, linetype, and lineweight in addition to the label style and placement options. In this exercise, you will explore how to manage labels with the AutoCAD Properties palette. Using profile labels as an example, you will learn how to edit a group of label objects and also how to select and edit a single label object. You will also explore how to use grips to manage label placement. To manage labels 1
Open the file C:\Program Files\AutoCAD Civil 3D 2009\Getting Started Guide\GSG_profiles.dwg. Click View menu ➤ Zoom ➤ Window. Draw a rectangle in the top center to zoom your view of the drawing so that Profile View: East-West Drive displays at the top as it does in this illustration. On the profile, double-click one of the EG labels. The group of labels is highlighted with square grips as shown here. Note that the label group style is Standard and the labels are blue. The Properties palette is also displayed.
146 | Chapter 6 Getting Started Exercises
2
In the Properties palette, under Labeling, click Profile Grade Break Label Style and change the setting from Standard to Grade Over Elevation. Note that the entire label group has now changed to the Grade Over Elevation style. The result is shown in the illustration. Note that you can access the Select Style dialog box by selecting Create/Edit. From this dialog box, you can open the Label Style Composer by selecting Edit Current Selection.
3
Now you will select a subentity of the label group and change its style. Zoom out of the drawing so that you can see several components of the label group. Use CTRL-click to select one of the labels. Note that only this label is highlighted (with the blue square grip) as shown in the illustration and the Properties palette is displayed.
Managing Label Objects: Getting Started Exercise | 147
4
Change the Label Style setting to Standard and note that the label style reverts back to Standard. The label is now blue. The result is shown in the illustration.
5
Now you will learn how to reset label location. Click the label you selected in Step 3. The grip color is now red, indicating that it can be moved. Drag the label with the square grip and move the cursor away from the grip. The square grip is blue and another round blue grip is visible alongside the square grip. This round grip is a reset grip which can be clicked to restore the label to its original location. Click the round grip. You can make multiple drag edits to the label and the reset grip will reset the label to its original location. If you move a number of group labels, right-click a label and select Reset All Group Labels.
148 | Chapter 6 Getting Started Exercises
Plan Production Tools Use the Create View Frames and Create Sheets wizards to create sheets that automatically display segments of alignments and profiles in your plans. You can create view frame groups that automatically capture predefined areas along an alignment. Instead of needing to manually create many viewports on layouts to show segments of alignments, you can create view frames that automatically capture predefined areas along an alignment. View frames are rectangular areas along an alignment that represent what is displayed in the associated viewports on the layouts (sheets) to be created. This automation saves you from making many manual changes when your design data changes. The plan production tools simplify the process of preparing sheets from your design drawings. After you select an alignment in your drawing, in just a few seconds you can create sheets that automatically display the desired data. For information about Sheet Set Manager or the plotting or publishing processes, see the AutoCAD Help. For information about Plan Production tools, see Plan Production Tools in the Help system.
Plan Production Tools | 149
Creating View Frames and Sheets: Getting Started Exercise In this exercise, you will learn how to use the plan production tools to prepare your design for plotting or publishing. You will use the Create View Frames wizard to quickly create view frames along an alignment. Then, you will create sheets using the Create Sheets wizard. To create view frames and sheets in AutoCAD Civil 3D 1
Open the file C:\Program Files\Autodesk Civil 3D 2009\Getting Started Guide\GSG_alignments.dwg. Click General menu ➤ Plan Production Tools ➤ Create View Frames.
2
In the Create View Frames wizard, on the Alignment page, in the Alignment list, make sure that Conway Farms Drive is selected.
150 | Chapter 6 Getting Started Exercises
3
Click Next to open the Sheets page. On the Sheets page, in the Sheet Settings section, make sure that Plan And Profile is selected.
4
Click the Create View Frames button. The view frames are displayed along the alignment in the drawing window.
5
Now using the Create Sheets wizard, you will create sheets from the view frames that you created. Click General menu ➤ Plan Production Tools ➤ Create Sheets.
Creating View Frames and Sheets: Getting Started Exercise | 151
6
In the Create Sheets wizard, on the View Frame Group And Layouts page, in the View Frame Group area, select VFG - Conway Farms Drive - (1). In the Layout Creation area, select All Layouts In The Current Drawing. Click Create Sheets to close the wizard and create the sheets.
7
At the “To complete this process your current drawing will be saved” prompt, click OK. Then, click a blank area in the drawing to insert the view frames. After the progress dialog box is displayed, note that the new sheets are created in the current drawing. In the Sheet Set Manager, right-click and open one of the sheets.
8
The sheet is displayed as shown here. For more information, see Work with Sheets in a Sheetset in the AutoCAD Help.
152 | Chapter 6 Getting Started Exercises
Glossary
2D polyline A polyline with all vertices at the same elevation. 3D face An AutoCAD object that represents the surface of a 3- or 4-sided area, with each vertex potentially at a different elevation. You can view TINs (Triangulated Irregular Networks) as 3D faces. Using the SHADE command, you can shade 3D faces. Using the RENDER command, you can render the 3D faces. See also TIN surface. 3D polyline A polyline with vertices at varying elevations. A.A.S.H.T.O. American Association of State, Highway, and Transportation Officials. acre A measure of land: 160 square rods; 4,840 square yards; 43,560 square feet. alignment A series of 2D coordinates (northings and eastings), connected by lines or curves, used to represent features such as the road centerlines, edges of pavement, sidewalks, or rights-of-way. angle The difference in direction between two convergent lines measured in the units of degrees, radians, or grads. area The quantity of plane space in a horizontal plane enclosed by the boundary of any polygonal figure. assembly The combination of one or more subassemblies forming a typical section. The assembly is applied along a horizontal/vertical alignment to form a singular path-like structure. azimuth A clockwise angle measured from a reference meridian. Also known as north azimuth. It can range from 0 to 360 degrees. A negative azimuth is converted to a clockwise value. base line The object to which grading criteria are applied. A base line can be an open or closed 2D or 3D geometric figure that is a feature line or a lot line. See also control region, feature line.
Glossary | 153
base surface An existing ground or undeveloped terrain. Specified when creating volume surfaces. See also comparison surface, volume surface. bearing An angle measured from North or South, whichever is nearest, with the added designation of East or West. The angle is always less than 90 degrees (PI/2 radians or 100 grads) and is usually referenced by a quadrant number. border (surface) The visible limits of a surface. The border may or may not be defined from a boundary or may be the result of a defined boundary and operations performed on a surface, such as a Delete Line operation (a hole is created in the surface). If a boundary is not defined on a surface, the exterior border is always defined as the extents of the surface triangulation. boundary (surface) One of three kinds of closed polylines that limit the display area of the digital terrain model. Most common are outer surface boundaries constructed just outside the extremities of the dataset, eliminating unwanted interpolations across empty space where the surface has a concave shape. Also used are two types of internal surface boundaries: hide boundaries, to punch holes in a surface, (for example, a building footprint), or show boundaries, to create smaller surfaces by eliminating areas that fall outside the boundary. bounded volumes A method of calculating volumes using an existing AutoCAD object (for example, a polyline or polygon) to calculate the cut, fill, and net volume for the area bounded by the object. breakline A line used to connect the data representing a distinct surface feature, like a ridge line, edge of pavement, toe of a slope, centerline of a road, or flowline of a ditch or stream. When a breakline is defined, the surface triangulation must first follow the breaklines, by placing triangle edges coincident with the breakline segments. This ensures the feature in the model is accurately depicted. Then, the rest of the interpolation is performed based on proximity. Breaklines are typically critical to creating an accurate surface model. It is the interpolation of the data, not just the data itself, that determines the shape of the model. See also non-destructive breakline. breakline point A point that is included in the list of vertices for a defined breakline. ByBlock A setting specifying that a component of an object inherits the color or linetype associated with the object, or block, that contains it. ByLayer A setting specifying that an object or component of an object inherits the color or linetype associated with the assigned layer. catchment area The area tributary to a lake, stream, or drainage system.
154 | Glossary
chord A straight line connecting two points on a curve: the Point of Curvature (PC) and Point of Tangency (PT). The curve joins with a line or another curve at these points. clothoid spiral A spiral in which the curvature is a linear function of the length of the spiral, so that the degree of curvature is zero when it meets the tangent and then increases to match the curvature of the adjacent curve. See also compound spiral, simple spiral. COGO Short for Coordinate Geometry. COGO points The point objects that you create using the point-creation or point-import commands. COGO points are referred to simply as “points” in this documentation. The pieces of data associated with a point, such as point number, northing, and easting, are referred to as properties. See also properties. comparison surface A proposed or existing terrain surface used in the creation of volume surfaces. See also base surface, volume surface. composite volumes A method of calculating volumes using top and bottom surfaces (a surface pair) to establish cut, fill, and net volume values. compound curve A curve consisting of two or more arcs of different radii curving in the same direction, and having a common tangent or transition curve at their point of junction. compound spiral A spiral that provides a smooth transition between two adjoining curves of different radii but in the same direction. It has a finite radius on either side/end. See also clothoid spiral, simple spiral. contour A line that connects points of the same elevation or value relative to a specified reference datum. control region A region that is defined by applying grading criteria to a base line. A base line can have a single region along its entire length, or it may be subdivided into a number of control, transition, and void regions. See also base line, feature line. coordinates Values that specify exactly where a point is in space in terms of three planes: X, Y, and Z (easting, northing, and elevation). corridor Any path, the length and location of which is typically governed by one or more horizontal and vertical alignments. Examples are roadways, railways, traveled ways, channels, ditches, utility runs, airport runways, and taxiways. crest curve In a profile, a vertical curve on the crest of a hill or similar location where the grade leading into the curve is greater than the grade leading out
Glossary | 155
of the curve. In a crest curve, the point of vertical intersection (PVI) for the tangents is above the curve. See also sag curve. cross section See section. CS See curve to spiral. curve to spiral A point on a horizontal alignment where a curve meets a spiral. cut slope The slope created when the base line falls below the existing ground line. The resulting slope matching up into the existing ground is called a cut slope because the existing ground must be cut (removed) during construction. data band A graphic frame that is associated with a profile view object or section view object. The data band contains annotations for the profile or section view, as well as for the parent horizontal alignment. Some common annotations include elevation data, stations, and cut/fill depths. data collector A device surveyors use to automatically record the observation data they collect in the field. The raw survey data is downloaded and converted into a field book file, which is written in the Survey Command Language format, or a LandXML file, which uses the LandXML schema to describe the Survey data. Surveyors can then import this file to create points in the database and figures in the drawing. datum A reference value. All elevations or coordinates are set relative to this value. In surveying, two datums (horizontal and vertical) are generally used. For global coordinate systems, a datum refers to the ellipsoid information and the techniques used to determine positions on the Earth’s surface. An ellipsoid is part of a datum definition. daylight line A line showing the line of zero cut or fill within the job area. Daylight lines are also known as match lines. decimal degree The measure of an angle in decimal units. For example, 3°30'36" equals 3.51 decimal degrees. definition list A list that contains all the operations performed on a surface. By turning the items in the list on and off, you can modify the surface, return it to a previous state, and so on. degrees, minutes, seconds (DMS) A representation of an angle in degrees, minutes, and seconds in which a full circle contains 360 degrees, each degree 60 minutes, and each minute 60 seconds. A typical bearing in DMS measurement looks like: N45°45'58"E. Using this format, 3°30'36" is entered as 3.3036.
156 | Glossary
Delaunay triangulation A calculation method used in the creation of TIN networks. Given a set of data points, Delaunay triangulation produces a set of lines connecting each point to its natural neighbors. DEM (Digital Elevation Model) An array of elevations taken on a regularly spaced horizontal grid. description keys A method of translating descriptions to help standardize point data when a variety of data sources are used. For example, descriptions of EROAD, EPAVE, ERD, and EDGEROAD can all be translated to a description of EOP. The layer, point style, and point label style options can greatly enhance automatic base plan generation and the overall organization of the drawing. design rule A set of automatic constraints for some objects in the drawing that are enforced by applying a specific style. For example, if you are laying out alignments, you can specify a rule for a curve radius. drawing object An object that exists in a single drawing. See also project object. easting A linear distance eastwards from the North-South line which passes through the origin of a grid. Equivalent to the X coordinate in an XYZ coordinate system. elevation The vertical distance from a datum to a point or object on the Earth's surface. The datum is generally considered to be at sea level. Equivalent to the Z coordinate in an XYZ coordinate system. face A three-dimensional surface triangle. A face is represented by either a 3D face object or 3D line objects. feature line An object in AutoCAD Civil 3D that the grading commands can recognize and use as a base line. Usually, a line that marks some important feature in the drawing, such as a ridge line, or the bottom of a swale. See also base line, control region. fill slope The slope created when the base line falls above the existing ground line. The resulting slope matching down into the existing ground is called a fill slope because material must be brought in to fill the area during construction. fixed entity An alignment entity with a fixed position, not necessarily tangent to another entity for the definition of its geometry. See also float entity, free entity. float entity An alignment entity that is tangent to one other entity (before or after) for the definition of its geometry. See also fixed entity, free entity.
Glossary | 157
footprint vertices The endpoints that define the segments of a footprint with an XYZ location and stationing starting at the first vertex. free entity An entity that is tangent to two other entities (before and after) for the definition of its geometry. See also fixed entity, float entity. full description The expanded description of a point after description key matching has taken place. geodesic On a surface, the shortest line between two points, either a line or curve from one point along an ellipsoid to another. geodetic A basic relationship to the Earth that takes into account the curvature of the Earth’s sea level surface. For example, a geodetic distance is a distance or angle in which the Earth's curvature is taken into account, versus a distance or angle measured on a flat paper map. grade A method of reporting ground inclination in which the change in elevation is expressed as a percentage of the horizontal distance travelled. For example, if the ground rises one linear unit (meter or foot) over a horizontal distance of five units, the grade is 20%. See also slope. grade line See layout profile. grading The process used to model the finished ground surface. grading criteria The parameters that describe how a grading is accomplished. Two main components of grading criteria are the target type and the projection method. grading face The area bounded by the base line, the target line, and the two projection lines. See also grading target, target line. grading target The grading target defines what the projection lines from the footprint will intercept. The three choices for targets are: surface, relative or absolute elevation, and distance. See also grading face, target line. grads A system of angle measurement in which one grad equals 1/100 of a 90° angle, or 360° = 400 grads. grid A system of lines parallel to a given set of axes at a specific spacing. Grids are used to visualize surfaces and calculate volumes. A grid is also used for geodetic purposes. grid distance The distance between two points based on a coordinate zone, not on local northing and easting coordinates.
158 | Glossary
grid easting The easting coordinate that is based on a selected coordinate zone, as opposed to the local easting, which is based on the surveyor’s base point. See also local easting. grid northing The northing coordinate that is based on a selected coordinate zone, as opposed to the local northing, which is based on the surveyor's base point. See also local northing. grid surface A type of surface created from a DEM or SDTS file, or imported from a LandXML file. A grid surface consists of a sampled array of elevations for a number of ground positions at regularly spaced intervals. grid volume surface A differential grid surface based on user-specified base and comparison surfaces. The grid method of volume calculation measures the difference in elevation between two surfaces at each intersection in a user-defined grid. grip A moveable point on an object that you can drag to edit the object dynamically. hectare A measure of area, generally relating to land, of 10,000 square meters or approximately 2.47 acres. intersection The point where two or more lines, arcs, figures, or objects join or cross in two- or three-dimensional space. Kriging A method of surface smoothing that uses known values and a semivariogram to determine unknown values. Based on the semivariogram used, optimal weights are assigned to known values to calculate unknown ones. Since the variogram changes with distance, the weights depend on the known sample distribution. label component Text, a block, direction arrow, line, or tick that is used to construct a label style. Label styles can be made up of multiple label components. label set A collection of label definitions for multiple label types, such as station labels and geometry point labels. For example, alignment station labeling can be composed of major station labels, minor station labels, and geometry point labels. latitude The angular distance measured on a meridian north or south from the equator. layout profile A profile object that represents the finished ground elevations along a horizontal alignment or other linear feature that supports profile views. Typically this data is designed, not derived from a pre-existing source, and consists of a series of vertical tangents connected by vertical curves located
Glossary | 159
at each point of vertical intersection (PVI). This profile is also known as vertical alignment, profile grade line, grade line, and finished grade profile. layout toolbar A floating, dockable toolbar that groups together object-specific design and editing tools. local copy An object that is contained in a drawing that is attached to a project. Compare with official copy. local easting The easting coordinate that is based on the surveyor's assumed horizontal base point, as opposed to the grid easting, which is based on the global coordinate zone. See also grid easting. local elevation The elevation coordinate based on the surveyor's assumed vertical base point, or benchmark, versus a real world elevation value. local northing The northing coordinate that is based on the surveyor's assumed horizontal base point, as opposed to the grid northing, which is based on the global coordinate zone. See also grid northing. longitude The angle between the plane of a given meridian and the plane of the Greenwich meridian. mask (surface) A polygon used to mask the visible portions of the surface. masking A process of obscuring objects so that text can be placed over them in a clear area. Masking maintains legible text without destroying the objects underneath. match line See daylight line. mid-ordinate On a circular arc, the distance from the midpoint of a chord to the midpoint of the subtended arc. modifier A formula for formatting property field values, such as decimal precision for an area. You can use predefined modifiers, such as acres, feet, and meters, or you can define a custom modifier. See also property fields. Natural Neighbor Interpolation (NNI) A method of surface smoothing supported on TIN surfaces. NNI uses Delaunay triangulation to determine the elevation of an arbitrary point based on the elevations of known neighbor points. non-destructive breakline A breakline that is not crossed by triangulation lines in a TIN. Instead, new vertices are added to the breakline at the intersection of each TIN line and the breakline. The new points create additional surface triangles. This is useful when you do not want the elevation
160 | Glossary
of a surface to be interpolated inside an area that you know to be a constant elevation. See also breakline. northing A linear distance northwards from the East-West line which passes through the origin of a grid. Equivalent to the Y coordinate in an XYZ coordinate system. object In AutoCAD Civil 3D, an element in a drawing, for example, a point, surface, alignment, or profile, that can maintain a relationship with other objects. object model The underlying system of links and dependencies between objects. In the object model, changes in one object can be passed on automatically to all the objects associated with it. object reference A read-only copy of an object in the project database. The referenced object can be used in multiple drawings and stylized locally. When the official copy of the object is updated in the database, drawings with references to it are notified of the opportunity to update their local copy. official copy An object that is contained in the project database. Compare with local copy. override A value for a setting that replaces the value already set at the next higher level. Panorama A window that displays data in table form for the objects in a collection that is selected in Toolspace. For example, if you select a point group, the Panorama table displays a row for each point. parcel A discrete piece of 2D area. For example, a subdivision is composed of numerous parcels. Synonymous with lot. parcel node A point where two or more parcel segment ends join. parcel segment A parcel boundary element, a line or a curve. pass-through point A point on the path of a line or curve, often used to define an alignment. A pass-through point on a curve can be used as a grip to control the position of the curve. However the alignment is edited, its geometry has to go through the pass-through point. passing sight distance The distance measured to a point where an approaching vehicle comes into view ahead of a driver on an undivided road. This is used to calculate vertical crest curves. PC See point of curvature. PI See point of intersection.
Glossary | 161
pipe An object that connects structures in a pipe network, often to convey fluid in a utility system. pipe network Collection that manages pipe objects and structure objects representing the physical structure and function of a utility system such as a storm or sanitary sewer. plan readable Text that can be read easily in a normal plan view, that is, placed at an angle less than 270 degrees and more than 90 degrees. Also called right-reading. plan view The view of a site if you look straight down from an elevated position. point group Collection used to group the points in a project into smaller, more manageable units. For example, you can create a point group that contains all of the points in a project that meet certain elevation criteria. point list The list of the points that belong to a point group. point marker See point symbol. point of curvature The point where an arc is drawn from a tangent. point of intersection The point where two tangents meet on a horizontal alignment. Curves and spirals also have points of intersection, which indicate where the tangents would meet if they were extended outward. point of tangency The point where a curve meets a tangent. point of vertical intersection In a profile, the point where two tangent lines meet. point symbol A point location marker. When you add points to a drawing, point symbols are created to represent the points. The point style referenced by a point describes how the point symbol is drawn. polyface A 3-dimensional (polygon) mesh object. Each face is capable of having numerous vertices. profile An object that contains elevation data along a horizontal alignment or other line. There are two main types of profiles: surface and layout. Profile data objects can be viewed within a profile view object. profile grade line See layout profile. profile view An object that manages the graphic display of profile data objects within a drawing. A profile view is essentially a graph with two primary axes: the X-axis represents horizontal distance along the referenced horizontal
162 | Glossary
alignment (or other linear feature). The Y-axis represents elevations. Profile view objects can also include grid display components and data bands. project object An object that has been added to a project. See also drawing object. projection lines In a grading, the lines that designate face edges within a region for break points on the base line or the target line, and for the facets of curves (corner cleanup, vertical curves). properties The settings that apply to a particular instance of an object. property fields The placeholders in labels that contain content, such as text or graphics, along with format modifiers unique to specific features. Property fields can be named and their values defined according to the feature with which they are associated. See also modifier. Prospector tab The part of Toolspace where you access drawing and project objects. Objects are arranged in a tree or hierarchy with folders and subfolders that you navigate through in standard, Windows-Explorer fashion. See also Settings tab. proximity breakline A breakline that is drawn as a polyline without snapping to points in the drawing. The northing, easting, and elevation of the breakline vertices are determined from the nearest point contained in the surface point data, after generating the surface. PT See point of tangency. PVI See point of vertical intersection. quadrant One of the sections resulting from dividing a circle into four equal parts. Quadrant 1 is the NE corner, and quadrants 2, 3, and 4 proceed clockwise around the compass. Bearings are usually referenced by quadrant number. quantity takeoff The analysis of detailed cut and fill requirements along an alignment. A quantity takeoff report provides information on the total volume of material required to create a finished grade surface, including the process of cutting existing ground and refilling it with a different material, such as coarse gravel. radians A system of measure in which 2 pi radians equals 360°. raw description The original description of a point, before description key matching takes place. Often corresponds to the point description entered in the field by a surveyor.
Glossary | 163
raw station A station value on an alignment, either formatted or unformatted, that does not take into account any station equations applied to the alignment. region (grading) The area where grading criteria is applied to a lot line or a feature line. region lines The projection lines that designate the start and end of the grading regions (criteria or transition) by connecting the base line to the target line. right of way The allowable work area for an alignment. Property lines of the property owners who reside adjacent to the construction site generally specify these limits, which are called right-of-way lines. right-of-way parcel A parcel that is created from an alignment that crosses the original parent parcel. ROW See right of way. sag curve In a profile, a vertical curve at the bottom of a valley or similar location where the grade leading into the curve is less than the grade leading out of the curve. In a sag curve, the point of vertical intersection (PVI) for the tangents is below the curve. See also crest curve. sample The process of obtaining elevation information from an existing terrain model or surface. sample line A line that typically cuts across an alignment, and that can be used for creating cross sections. SC See spiral to curve. SDTS See Spatial Data Transfer Standard. section An object that contains elevation data along a sample line. settings A collection of properties and styles that apply to an object. Settings tab The part of Toolspace where you access the styles for the different types of objects, including object labels and tables. See also Prospector tab. shortcut menu A menu that is displayed when you select an object and then right-click. Shortcut menus are context-sensitive. Only commands that are relative to the object that you selected are displayed. simple spiral A spiral where the large radius end has an infinite radius and the small radius end has a finite radius, therefore providing a smooth transition from a tangent (infinite radius end) to a curve (finite radius end). See also clothoid spiral, compound spiral.
164 | Glossary
site A collection of objects that are managed via a common topology. The objects that participate in the topology are parcels, alignments, and grading. See also topology. slope A method of reporting surface inclination as a ratio that expresses the horizontal distance in which the elevation changes by one linear unit. For example, if the ground rises 3 units over a horizontal distance of 15 linear units (meters or feet), the slope is 5:1 (5 to 1). See also grade. slope projection The method of grading to a target that is either Slope (H:V value) or Grade (percentage value). Spatial Data Transfer Standard (SDTS) A file format designed as a mechanism for the transfer of spatial data between various computer systems. The SDTS format is designed to transfer data with complete content transfer (no loss of information). spiral See clothoid spiral, compound spiral, simple spiral. spiral to curve A point where a spiral meets a curve. spiral to tangent A point where a spiral meets a tangent. spot elevation The elevation of a single point in the drawing. Used when generating a TIN using contour information to define areas that are sparse in contour data. Areas that may also need spot elevations are the top of hills, valleys, and bottom of swales. ST See spiral to tangent. stacked text When a label is dragged from its point of origin, label text can be re-arranged by specifying settings for text justification, text height, and relationship to borders. standard breakline A breakline defined from selecting consecutive points or point numbers, or selected 3D polyline or 3D line objects. station A distance along a horizontal alignment. station equation A point on an alignment that defines a change in the station values after that point. stationing The labeling that provides a reference when talking about a specific point along the reference base line. stopping sight distance The distance required to safely stop a vehicle, traveling at design speed, to avoid a collision with any other non-moving objects obstructing the travel path.
Glossary | 165
stratum The difference between two surfaces that exist in a drawing, usually the existing ground surface and a finished ground surface, which is used for calculating volumes. structure A pipe network object that represents a specific engineering function in the design, such as a manhole, catch basin, or headwall. style A logical collection of settings that applies to a class of objects (surface, alignment, and so on). Styles simplify the process of applying settings by simply referencing a style. Modifying a style affects all the objects referencing that style. subassembly An individual segment or portion of a physical corridor design. Examples of subassemblies include lanes, curbs, and shoulders. subdivision An unimproved tract of land surveyed and divided into parcels for purposes of sales. surface A network of elevation data (either TIN or Grid). The points of a surface are connected into either triangles or a grid, which are then used to interpolate contours, and to generate profiles and cross-sections. A surface represents the ground condition at a particular time or event. surface border See border (surface). surface boundary See boundary (surface). surface distance The distance between two points, measured along the ground surface. On a sloped surface, the distance between two points can also be measured as a horizontal distance and a vertical distance. surface profile A profile object that represents existing ground elevations along a horizontal alignment or other linear feature that supports profile views. Typically, this data is derived from an existing surface or data file, and consists of a series of connected vertical tangent lines without vertical curves defined. Vertical curves can be added if required. surface smoothing A process that interpolates and extrapolates surface data to derive additional elevation values. Kriging and Natural Neighbor Interpolation (NNI) are the two methods of surface smoothing. Survey tab The tab in Toolspace where you access and manage survey settings, survey-related databases, and survey project data. tangent A straight line segment that forms part of a horizontal alignment or profile. Tangent distances are measured as the horizontal distance between the two end points.
166 | Glossary
target The element of grading design criteria that determines what the grading is going to intercept. A target can be a surface, absolute elevation, relative elevation, or distance. target line In a grading, the target line is either the resulting geometry created by applying grading criteria to a base line, or a lot line that was selected as the target. See also grading face, grading target. template A collection of default settings and styles used to create a drawing. terminators Graphics, such as arrowheads, ticks, or crow’s feet, that are displayed at the end of lines, arcs, or spirals. tick A component of a label that is usually a mark (or short line) inserted in a series at perpendicular angles to another object, such as a line or curve. TIN surface Triangular Irregular Network. A TIN is the most common method of interpolating elevation data. The points are connected into triangles that are used to interpolate for contours, and to generate profiles and cross-sections. The lines that make up the surface triangulation are called TIN lines. See also 3D face. TIN volume surface A differential surface created from a composite of points based on base and comparison surface. Also known as a differential surface. Toolspace A window that provides an object-oriented view of your engineering projects. Toolspace is divided into four parts or tabs: Prospector tab, Settings tab, Survey tab, and Toolbox tab. topography The features of the actual surface of the Earth. topology A set of geometric connections between objects. Objects linked by topology maintain their relationships with one another. In AutoCAD Civil 3D, objects that share the same topology are grouped together in a site. See also site. transition region An area of a grading that blends the control regions on either side of the grading. A transition region has no design criteria assigned to it. transparent command A command that can be run while another command is in progress. Transparent commands begin with an apostrophe (‘). triangle area The 2-dimensional (2D) area of a triangle face computed from the northing and easting of each triangle point. The total triangle area is the sum of all 2D triangle areas with the surface boundary(s).
Glossary | 167
trim (surface) The process of removing unwanted TIN lines from a surface, thereby removing triangles. vault A database managed by Autodesk Vault. vertical alignment See profile. vertical curve A curve used on a profile (most commonly on layout profiles) to provide a gradual change in slope from one tangent to the other. There are three types of vertical curve: parabolic, circular, and asymmetrical. vertical exaggeration An increase of vertical scale relative to horizontal scale, used to make grade changes easier to differentiate. See also vertical scale. vertical scale The scale that is compared to the horizontal scale to calculate the vertical exaggeration in profiles and cross sections. It does not actually change the scale that is used when the drawing is plotted. See also vertical exaggeration. void region An area along a base line where grading has not been applied, creating a gap in the grading. volume surface A surface that is created by calculating volumes using the grid (differential) or TIN (composite) methods. The surface is created from the two surfaces that make up the stratum. The elevation values of a volume surface are actually the difference between the two surfaces. For example, at point 1000,1000, the bottom surface has an elevation of 100, and the top surface has an elevation of 150. The elevation of point 1000,1000 on the volume surface is the difference between the two surfaces, which is 50. wall breakline A breakline that represents surface features, such as retaining walls, curbs, bridge abutments, and so on. watershed The catchment area for rainfall that is delineated as the drainage area producing runoff. Base flow in a stream also usually comes from the same area. weeding The removal of points along a selected polyline representing a contour. The weeding factors determine the amount of points removed. You can use weeding to reduce the amount of point information taken from the contours that may not be necessary to generate an accurate surface. See also weeding factors. weeding factors The settings used to reduce redundant points along the contours by ignoring contour vertices that are close together or along a straight line. A larger distance and deflection angle will weed a greater number of points. See also weeding.
168 | Glossary
Index A alignments 26, 67–68, 99, 106, 110 and profiles 106 and sections 110 concepts for 99 create (exercise) 68 editing with grips 26 LiveView exercise 67 alignments, horizontal 99 analysis, of surface 86 angle, of labels 45 appearance 39, 45 of labels 45 of objects 39 assemblies 122 asymmetric parabolic curves 106 AutoCAD Civil 3D 1–2, 6, 21, 25, 81 editing methods 25 exercises with 81 highlights of 2 installation of 1 introduction to 1 learning 6 menus in 21 sample data 1 AutoCAD properties 29
B base line, grading 90 Basic style 41 best practices 5 sample data location 5 boundaries, definition of 86 boundary lines, parcels 94 breaklines, definition of 86
C CAD manager, and AutoCAD Civil 3D 39 center line, for sections 110 child label style, creating 57 child override, explanation of 55 circular curves 106 collections 25, 33, 41 introduction to 33 item view of contents 25 of styles 41 commands 24–25, 55 from layout tools 25 from shortcut menus 24 settings for 55 compliance, with standards 39, 61 components 43, 51, 91, 95, 99 of a grading object 91 of alignments 99 of an object 51 of labels 43 of parcels 95 concepts 6, 43, 81, 86, 90, 94, 99, 106, 110, 117, 122, 126, 131, 138, 143 alignments 99 corridors 122 feature-specific 81 grading 90 label objects 143 learning 6 parcels 94 pipe networks 117 points 81 profiles 106 sections 110 styles 43, 131 surfaces 86 survey 126 visualization 138
Index | 169
constraints, for alignments 99 copying styles to another drawing corridors 122, 124 concepts for 122 exercise 124 criteria, grading 90 cross sections 110 curves 99, 106, 109 editing (exercise) 109 in alignment 99 in profiles 106
39
D data bands 106, 110 for profiles 106 for section views 110 data flow between objects 13 data shortcuts 75 database, points 81 defaults 41, 55, 67 basic style 41 for drawing settings 55 for layers 67 definition list, for surfaces 86 definitions of terms 153 dependencies between objects 12 deployment, network 1–2 description keys 81 design standards 61 dialog boxes 25, 41, 43, 51, 82, 85, 88 Create Points 82 Label Style Composer 43 Layer Properties Manager 51 Layout Tools 25 Properties 85 Style Editor 41, 51 Style Editor (exercise) 88 differential surfaces 86 display management 39, 51 and layers 51 and styles 39 Display tab, using (exercise) 89 documentation 6 list of 6 drag-and-drop styles 39
170 | Index
drainage analysis, surface 86 drawing settings 55, 67 editing (exercise) 67 introduction to 55 drawing templates 6 drawings 55, 61, 81 and point groups 81 creation, consistency in 61 for exercises 81 presentation, consistency of 61 settings for 55 dwt files 41 dynamic updates 11
E editing
25–28, 42, 84, 92, 99, 106, 120, 124, 129, 134, 136 alignments 99 consistency of methods 25 corridors 124 grading 92 of styles 42 pipe networks 120 profiles 106 properties (exercise) 84 properties of objects 28 styles 134, 136 survey data 129 using grips 26 with item view 25 with Panorama window 27 elevation analysis, illustration of 86 exercises 6, 57, 67, 77, 81, 84, 88, 92, 96, 108, 112, 115, 120, 124, 129, 134, 136, 140, 146 alignments 67 corridors 124 create a child label style 57 creating a data shortcut 77 files for 81 grading 92 managing label objects 146 mass haul 115 parcels 96 pipe networks 120
points 84 profiles 108 purpose of 6 sections 112 styles 134, 136 surfaces 88 survey 129 visualization 140 expanding folders 16 external references (Xrefs)
H hatch pattern, for parcels 94 Help system 7 introduction to 7 search for words 7 hierarchy 16, 94 of objects 16 of site and parcels 94 horizontal alignments 99 HTML Help 7
74
F face, grading 90 feature line, grading 90 features 7, 21, 55, 81 concepts for 81 learning about 7 menus for 21 settings for 55 folders 16, 69 and project management in Toolspace 16
I
69
G Getting Started Guide 5–6 description of 6 sample data location 5 grading 90, 92 concepts for 90 criteria 90 exercise 92 volume tools 90 grading group 90 graph 110 for section views 110 graphical view of objects 25 grid surfaces 86 grip editing 26, 99, 106, 108 introduction to 26 of alignment (exercise) 108 of alignments 99 profiles 106
icons 84, 88 for point groups 84 for styles 88 importing 81 points 81 installation 1, 5 of sample data 5 overview 1 Installation wizard 1 intelligent objects 39 interface 15 ease of use emphasis 15 overview 15 item view 25, 84, 89 as editing method 25 displaying (exercise) 84 Style column 89
L label objects 143 label sets 43, 110 for sections 110 introduction to 43 Label Style Composer 34 labels 33, 43, 45, 81, 94, 110 angle of 45 appearance of 45 components of 43 customizing 43 for parcel area and segments for points 81
94
Index | 171
for sections 110 introduction to 33 label styles 43 location of 45 plan readability 45 preview window 33 rotating 45 Layer Properties Manager 51, 108 using (exercise) 108 layers 51, 67, 81 and styles 51 for imported points 81 properties of 51 specifying (exercise) 67 layout profile 107 layout tools, dialog boxes for 25 layout tools, parcel 94 learning AutoCAD Civil 3D 6 lines, projection 90 list view of objects 25 LiveView exercises 67 alignments 67 location, of labels 45 lot lines, for grading 90
M masks, surface 86 mass haul diagram 115 exercise 115 match lines 150 creating with view frames menus 21, 23–24 annotation 23 comparison between 21 consistency of 21 shortcut 24 merging parcels 94
N navigation, of objects 16 network 2, 69 and project files 69 installation on a 2
172 | Index
150
O object model 11–12 concept of 11 illustration of 12 Object Viewer 92, 122 object-oriented 16, 39 intelligent objects 39 view of projects 16 objects 13, 16, 18, 21, 24–26, 28, 33, 39, 41, 43, 51 and Settings tab 18 and Toolspace 16 dependencies 13 display of 51 display of, using styles 39 editing methods 25 grip editing 26 hierarchy 16 item view of 25 labeling of 43 layout tools 25 properties of 28 right-clicking 24 styles for 41 styles, introduction to 33 workflow for 21 official copies, of project files 69 overrides 51, 55, 81 display properties 51 explanation of 55 for point groups 81 for settings 55
P Panorama window, editing with parabolic curves 106 parcels 94, 96 concepts for 94 exercise 96 styles for 94 phases of a project 39 phrase, finding in Help 7 pipe networks 117, 120 concepts for 117
27
design rules 117 exercises 120 structures 117 PIs, alignment 99 plan production 150 view frames, creating 150 plan readability, for labels 45 plotting sections 110 point groups 81, 84 concepts 81 icons for 84 point-label styles 83 points 81, 84 concepts for 81 exercise 84 styles for 81 polylines 90, 94, 99 convert to alignments 99 convert to feature lines 90 convert to parcels 94 preview, for labels 33 profile views, description of 106 profiles 106, 108 and alignments 106 automatic update 108 concepts for 106 exercise 108 types of 106 project database, for points 81 projection lines, grading 90 projection method, grading 90 projects 16, 39, 69 in Toolspace 16 management of 69 phases of 39 properties 28–29, 51, 84, 89 AutoCAD 29 changing styles 89 editing (exercise) 84 introduction to 28 of layers 51 Prospector tab 16, 24–25, 28 introduction to 16 item view 25 properties of objects 28 shortcut menus 24
R raw description 81, 85 introduction to 81 viewing (exercise) 85 rebuilding surfaces 86 relationships between objects 11 and object model 11 render materials 141 reset label location, with grip 27 revisions, of design data 11 right-click menu content 24 rotating labels 45
S sample data 1, 5–6, 81 best practices 5 for exercises 81 for Getting Started Guide 5 for tutorials 5 overview 1 provided on the product media styles and settings 6 sample lines 110 searching 7 for a word or phrase 7 section view 110 sections 110, 112 concepts for 110 exercise 112 plotting 110 segments, parcel 94 server 69, 81 and points database 81 for project files 69 settings 51, 55 display properties 51 levels of 55 overriding 55 Settings tab 18, 24, 41, 43, 55, 88 and drawing settings 55 and label styles 43 and styles 41 expanding styles (exercise) 88 shortcut menus 24
5
Index | 173
shared access 69, 81 to points database 81 to project files 69 shortcut menus 24 sites 16, 94 and parcels 94 introduction to 16 smoothing, surface 86 spirals, in alignments 99 standards 39, 61 and styles 39 compliance with 61 static profiles 106 station equations, alignment 99 Style Editor 51 styles 6, 18, 33, 39, 41, 43, 51, 81, 86, 88, 90, 94, 110, 131, 134, 136 and display management 39 and layers 51 and Settings tab 18 basic, or default 41 concepts for 131 copying to another drawing 39 creating (exercise) 88 editing method 33 exercise 134, 136 for grading 90 for labels 33, 43 for objects 41 for parcels 94 for points 81 for sample lines 110 for section views 110 for surfaces 86 introduction to 33 sample data for 6 table 33 types of 33 subassemblies 122 subdivisions, designing 94 support, technical 1 surface profile 107 surfaces 86, 88, 90, 106 analysis of 86 and profiles 106 concepts for 86
174 | Index
created from grading 90 drainage analysis 86 exercise 88 styles for 86 types of 86 survey 126, 129 concepts for 126 exercise 129 Survey tab 19–20 symbol, point 81
T table, item view 26 tables, styles for 33 target, grading 90 technical support 1 templates 5, 41 and styles 41 provided on the product media terms, definitions 153 TIN surfaces 86 Toolspace 16, 18–20, 26 introduction to 16 item view 26 Prospector tab 16 Settings tab 18 Survey tab 19–20 topology, site 16, 94 triangulation, surface 86 tutorials 5, 7 description of 7 sample data location 5
U update 13, 43, 90, 94, 110 of labels 43 of objects 13 of parcels 94 of sections 110 of surfaces 90 upside-down labels 45 usability highlights 15
5
V
W
vertical alignments 106 view frames 150 creating 150 visualization 138, 140 exercise 140 volume surfaces 86 volume tools, grading 90
watershed analysis 86 workflow 21, 61 creating, editing, and annotating 21 engineering 61 World Coordinate System, and labels 45
Z zooming (exercise)
84
Index | 175
176