Global jumping and domain-specific intersegment transfer between DNA cognate sites of the multidomain transcription factor Oct-1 Michaeleen Doucleff and G. Marius Clore† Laboratory of Chemical Physics, National Institute of Diabetes and Digestive and Kidney Diseases, National Institutes of Health, Bethesda, MD 20892-0520 Edited by Alan R. Fersht, University of Cambridge, Cambridge, United Kingdom, and approved July 17, 2008 (received for review May 27, 2008)
intermolecular translocation 兩 protein–DNA interaction 兩 15N -exchange NMR spectroscopy 兩 domain-specific kinetics 兩 2 target searching
or ⬇30 years biochemists have known that transcription factors locate their specific target sites faster than the simple three-dimensional diffusion-limited rate (1), but the details for this search process are still largely unknown. Three mechanisms are believed to facilitate the target search process (2–4): sliding, jumping, and intersegmental transfer. Sliding involves initial nonspecific binding of the protein followed by one-dimensional diffusion along the DNA. In the case of jumping, the protein dissociates from the DNA, diffuses briefly in free solution, and then reassociates a short distance along the DNA. Finally, intersegmental transfer comprises direct translocation of the protein between distant sites (separated ⬎150 bp) by binding transiently to two separate DNA fragments brought together by looping or chromosomal packing. This type of intermolecular exchange through a ‘‘bridged’’ complex is also known as ‘‘direct’’ transfer (5–7). Recent studies on sliding or jumping have provided insights into the kinetics (8, 9), structural properties (10), and relative populations (11) for these two facilitated-diffusion mechanisms. In comparison, less is known about intersegmental transfer, although recent theoretical studies predict that this mechanism significantly accelerates the target search process under conditions where the protein spends much of its time adsorbed on DNA, as is likely to be the case in vivo (5). Prior intersegmental transfer studies treated the proteins globally, obscuring mechanistic details specific to protein regions or domains (12–14). Here, we use 15Nz-exchange NMR spectroscopy (15) to charac-
F
www.pnas.org兾cgi兾doi兾10.1073兾pnas.0805050105
terize domain-specific details of intersegmental transfer for a multidomain transcription factor, namely the POU family protein, Oct-1. The POU proteins are key transcription regulators during mammalian development, and, in addition, they control many general cellular processes. For example, Oct-1 activates expression of the HoxB1 transcription factor during neural development (16) and also regulates cell growth, differentiation, and survival in many tissues throughout a human lifetime (17). POU proteins have two DNA-binding domains: the specific domain known as POUS and a homeodomain called POUHD. These two helix–turn–helix motifs are connected by a flexible linker (⬇23 aa long) (Fig. 1 A and B) and recognize specific binding sequences (red and blue lines above DNAA in Fig. 1B). Here, we present domain-specific kinetic data for protein– DNA association involving a multidomain transcription factor. The two tethered DNA-binding domains of Oct-1 translocate between high-affinity binding sites at significantly different rates. DNA-dependent data show that Oct-1 uses both jumping and intersegmental transfer mechanisms to exchange between its cognate sites. Together, these results provide evidence that intersegmental transfer involves a ternary intermediate or transition state in which the DNA-binding domains bridge two different DNA fragments simultaneously. Results and Discussion POUS Exchanges Between DNAA and DNAB Significantly Faster than POUHD. To measure how fast Oct-1 transfers between two high-
affinity sequences, we used an experimental design similar to that described by Iwahara and Clore (18). We changed 1 bp between the POUS and POUHD recognition sites in the HoxB1 promoter to create DNAA and 1 bp at the other edge of the POUHD recognition site to create DNAB (Fig. 1B). These modifications minimally affect the affinity of Oct-1 for HoxB1 DNA, but they do change the 1H–15N chemical shifts for several backbone amide groups in the Oct-1䡠DNAA and Oct1䡠DNAB complexes (referred to hereafter as complexes A and B, respectively). Oct-1 binds extremely tightly to its cognate DNA sequences with equilibrium dissociation constants Kdiss ranging from 10⫺11 to 10⫺8 M (19). Not surprisingly, the 1H–15N transverse relaxation optimized (TROSY) correlation spectrum for a 1:1 mixture of complexes A and B contains peaks from both binary complexes (Fig. 1C Left), indicating that the apparent exchange rates for Oct-1 between complexes A and B are slow compared with Author contributions: M.D. and G.M.C. designed research; M.D. performed research; M.D. and G.M.C. analyzed data; M.D. and G.M.C. wrote the paper. The authors declare no conflict of interest. This article is a PNAS Direct Submission. †To
whom correspondence should be addressed. E-mail:
[email protected].
This article contains supporting information online at www.pnas.org/cgi/content/full/ 0805050105/DCSupplemental.
PNAS 兩 September 16, 2008 兩 vol. 105 兩 no. 37 兩 13871–13876
BIOPHYSICS
At high DNA concentration, as found in the nucleus, DNA-binding proteins search for specific binding sites by hopping between separate DNA strands. Here, we use 15Nz-exchange transverse relaxation optimized NMR spectroscopy to characterize the mechanistic details of intermolecular hopping for the multidomain transcription factor, human Oct-1. Oct-1 is a member of the POU family of transcription factors and contains two helix–turn– helix DNA-binding domains, POUHD and POUS, connected by a relatively short flexible linker. The two domains were found to exchange between specific sites at significantly different rates. The cotranscription factor, Sox2, decreases the exchange rate and equilibrium dissociation constant for Oct-1 >5-fold and ⬇20-fold, respectively, by slowing the exchange rate for the POUS domain. DNAdependent exchange rates measured at physiological ionic strength indicate that the two domains use both an intersegmental transfer mechanism, which does not involve the intermediary of free protein, and a fully dissociative or jumping mechanism to translocate between cognate sites. These data represent an example of dissecting domain-specific kinetics for protein–DNA association involving a multidomain protein and provide evidence that intersegmental transfer involves a ternary intermediate, or transition state in which the DNA-binding domains bridge two different DNA fragments simultaneously.
A
C F54
POUS
+
116.7
116.7
S60 A
S60-A
S60-B
B to A
S60-A
15
15
N (ppm)
A to B N (ppm)
L67
Sox2
K106 R155
B
117.6 8.81
POUHD
127.3
PouHD
DNAB
8.70
K106-A
B to A
-CAGTGTCTTTGTCATGCTAATTCTTGCTA T TTC TA T TC 3' GAT A AAG AT A AG -GTCACAGAAACAGTACGATTAAGAAC5'
CAA A TGC AA G GC 5' -CAGTGTCTTTGTCATGCAAATGCTTG -3' GTT T ACG TT C CG 3' -GTCACAGAAACAGTACGTTTACGAAC -5'
18mer
1H (ppm)
127.3
A to B K106-A
15
DNAA 5' 3'
PouS
117.6 8.81
N15 [ppm]
Sox2
S60-B 8.70
N (ppm)
B
1H (ppm)
A to B
K106-B B to A
128.5 9.28
1H (ppm)
128.5
9.14
K106-B 9.28
1H (ppm)
9.14
26mer
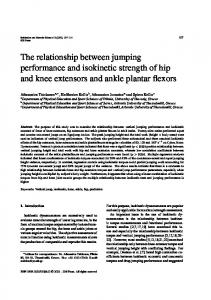
Fig. 1. Intermolecular exchange between Oct-1䡠HoxB1 DNA complexes. (A) X-ray crystal structure (Protein Data Bank ID code 1OCT) (29) of Oct-1 (POUS in red and POUHD in blue) in complex with promoter DNA. Exchange rates were determined for the five residues labeled and represented as spheres: F54, L67, and S60 in the POUS domain, and K106 and R155 in the POUHD domain. The purple mesh identifies the base pairs changed in DNAA and DNAB. (B) HoxB1 DNA fragments, DNAA and DNAB, differing by 2 bp (purple box). Solid lines above DNAA indicate the binding regions for each element of the Oct-1䡠HoxB1䡠Sox2 ternary complex (24). The 18-mer and 26-mer DNA duplexes were used for 15Nz-exchange experiments on Oct-1䡠HoxB1 and Oct-1䡠HoxB1䡠Sox2 complexes, respectively. (C) Example of exchange data for S60 of POUS (Upper) and K106 of POUHD (Lower) in the 1H–15N TROSY-based z-exchange spectrum. Example data for the Oct-1䡠HoxB1 binary and Oct-1䡠HoxB1䡠Sox2 ternary complexes are shown on the Left and Right, respectively.
app app the chemical shift time scale (kAB and kBA ⬍⬍ A ⫺ B ⬇ 300 s⫺1). If the Oct-1 domains transfer between DNAA and DNAB (or vice versa) during a z-mixing period (⬍800 ms) inserted into the pulse scheme after 15N t1 evolution, exchange cross-peaks will be visible in a 1H–15N TROSY-based 15Nz-exchange experiment (20). The z-mixing period includes an S scheme to eliminate the buildup of spurious semi-TROSY peaks (20). At low salt concentrations (10 mM phosphate buffer), no cross-peaks were detected (data not shown). At physiological salt concentrations (150 mM NaCl), however, cross-peaks are clearly apparent for residues in both the POUS and POUHD domains (Fig. 1C Left). This correlation between intermolecular exchange rate and ionic strength has been observed for both protein–DNA (10, 21) and protein–protein complexes (22). By varying the length of the z-mixing period and then fitting the cross-peak and autopeak intensities to the McConnell equations (23) describing a simple first-order exchange scheme [supporting information (SI) Fig. S1 A], we determined the app app apparent exchange rates, kAB and kBA , for five Oct-1 residues: F54, S60, and L67 in POUS; and K106 and R155 in POUHD (labeled spheres in Fig. 1 A). These were the only Oct-1 residues with at least three well dispersed, analyzable auto- and crosspeaks in the 1H–15N TROSY-based 15Nz-exchange experiment. A plot of the apparent rates for these residues vs. temperature (25, 30, and 35°C) clearly shows that the exchange rates segregate by domain (Fig. S2). At all three temperatures, the average POUS exchange rate is 1.4–1.5 times faster than the average POUHD exchange rate. A two-way ANOVA with temperature and domain as factors indicates that the domain effect is significant (with P ⫽ 0.01). At each temperature, the data for the three POUS residues fit app app and kBA rate constants, and the data well to a single set of kAB for the two POUHD residues fit well to a significantly lower set app app app and kBA rate constants. For example, at 30°C, kAB ⫽ of kAB app ⫽ 4.54 ⫾ 0.07 s⫺1 for POUS (2 per 4.26 ⫾ 0.06 s⫺1 and kBA
13872 兩 www.pnas.org兾cgi兾doi兾10.1073兾pnas.0805050105
app ⫽ 2.90 ⫾ 0.06 s⫺1 and degree of freedom ⫽ 1.12), whereas kAB app kBA ⫽ 3.06 ⫾ 0.06 s⫺1 for POUHD (2 per degree of freedom ⫽ 1.12) (Fig. 2 A and B, respectively). In contrast, fitting the data app app from both domains to global kAB and kBA yields a poor fit with 2 a value of 2.77 for per degree of freedom.
Addition of the Coactivator Sox2 Slows Exchange Rates for Both POUS and POUHD. Eukaryotic transcription factors invariably act in
concert with multiple cofactors to achieve cell-specific transcription regulation. For example, Oct-1 alone can stimulate transcription of the HoxB1 gene, but maximum transcription activity requires both Oct-1 and the cofactor Sox2 (shown in green in Fig. 1B), which increases Oct-1-directed transcriptional activation by 40% (16). To determine how cofactors affect the intermolecular transfer rates of Oct-1, we repeated the exchange experiments in the presence of Sox2 with longer DNA fragments that include the Sox2-binding site (Fig. 1B). Sox2 dramatically decreases the translocation rates for both POUS and POUHD. No cross-peaks are detectable for either domain translocating between Oct-1䡠HoxB1䡠Sox2 ternary complexes (Fig. 1C Right) under identical conditions where crosspeaks are clearly visible for transfer between Oct-1䡠HoxB1 binary complexes (Fig. 1C Left). Even at higher ionic strength and temperature (250 mM NaCl at 40°C), cross-peaks for POUS and POUHD in the ternary complexes are barely detectable at mixing times ⬎150 ms (data not shown). Consistent with this change in kinetics, Sox2 also increases the affinity of Oct-1 for the HoxB1 promoter by almost 20-fold, decreasing Kdiss from 16.3 ⫾ 0.4 nM to 0.9 ⫾ 0.2 nM (Fig. S3). The minimum exchange rate measurable by 15Nz-exchange spectroscopy depends on longitudinal relaxation time 15N-T1, with k min ⬇ 1/ 15 N-T 1 (15). With a 15 N-T 1 ⬇ 1 s for Oct1䡠HoxB1䡠Sox2 at 37°C (data not shown), we estimate the exchange rate of Oct-1 between ternary complexes to be ⬍1 s⫺1 and, therefore, at least 5-fold slower than the exchange rate between Oct-1䡠HoxB1 binary complexes. Doucleff and Clore
B
POUS
kAB = 2.90 ± 0.06 s-1 app kBA = 3.06 ± 0.06 s-1
kAB = 4.26 ± 0.08 s-1 app kBA = 4.54 ± 0.07 s-1 F54-POUS
complex A complex B A to B (and B to A)
0.6
0.2 0.1
2.0
0.3 Time (s)
0.5
0.1
0.3 Time (s)
0.5
R155-POUHD
S60-POUS Intensity
Intensity
complex A complex B A to B (and B to A)
0.6
0.2
1.2
1.2
0.4
0.4 0.1
1.0
0.3 Time (s)
0.1
0.5
C
0.3 Time (s)
-3.6
L67-POUS
0.5
POUS
A to B B to A
ln(k/T)
Intensity
K106-POUHD
1.0 Intensity
Intensity
1.0
POUHD
app
app
0.6
-4.4 -5.2
0.2
POUHD A to B B to A
-6.0 0.1
0.3 Time (s)
0.5
3.2
3.3 3.4 1/T (K-1)
Fig. 2. POUS exchanges between specific DNA binding sites significantly faster than POUHD. At each temperature, 25, 30, and 35°C (and 18°C POUHD), all data for each domain were fit simultaneously, and the apparent first-order intermolecular exchange rates were determined. Examples of the measured cross-peak (solid diamonds) and autopeak (open squares and circles) intensities at 30°C together with the best-fit curves for residues from the POUS and POUHD domains are shown in A and B, respectively. The experimental data for the cross-peaks represent the average of the data for the two symmetryrelated cross-peaks. The calculated domain-specific rate constants at 30°C are shown above the graph. (C) Erying plots of the average apparent exchange rates for POUS (red) and POUHD (blue) at 25, 30, and 35°C and for POUHD at app app 18°C. Linear fits for the exchange rates from A to B (kAB ) and from B to A (kBA ) are shown as solid lines and dotted lines, respectively; activation enthalpies and entropies derived from the data are provided in Table 1.
In the NMR structure of the Oct-1䡠HoxB1䡠Sox2 ternary complex, Sox2 contacts only the POUS domain of Oct-1 (24). This structure, combined with our exchange data, shows that Sox2 kinetically traps Oct-1 at the HoxB1 promoter by slowing the transfer between DNA-specific sites of the faster POUS domain, thereby leading to a global decrease in the exchange rate of Oct-1. These data also indicate that the intermolecular transfer for the two domains is not completely independent but partially coupled, which is expected for tethered domains that bind to DNA with a small amount of cooperativity (⌬⌬G ⫽ ⫺1.6 kcal䡠mol⫺1) (25). Activation Barrier for Intersegmental Exchange Is Enthalpic. Erying
plots of the temperature-dependent apparent exchange rates Doucleff and Clore
Table 1. Apparent activation enthalpies, entropies, and free energies for intermolecular translocation of Oct-1 between specific DNA-binding sites Transfer process POUS A to B B to A POUHD A to B B to A
⌬H‡, kcal䡠mol⫺1
T⌬S‡, kcal䡠mol⫺1
⌬G‡*, kcal䡠mol⫺1
22.6 ⫾ 2.1 22.2 ⫾ 1.5
5.6 ⫾ 2.1 5.3 ⫾ 1.5
16.9 16.9
21.4 ⫾ 1.4 21.6 ⫾ 1.1
4.3 ⫾ 1.4 4.5 ⫾ 1.1
17.1 17.1
Values were derived by least-squares fitting from the Eyring plots shown in Fig. 2C. The values given for T⌬S‡ are at a temperature of 298 K. ⌬G‡ is calculated from ⌬G‡ ⫽ ⌬H‡ ⫺ T⌬S‡ at 298 K. *The calculated error for each ⌬G‡ value is less than 0.01 kcal䡠mol⫺1.
(Fig. 2C) estimate that the activation enthalpy (⌬H‡) and activation entropy (T⌬S‡ at 30°C) for the intermolecular exchange of Oct-1 are ⬇22 and ⬇5 kcal䡠mol⫺1, respectively. Therefore, the energetic barrier for the transfer of Oct-1 between high-affinity sites is primarily enthalpic, just as found for the intermolecular exchange for the single helix–turn–helix motif HoxD9 homeodomain (⌬H‡ ⫽ 17.1 kcal䡠mol⫺1 and T⌬S‡ ⫽ 1.17 kcal䡠mol⫺1 at 30°C) (20). This finding is not surprising given that both POU domains and the HoxD9 homoedomain bind in the major groove (Fig. 1 A), which is typically associated with a negative enthalpy and a slightly positive entropy (26). Oct-1 Exchanges Between Binding Sites Using Both Jumping and Intersegmental Transfer. DNA-binding proteins can translocate
between specific sites, which are located either on two separate DNA fragments or far apart on a single piece of DNA, by using two mechanisms: (i) jumping or hopping that involves a fully dissociated protein as an intermediate (Fig. 3 Lower), and (ii) direct intersegmental transfer that involves a ternary intermediate, in which the protein binds simultaneously to two fragments of DNA (Fig. 3 Upper). Two possible ternary intermediates or transition states for Oct-1 intersegmental transfer are designated with yellow stars in Fig. 3. These mechanisms lead to different rate dependences on free DNA concentration. Under the experimental conditions used A B free ⬇ kon , [DNAA ] ⫽ [DNABfree] and koff ⬍⬍ kon[DNAfree]), the (kon app app and kBA ) through the fully dissoapparent exchange rates (kAB ciative pathway are independent of free DNA concentration and A B /2 and koff /2 for exchange from A to B and from B equal to koff to A, respectively (for a derivation of this equation, see Fig. S4). In contrast, for the intersegmental pathway, the apparent exapp app and kBA are directly proportional to the free DNA change rates kAB app app free ⫽ k*BA[DNAA ], concentration with kAB ⫽ k*AB[DNABfree] and kBA where k*AB and k*BA are second-order rate constants. The apparent exchange rates for both POUS and POUHD scale linearly with free DNA concentration (all correlation coefficients r ⬎ 0.99 in Fig. 4), indicating that Oct-1 must use the second-order intersegmental pathway to exchange between complexes A and B (Fig. 3 Upper). However, this mechanism alone does not fully account for the DNA-dependent data because exchange via the intersegmental transfer mechanism is expected to be zero in the absence of free DNA. The intercepts of the regression lines in Fig. 4 clearly do not pass through the origin, indicating a contribution from the fully dissociative mechanism (Fig. 3 Lower). A global fit to the time-dependent 15Nz-exchange data at all DNA concentrations simultaneously while optimizing domain-specific, second-order intersegment transfer rate constants together with global dissociation and association rate constants yields a 2 per degree of freedom of 0.9 (for model details, see Fig. S1B). PNAS 兩 September 16, 2008 兩 vol. 105 兩 no. 37 兩 13873
BIOPHYSICS
A
Both Intersegmental Transfer & Jumping A app free * [DNAB kAB ] + koff/2 = kAB
H
Intersegmental or Direct Transfer
H
or
S
S
B
A
B
A
* kBA
free * [DNAB kAB = kAB ] app
A
* kAB B
B
A
Jumping A app kAB = koff/2
H
koff
H
S
A
S
A
kon
kon B
koff
B
A
H S B
Fig. 3. Oct-1 exchanges between complexes A and B using two different mechanisms, intersegmental transfer and jumping. In the jumping mechanism (Lower), both POU domains fully dissociate from DNAA before binding to DNAB (and vice versa); under the experimental conditions used (see Results and Discussion and Fig. S4), the transfer rates between DNA-binding sites for the jumping mechanism are independent of DNA concentration and depend app A app B only on the global dissociation rate constants: kAB ⫽ koff /2 and kBA ⫽ koff /2 (for derivation, see Fig. S4). In the intersegmental transfer pathway (Upper), the POU domains interact simultaneously with two DNA fragments, creating two possible ternary intermediates or transition states (yellow stars); the apparent rate constants through this pathway are directly proportional to the free DNA concentrations. When both mechanisms are operative, the apparent rate conapp A app free B stant kAB ⫽ k*AB[DNABfree] ⫹ koff /2 and similarly, kBA ⫽ k*BA[DNAA ] ⫹ koff /2.
At 30°C, Oct-1 fully dissociates from DNAA with a dissociation A B ⫽ 3.73 ⫾ 0.19 s⫺1 and from DNAB with koff ⫽ rate constant koff ⫺1; Oct-1 binds to both fragments with an associ5.09 ⫾ 0.26 s A ation rate constant kon ⫽ 2.34(⫾0.12) ⫻ 108 M⫺1 s⫺1 (note, kon B and kon are assumed to be equal because the data cannot determine individual values for these two rate constants). The second-order intersegmental transfer rate constants for the POUS domain are ⬇1.6 times faster than those for the POUHD domain: kSAB * ⫽ 2.88(⫾0.10) ⫻ 104 M⫺1 s⫺1 vs. kHDAB * ⫽ * ⫽ 1.85(⫾0.08) ⫻ 104 M⫺1 s⫺1 for exchange from A to B, and kSBA * ⫽ 2.52(⫾ 0.11) ⫻ 104 M⫺1 3.92(⫾0.13) ⫻ 104 M⫺1 s⫺1 vs. kHDBA s⫺1 for exchange from B to A. Concluding Remarks. Here, we present domain-specific kinetic data for intermolecular translocation of a multidomain transcription factor between specific DNA-binding sites. Almost 25 years ago, Fried and Crothers (14) showed that the exchange rate
14
14
POUHD
A to B B to A
10
A to B B to A
10
app
kAB, kBA (s-1)
POUS
6
app
6
2
2 50
150
250
50
150
250
free [DNAfree A , DNAB ] (µM)
Fig. 4. Apparent exchange rates at five free DNA concentrations for POUS (A) app and POUHD (B). Apparent exchange rates from A to B (kAB ) and from B to A app (kBA ) are shown as filled circles and open squares, respectively. Black lines represent the theoretical rate dependence on free DNA concentration obtained by simultaneously fitting all of the data for the two domains to a model comprising the intersegmental transfer mechanism in parallel with the jumping mechanism (as shown in Fig. 3 and Fig. S1B). Purple and black arrows point A B to the y intercepts, which equal koff /2 and koff /2, respectively. 13874 兩 www.pnas.org兾cgi兾doi兾10.1073兾pnas.0805050105
for the lac repressor scaled linearly with free DNA concentration, indicating a direct intersegmental transfer mechanism. This work and a subsequent one on the glucocorticoid receptor (13) implied the existence of, but were unable to detect, different rates for specific dimeric subunits (on nonsymmetric DNAbinding sites) because only global dissociation rates could be determined by gel mobility shift assays. The 15Nz-exchange data presented here provide the means to measure distinct transfer rates for tethered domains of a transcription factor and, thus, demonstrate direct evidence for a transient intermediate in which the protein interacts specifically with two DNA fragments (Fig. 3 Upper, yellow stars). One biological function for the different intermolecular transfer rates of the POUS and POUHD domains may be to increase the efficiency of the Oct-1 target search process inside the nucleus. With a 1.5-fold faster exchange rate than POUHD, POUS could scan binding sequences on different DNA fragments, while POUHD remains in complex with a high-affinity sequence, ensuring that global Oct-1 exchange only occurs when POUS identifies another cognate binding site. The details of this search mechanism could potentially be characterized in future experiments by examining domain-specific interactions with nonspecific DNA by using paramagnetic relaxation enhancement to visualize transient interactions (10). The different exchange rates of the POU DNA-binding domains may also contribute to the fine tuning of cell- and tissue-specific transcription regulation by Oct-1. Even when Oct-1 acts in concert with other cofactors, subtle changes in the Oct-1 promoter sequence or binding affinity in vitro can have large effects on gene expression in vivo. For example, Oct-1 together with the GATA-1 protein represses transcription of the human fetal globin genes in adults (27, 28). Only a single base pair mutation at the POUHD hemisite reduces the DNA-binding affinity of Oct-1 and results in the diseased phenotype (28). In contrast, transcription activation of the HoxB1 gene by Oct-1 with Sox2 depends only on the integrity of the POUS-binding site (16). Therefore, different kinetic parameters for the POUS and POUHD domains at particular promoters may result in differential transcription activation or repression by Oct-1 cofactors, depending on whether they target the POUS domain or POUHD domain. Our data indicate that at physiological ionic strength (150 mM NaCl), Oct-1 uses both jumping (i.e., complete dissociation followed by reassociation) and intersegmental transfer (i.e., direct transfer without the intermediary of free protein) to exchange between high-affinity DNA-binding sites in vitro (Fig. 3). At a free DNA concentration of 150 M, the fully dissociative pathway accounts for ⬇25% of the apparent exchange rate for Oct-1 (Fig. 4). In contrast, jumping did not contribute significantly to the exchange rate for the single helix–turn–helix homeodomain HoxD9 (18). This difference is probably because, under the experimental conditions used, Oct-1 binds to the HoxB1 DNA promoter (Kdiss ⫽ 16.3 nM) 10 times weaker than HoxD9 binds to its cognate DNA site (Kdiss ⬍ 1.5 nM), making the dissociative pathway for Oct-1 energetically comparable with the intersegmental transfer mechanism. In support of this conclusion, the Arrhenius-like equation koff ⫽ (kBT/h) exp(⌬G‡/RT) with koff ⬇ 5 s⫺1 at 30°C predicts an activation free energy (⌬G‡) of ⬇17 kcal䡠mol⫺1 for full dissociation of Oct-1 from DNA, which is exactly the activation free energy we measured for the Oct-1 overall exchange process (Table 1). Because the data from both domains fit well to the same global A B dissociation constants (koff and koff ), the different exchange rates observed for POUS and POUHD (Fig. 2) must arise from an asymmetry in the intersegmental exchange pathway (Fig. 3 Upper). Expressed as isolated protein fragments, POUS and POUHD bind with significantly different affinities to promoter sites. For example, POUHD binds 150 times tighter than POUS Doucleff and Clore
Materials and Methods Sample Preparation of Oct1䡠DNA Complexes. The POU DNA-binding domains, POUS and POUHD, comprising residues 1–176 of human Oct-1 and the HMG box domain of human Sox2 (residues 40 –123), were expressed and purified as described in ref. 24. Oct-1 was uniformly labeled with either 15N–13C–2H (for triple resonance experiments to confirm assignments) or 15N–2H (for the 15Nz-exchange experiments). Oligonucleotides were purchased from Midland Certified Reagents or from the Yale University School of Medicine DNA Synthesis Laboratory (New Haven, CT). Single-stranded and duplex DNA fragments were purified by ion-exchange chromatography as described in ref. 18. Before mixing, Oct-1 and DNA were desalted by dialysis or gel-filtration chromatography into 10 mM phosphate buffer (pH 6.5), 1 mM EDTA, and 3 mM DTT. Sox2 was dialyzed into 10 mM phosphate buffer (pH 6.5) and 1 mM EDTA. DNA and protein concentrations were measured from the absorbance at 260 and 280 nm, respectively. Concentrations were confirmed by gel-shift assays. All NMR samples were concentrated with an Amicon ultracentrifugal concentrator (3-kDa cutoff; Millipore Corporation) in buffer containing 5% D2O, 10 mM phosphate buffer (pH 6.5), 10 mM DTT, and 1 ⫻ Complete protease inhibitor (Roche). Unless indicated otherwise, 150 mM NaCl was added to the sample immediately before data collection. For the temperature dependence study, the NMR sample contained 550 M U-[2H/15N]Oct-1, 350 mM DNAA, and 350 mM DNAB. For the DNA titration, the initial NMR sample (505 l of total) contained 766 M U-[2H/15N] Oct-1 with 1. Riggs AD, Bourgeois S, Cohn M (1970) The lac repressor– operator interaction. 3. Kinetic studies. J Mol Biol 53:401– 417. 2. Zhou HX, Szabo (2004) Enhancement of association rates by nonspecific binding to DNA and cell membranes. Phys Rev Lett 93:178101. 3. Halford SE, Szczelkun MD (2002) How to get from A to B: Strategies for analysing protein motion on DNA. Eur Biophys J 31:257–267. 4. Berg OG, von Hippel PH (1985) Diffusion-controlled macromolecular interactions. Annu Rev Biophys Biophys Chem 14:131–160. 5. Hu T, Shklovskii BI (2007) How a protein searches for its specific site on DNA: The role of intersegment transfer. Phys Rev E Stat Nonlin Soft Matter Phys 76:051909. 6. Berg OG, Winter RB, von Hippel PH (1981) Diffusion-driven mechanisms of protein translocation on nucleic acids. 1. Models and theory. Biochemistry 20:6929 – 6948. 7. von Hippel PH, Revzin A, Gross CA, Wang AC (1975) Protein–Ligand Interactions, eds Sund H, Blauer G (Walter de Gruyter, Berlin), pp 278 –288. 8. Elf J, Li GW, Xie XS (2007) Probing transcription factor dynamics at the single-molecule level in a living cell. Science 316:1191–1194.
Doucleff and Clore
450 M DNAA and 450 M DNAB. To increase the DNA concentration, we replaced 20 l of the NMR sample with 20 l of a stock solution containing 1.45 mM DNAA and 1.45 mM DNAB. For the ternary complex (Oct-1䡠HoxB1䡠Sox2), the sample contained 600 M U-[2H/15N] Oct-1, 400 M DNAA, 400 M DNAB, and 800 M Sox2.
Kdiss Measurements. Equilibrium dissociation constants (Kdiss) for Sox2 and Oct-1 at the HoxB1 promoter were obtained by following changes in fluorescence anisotropy of labeled DNA upon titration with protein as described in ref. 18. For Oct-1 and Sox2 titrations, DNA was kept at 5 nM and 1.4 nM, respectively. Sox2 binding to HoxB1 increased the anisotropy significantly more than Oct-1 binding (Fig. S3 A and B). We, therefore, determined the Kdiss for Oct-1 in the presence of Sox2 by measuring Kdiss for Sox2 in the presence of Oct-1 (Fig. S3B, filled circles). We then calculated the effect of Sox2 on the Kdiss of Oct-1 by using a thermodynamic cycle (Fig. S3C). NMR Spectroscopy. All NMR data were recorded on a Bruker DRX 800-MHz spectrometer equipped with a z-gradient triple resonance cryoprobe, at 30°C, unless specified otherwise. Data were processed with NMRPipe (33) and analyzed using CARA (www.nmr.ch) or NMRDraw (33). Backbone assignments for the Oct-1 POU domains (24) were confirmed with TROSY (34) versions of 3D HNCA, HNCO, and HN(CA)CO triple resonance experiments (35). Exchange rates were measured with a TROSY version of a 2D 15Nz-exchange 1H–15N correlation experiment incorporating an S scheme during the z-mixing period to eliminate the buildup of spurious semi-TROSY peaks (20). For exchange experiments, at least eight different mixing times between 32 ms and 500 ms were used. Fitting of Kinetic Data. All 15Nz-exchange data were fit with the program FACSIMILE (36), using an approach similar to that described in ref. 18. For the app app apparent translocation rates of individual Oct-1 residues (kAB and kBA ) autoand cross-peak intensities were fit simultaneously to differential equations describing the time dependence of the magnetizations of the auto- and app app , kBA , R1 (longitucross-peaks (Fig. S1 A) by optimizing four parameters: kAB dinal 15N relaxation rates for complexes A and B), and a scale factor SA for app app ). complex A. The scale factor SB for complex B is given by SA(kAB / kBA At each temperature in Fig. 2C, data for all of the POUS residues (and app and similarly for all of the POUHD residues) were fit to one set of apparent kAB app , but independent R1 and SA values were optimized for each residue. For kBA example, for the POUS domain at 30°C, 63 data points (27 for F54 and 18 each app app , kBA , R1F54, R1S60, R1L67, for S60 and L67) were fit by optimizing 8 parameters: kAB F54 S60 L67 , SA , and SA . SA For the DNA concentration-dependent experiments, we chose to analyze the 15N -exchange data for S60 and K106 because these residues had cross-peak and z autopeak intensities with significantly higher signal-to-noise than the other three residues at all five DNA concentrations. The 15Nz-exchange data for these two residues provide 308 time-dependent intensities for fitting to 16 parameters. The data for both domains were fit simultaneously to a model incorporating both intersegmental and jumping pathways as shown in Fig. 3. This scheme has global A B and koff , and domain specific second-order rate condissociation constants, koff S* HD* S* HD* and kBA for exchange from A to B and kBA and kBA for exchange from stants, kAB B to A (for details of the model, see Fig. S1). ACKNOWLEDGMENTS. We thank Jeong-Yong Sun for assistance with sample preparation. This work was supported by the Intramural Program of the National Institute of Diabetes and Digestive and Kidney Diseases/National Institutes of Health (NIDDK/NIH) and the AIDS Targeted Antiviral Program of the Office of the Director of the NIH (to G.M.C.). M.D was supported by a Nancy Nossal NIDDK/NIH Research Fellowship.
9. Blainey PC, van Oijen AM, Banerjee A, Verdine GL, Xie XS (2006) A base-excision DNA-repair protein finds intrahelical lesion bases by fast sliding in contact with DNA. Proc Natl Acad Sci USA 103:5752–5757. 10. Iwahara J, Clore GM (2006) Detecting transient intermediates in macromolecular binding by paramagnetic NMR. Nature 440:1227–1230. 11. Gowers DM, Wilson GG, Halford SE (2005) Measurement of the contributions of 1D and 3D pathways to the translocation of a protein along DNA. Proc Natl Acad Sci USA 102:15883–15888. 12. Iwahara J, Zweckstetter M, Clore GM (2006) NMR structural and kinetic characterization of a homeodomain diffusing and hopping on nonspecific DNA. Proc Natl Acad Sci USA 103:15062–15067. 13. Lieberman BA, Nordeen SK (1997) DNA intersegment transfer: How steroid receptors search for a target site. J Biol Chem 272:1061–1068. 14. Fried MG, Crothers DM (1984) Kinetics and mechanism in the reaction of gene regulatory proteins with DNA. J Mol Biol 172:263–282. 15. Perrin CL, Dwyer TJ (1990) Application of two-dimensional NMR to kinetics of chemical exchange. Chem Rev 90:935–967.
PNAS 兩 September 16, 2008 兩 vol. 105 兩 no. 37 兩 13875
BIOPHYSICS
to the human H2B histone promoter, which has a sequence similar to that of HoxB1 (25). Therefore, the binary Oct1䡠HoxB1 DNA complexes are probably not static structures as seen in x-ray crystal structures (29, 30) but are possibly in rapid dynamic equilibrium with hemiassociated states, in which only one domain contacts the DNA. The detached domain would then be accessible to transfer directly to free DNA via the intersegmental pathway, forming a bridged complex or transition state as shown in Fig. 3 Upper (yellow stars). An asymmetry in the population of these two ternary intermediates (Fig. 3 Upper, yellow stars) or the two possible hemidissociated states may lead to the different transfer rates observed for POUS and POUHD (Fig. 2). (Note that the kinetic scheme combining direct intersegmental transfer and jumping shown in Fig. S1B represents the simplest scheme required to account for the DNA concentration-dependent 15Nz-exchange data; the information content, however, in the time-dependent 15N -exchange data is insufficient to determine the much larger z number of unknown parameters required to describe quantitatively more complex schemes explicitly including hemiassociated states or ternary intermediates.) The intermolecular transfer mechanism presented here is likely applicable to many other important eukaryotic transcription factors that contain multiple DNA-binding domains connected by linkers, such as the Myb oncoproteins (31) and the Cys2His2 zinc finger proteins (32). All of these proteins have different linker lengths with various levels of structural order, so it will be interesting to determine how linker length and structure affect intermolecular transfer rates and mechanisms.
16. Di Rocco G, et al. (2001) The recruitment of SOX/OCT complexes and the differential activity of HOXA1 and HOXB1 modulate the Hoxb1 autoregulatory enhancer function. J Biol Chem 276:20506 –20515. 17. Andersen B, Rosenfeld MG (2001) POU domain factors in the neuroendocrine system: Lessons from developmental biology provide insights into human disease. Endocr Rev 22:2–35. 18. Iwahara J, Clore GM (2006) Direct observation of enhanced translocation of a homeodomain between DNA cognate sites by NMR exchange spectroscopy. J Am Chem Soc 128:404 – 405. 19. Verrijzer CP, et al. (1992) The DNA-binding specificity of the bipartite POU domain and its subdomains. EMBO J 11:4993–5003. 20. Sahu D, Clore GM, Iwahara J (2007) TROSY-based z-exchange spectroscopy: Application to the determination of the activation energy for intermolecular protein translocation between specific sites on different DNA molecules. J Am Chem Soc 129:13232–13237. 21. Milev S, Bosshard HR, Jelesarov I (2005) Enthalpic and entropic effects of salt and polyol osmolytes on site-specific protein-DNA association: The integrase Tn916 –DNA complex. Biochemistry 44:285–293. 22. Zhou HX (2001) Disparate ionic-strength dependencies of on and off rates in protein– protein association. Biopolymers 59:427– 433. 23. McConnell HM (1958) Reaction rates by nuclear magnetic resonance. J Chem Phys 28:430 – 431. 24. Williams DC, Jr, Cai M, Clore GM (2004) Molecular basis for synergistic transcriptional activation by Oct1 and Sox2 revealed from the solution structure of the 42-kDa Oct1䡠Sox2䡠Hoxb1–DNA ternary transcription factor complex. J Biol Chem 279:1449 –1457. 25. Klemm JD, Pabo CO (1996) Oct-1 POU domain–DNA interactions: Cooperative binding of isolated subdomains and effects of covalent linkage. Genes Dev 10:27–36. 26. Privalov PL, et al. (2007) What drives proteins into the major or minor grooves of DNA? J Mol Biol 365:1–9.
13876 兩 www.pnas.org兾cgi兾doi兾10.1073兾pnas.0805050105
27. Gumucio DL, et al. (1988) Nuclear proteins that bind the human ␥-globin gene promoter: Alterations in binding produced by point mutations associated with hereditary persistence of fetal hemoglobin. Mol Cell Biol 8:5310 –5322. 28. Liu LR, et al. (2005) T to C substitution at ⫺175 or ⫺173 of the ␥-globin promoter affects GATA-1 and Oct-1 binding in vitro differently but can independently reproduce the hereditary persistence of fetal hemoglobin phenotype in transgenic mice. J Biol Chem 280:7452–7459. 29. Klemm JD, Rould MA, Aurora R, Herr W, Pabo CO (1994) Crystal structure of the Oct-1 POU domain bound to an octamer site: DNA recognition with tethered DNA-binding modules. Cell 77:21–32. 30. Remenyi A, et al. (2003) Crystal structure of a POU/HMG/DNA ternary complex suggests differential assembly of Oct4 and Sox2 on two enhancers. Genes Dev 17:2048 –2059. 31. Oh IH, Reddy EP (1999) The myb gene family in cell growth, differentiation, and apoptosis. Oncogene 18:3017–3033. 32. Wolfe SA, Nekludova L, Pabo CO (2000) DNA recognition by Cys2His2 zinc finger proteins. Annu Rev Biophys Biomol Struct 29:183–212. 33. Delaglio F, et al. (1995) NMRPipe: A multidimensional spectral processing system based on UNIX pipes. J Biomol NMR 6:277–293. 34. Salzmann M, Pervushin K, Wider G, Senn H, Wuthrich K (1998) TROSY in tripleresonance experiments: New perspectives for sequential NMR assignment of large proteins. Proc Natl Acad Sci USA 95:13585–13590. 35. Clore GM, Gronenborn AM (1991) Structures of larger proteins in solution: Three- and four-dimensional heteronuclear NMR spectroscopy. Science 252:1390 –1399. 36. Chance EM, Curtis AR, Jones IP, Kirby CR (1979) FACSIMILE: A computer program for flow and chemistry simulation and general initial value problems (Harwell, HM Stationery Office, London), Atomic Energy Research Establishment Rep R8775.
Doucleff and Clore