Atmos. Chem. Phys., 10, 9505–9519, 2010 www.atmos-chem-phys.net/10/9505/2010/ doi:10.5194/acp-10-9505-2010 © Author(s) 2010. CC Attribution 3.0 License.
Atmospheric Chemistry and Physics
GOMOS data characterisation and error estimation J. Tamminen1 , E. Kyr¨ol¨a1 , V. F. Sofieva1 , M. Laine1 , J.-L. Bertaux2 , A. Hauchecorne2 , F. Dalaudier2 , D. Fussen3 , F. Vanhellemont3 , O. Fanton-d’Andon4 , G. Barrot4 , A. Mangin4 , M. Guirlet4 , L. Blanot4 , T. Fehr5 , L. Saavedra de Miguel5 , and R. Fraisse6 1 Finnish
Meteorological Institute, Earth Observation, Helsinki, Finland UVSQ, CNRS-INSU, Paris, France 3 BIRA-IASB, Brussels, Belgium 4 ACRI ST, Sophia Antipolis, France 5 ESA-ESRIN, Italy 6 EADS-Astrium, Toulouse, France 2 LATMOS/IPSL,
Received: 31 January 2010 – Published in Atmos. Chem. Phys. Discuss.: 11 March 2010 Revised: 7 September 2010 – Accepted: 23 September 2010 – Published: 8 October 2010
Abstract. The Global Ozone Monitoring by Occultation of Stars (GOMOS) instrument uses stellar occultation technique for monitoring ozone, other trace gases and aerosols in the stratosphere and mesosphere. The self-calibrating measurement principle of GOMOS together with a relatively simple data retrieval where only minimal use of a priori data is required provides excellent possibilities for long-term monitoring of atmospheric composition. GOMOS uses about 180 of the brightest stars as its light source. Depending on the individual spectral characteristics of the stars, the signal-to-noise ratio of GOMOS varies from star to star, resulting also in varying accuracy of retrieved profiles. We present here an overview of the GOMOS data characterisation and error estimation, including modeling errors, for O3 , NO2 , NO3 and aerosol profiles. The retrieval error (precision) of night-time measurements in the stratosphere is typically 0.5–4% for ozone, about 10–20% for NO2 , 20–40% for NO3 and 2–50% for aerosols. Mesospheric O3 , up to 100 km, can be measured with 2–10% precision. The main sources of the modeling error are incompletely corrected scintillation, inaccurate aerosol modeling, uncertainties in cross sections of trace gases and in atmospheric temperature. The sampling resolution of GOMOS varies depending on the measurement geometry. In the data inversion a Tikhonov-type regularization with predefined target resolution requirement is applied leading to 2– 3 km vertical resolution for ozone and 4 km resolution for other trace gases and aerosols.
Correspondence to: J. Tamminen (
[email protected])
1
Introduction
Vertical profiles of stratospheric constituents have been measured using satellite instruments since 1979 when SAGE I (Stratospheric Aerosol and Gas Experiment I), the first instrument of the successful SAGE family, started its measurements. The solar occultation technique used by the SAGE instruments has turned out to be a reliable way of studying the atmospheric composition. Several instruments, in addition to the SAGE series, have utilised the same technique at various wavelength regions including ATMOS, SAM II, HALOE, POAM series, ACE-mission and SCIAMACHY. The success story of the solar occultation technique still continues and the recently launched solar occultation instrument SOFIE (Solar occultation for Ice Experiment) on board AIM satellite is targeted for studying the mesospheric composition. In addition to the Sun, stars can also be used as light sources when studying the composition of the atmosphere. This was theoretically demonstrated by Hays and Roble (1968) and later also shown to work in practice. In 1996 US launched the MSX satellite with the UVISI instrument, which performed several stellar occultation measurements and demonstrated the potential of the technique to study globally the atmospheric composition and temperature (Yee et al., 2002; Vervack et al., 2003). For a more comprehensive summary of the occultation instruments see Bertaux et al. (2010). The first instrument specifically developed for studying the composition of the atmosphere by using the stellar occultation technique is European Space Agency’s GOMOS (Global Ozone Monitoring by Occultation of Stars) instrument on-board the Envisat satellite, launched in 1 March 2002 (Bertaux et al., 2004; Kyr¨ol¨a et al., 2004; Bertaux et al.,
Published by Copernicus Publications on behalf of the European Geosciences Union.
9506
J. Tamminen et al.: GOMOS data characterisation Signals: satellite orbit
4
4
x 10
3 2 1 0 4
z
300 4 x 10
400
500
600
300
400
500
600
400
500
600
3 2 1
Earth radius
0
=> Transmission: 1
z
0
z
300
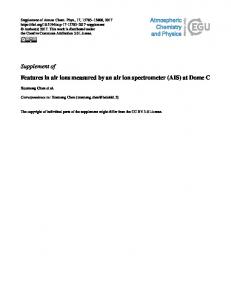
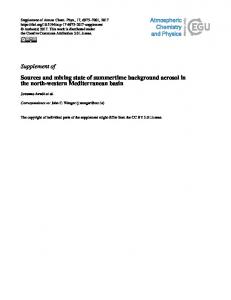
Fig. 1. The stellar occultation measurement principle of GOMOS. The horizontal transmission of the atmosphere is obtained by dividing the attenuated stellar spectrum with the reference spectrum measured above the atmosphere.
2010). GOMOS is an ultraviolet-visible spectrometer that covers wavelengths from 250 nm to 675 nm with 1.2 nm resolution. It has also two infrared channels at 756–773 nm and 926–952 nm with 0.2 nm resolution. Two photometers that are located at blue (473–527 nm) and red (646–698 nm) measure the stellar flux through the atmosphere at a sampling frequency of 1 kHz. By August 2009 GOMOS had observed about 668 000 stellar occultations. An overview of the GOMOS instrument and highlights of the measurements are given in Bertaux et al. (2010) The stellar occultation technique shares the main advantages of the solar occultation technique that include the selfcalibrated measurement principle (see Fig. 1), relatively simple inverse problem, and high vertical resolution. In addition, the stellar occultation technique benefits from the multitude of the stars to obtain a good global and temporal coverage. Compared to the Sun, stars are point-like sources, and thus provide an excellent pointing information. The disadvantage compared to the solar occultation is the low signal-to-noise ratio. GOMOS is following about 180 different stars while they are descending behind the Earth limb. Since the stars differ both in brightness (magnitude) and in the spectrum of the light (originating from stellar properties and surface temperature) also data characteristics measured by GOMOS vary strongly. The signal-to-noise ratio varies significantly from star to star. In this respect, one might even consider GOMOS being a remote sensing mission that consists of 180 different instruments each having its own data characteristics. The importance of the data characterisation and the error estimation is nowadays widely recognized (see e.g., Rodgers, 2000). The further utilisation of the remote sensing data, e.g., in the assimilation or in constructing time series, depends crucially on a proper error characterisation. The purpose of this paper is to characterise the quality of the GOMOS nighttime measurements. Both systematic errors and random errors are considered. The results shown here are based on estimating the impact of various assumptions that are made Atmos. Chem. Phys., 10, 9505–9519, 2010
in the GOMOS data processing. The GOMOS Level 1b and Level 2 data processing are described in detail in Kyr¨ol¨a et al. (2010). A review of the geophysical validation of GOMOS data products is included in Bertaux et al. (2010). In this paper, we characterise O3 , NO2 , NO3 and aerosol profiles that are retrieved from GOMOS UV-VIS spectrometer data at the altitude range 10–100 km during the nighttime. Only dark limb (night) occultations, i.e., occultations with solar zenith angle larger than 107 deg, are considered. The bright limb occultations (i.e., made during day time) are not considered here since the data quality in these measurements is much poorer due to the strong contribution from scattered solar light. The error characterisation, which we describe here, corresponds to official GOMOS processor IPF Version 6 data that will be available in spring 2011. Most of the results are also valid for IPF Version 5 data which is presently available. In addition, we have tried to indicate, when necessary, the difference in IPF Version 5 and 6 data. General features of GOMOS measurements are given in Sect. 2. The propagation of the random measurement error through the retrieval steps is discussed in Sect. 3. The contribution of various modelling errors are discussed in Sect. 4. The vertical resolution is discussed in Sect. 5. In Sect. 6 we give examples of the GOMOS error estimates and discuss the valid altitude range of the profiles. Finally, we summarize the most important sources of random and systematic errors in Sect. 7.
2
2.1
GOMOS spectral measurements and their characteristics Signal-to-noise ratio
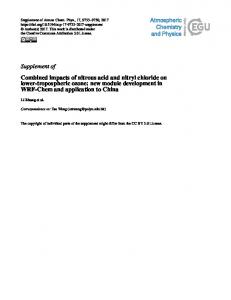
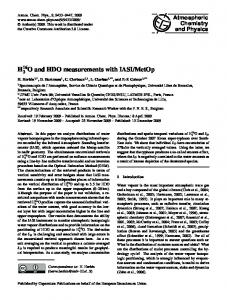
GOMOS measures stellar light through the atmosphere as the stars set behind the Earth limb. However, stars are not similar and this has an impact on GOMOS results as well. The most significant characteristic is that the accuracy of the retrieved parameters depends strongly on stellar properties.The measured stellar signals and further the transmission spectra, which are used as the data in the GOMOS retrievals, vary strongly with the stellar brightness and temperature. This is illustrated in Fig. 2, where examples of the GOMOS transmission spectra at different altitudes (10–70 km) are shown for different stars (bright and cool, bright and hot, dim and cool and dim and hot). We observe clearly that the transmission spectra of dim stars are much noisier compared to bright stars. In addition, the stellar temperature has an impact: hot stars have the maximum intensity of the radiation at UV wavelengths whereas cool stars have the maximum at the VIS wavelengths and the UV part is very noisy. In Fig. 3 the GOMOS signal-to-noise ratio (SNR, defined as transmission divided by estimated noise) at 3 different wavelength regions (UV and 2 visible) are shown in three cases: Sirius (the brightest star, star number 1 in the GOMOS www.atmos-chem-phys.net/10/9505/2010/
J. Tamminen et al.: GOMOS data characterisation
9507
STAR 1
1
Transmission
Transmission
STAR 3
0.5
0 300
400
500
1
0.5
0
600
300
1
0.5
0 300
400
500
400
500
600
Wavelength (nm) STAR 147 Transmission
Transmission
Wavelength (nm) STAR 117 1
0.5
600
0 300
Wavelength (nm)
400
500
600
Wavelength (nm)
Fig. 2. Examples of GOMOS transmissions (corrected for refractive effects) measured using different stars. Top row on left: bright and cool star (Mv =−0.05, T =43 00 K) , on right: bright and hot star (Mv =−1.44, T =11 000 K). Bottom row, on left: dim and cool star (Mv =2.7, T =3800 K), on right: dim and hot star (Mv =2.88, T =26 000 K). Five lines correspond to altitudes 10 km (black), 20 km (red), 30 km (green), 50 km (cyan) and 70 km (magenta).
star catalogue with magnitude Mv = −1.44 and temperature T =11 000 K), a bright and a cool star (star number 4, Mv = −0.01, T =5800 K) and a dim and a cool star (star number 117, Mv =2.7, T =3800 K). In the retrieval it is important to have a sufficient SNR in spectral regions where constituents absorb or scatter light. These regions depend on constituent. For retrieving ozone at high altitudes, above 40 km, the Hartley band (248–310 nm) is crucial and at this altitude region the hot stars provide significantly better results than the cool stars. The average SNR of GOMOS at UV around 50 km using Sirius is 130–160 whereas using cool stars (T