Ecological Monographs, 69(3), 1999, pp. 353–374 q 1999 by the Ecological Society of America
GRADIENTS IN THE COMPOSITION, STRUCTURE, AND DIVERSITY OF REMNANT OAK SAVANNAS IN SOUTHERN WISCONSIN MARK K. LEACH1
AND
THOMAS J. GIVNISH2
Department of Botany, University of Wisconsin, Madison, Wisconsin 53706 USA
Abstract. Savannas with scattered oak canopies, once the most widespread communities in southern Wisconsin, now are among the most endangered. Surprisingly little is known about the composition, structure, and horizontal patterning of their species-rich ground layers. This study relates the distribution and ecological characteristics of 417 ground-layer species to local and regional gradients in soil composition and light regime, based on an analysis of 722 1-m2 quadrats in 12 remnant savannas. Our findings have important implications for efforts to restore/conserve midwestern oak savannas. Ground-layer composition was strongly related to among-site differences in soil texture and within-site differences in light availability, with variation in sand vs. silt content accounting for twice as much turnover in species composition as that accounted for by direct photon flux density (PFD) estimated from hemispherical photographs. Most species reached peak coverage under sunny or partly shaded conditions. Flowering/fruiting was often skewed toward sunnier microsites. Absolute forb cover increased with silt content and declined with PFD. Graminoid cover showed a curvilinear relationship to soil texture and light, being highest in well-lit, moderately sandy microsites. Total ground-layer cover increased with silt content at a given irradiance; it increased with PFD on silty sites and decreased with PFD on sandy sites. Forb cover increased regularly with PFD and sand content. When quadrats were stratified by sand content and PFD, species richness of forbs and graminoids increased linearly with coverage by each group, with far more forb species present at a given coverage. Among graminoids, C4 grasses were common only in bright, sandy microsites; C3 grasses and sedges had broader ecological distributions. Among forbs, leaf width increased and leaf inclination became more horizontal toward shadier and siltier microsites; tall herbs were generally found in silty areas with dense ground-layer cover. Plants with N-fixing symbioses were found mostly on sandy, well-lit microsites, although climbing species occured on shadier and/ or siltier microsites, where N-fixation might be expected to be less advantageous. Most groundlayer species were perennial (88%), with few annuals (6%) or biennials (6%). For the 85 most common species, breadth of distribution across savanna microhabitats (4 soil 3 4 light) was significantly correlated with presence across 34 Wisconsin community types, suggesting that similar factors help to constrain distributions at local and regional scales. Species in the two largest genera (Aster and Solidago) differed significantly in distribution according to the Syrjala test, supporting habitat partitioning as a mechanism of coexistence. Oak savannas are unusually diverse. At small spatial scales, there were 16.1 6 1.3 species/m2 (mean 6 1 SD), compared with 11.4 6 2.7 for prairies and 8.2 6 2.5 for forests. At slightly larger scales, savannas showed high spatial turnover in ground-layer composition: 89.3 6 12.0 species/20 m2, compared with 41.5 6 8.3 for prairies and 42.8 6 8.0 for forests. At large spatial scales, a survey of 22 savanna remnants (42 ha) showed extensive floristic differentiation: 507 native plant species, ;27% of Wisconsin’s indigenous vascular flora (;14 3 106 ha). Contrary to previous reports, Midwest oak savannas are forb dominated, except on the sandiest or sunniest microsites. Release of forbs from competition with C4 grasses under partly shaded conditions may help to account for the high diversity of savanna ground layers relative to prairies. Divergent distributions of plants with different adaptations for energy capture, together with large variation within sites in ground-layer light regime and among sites in soil texture, suggest that partitioning of light and soil gradients is important for maintaining the high plant diversity of oak savannas. Mass effects (involving dispersal subsidies from favorable microsites) may also play a role in maintaining diversity within these mosaic communities. Key words: Aster; beta diversity; community composition; community structure; environmental gradients; forb; leaf height; nitrogen fixation; oak savanna; Quercus; Solidago; species richness; Syrjala test.
Manuscript received 13 February 1998; revised 5 June 1998; accepted 17 June 1998. Present address: University of Wisconsin–Madison Arboretum, 1207 Seminole Highway, Madison, Wisconsin 537113728 USA. 2 Address correspondence to this author. E-mail:
[email protected] 1
353
354
MARK K. LEACH AND THOMAS J. GIVNISH
INTRODUCTION Savannas with a scattered canopy of oaks covered millions of hectares in the North American Midwest soon after settlement (Gleason 1913, Anderson 1983, Nuzzo 1986, Leach and Ross 1995). Frequent fires, drought, soil poverty, or grazing are thought to have maintained the open nature of oak savannas, creating a mosaic of sunlit and shaded microsites in their ground layers (Gleason 1923, Bray 1958, 1960, Curtis 1959, Grimm 1983, 1984, Anderson and Brown 1986, Packard 1988a, b, 1993, Tester 1989, 1995, Haney and Apfelbaum 1990, Pruka 1994, Rebertus and Burns 1997). Following settlement and widespread fire suppression through overt means as well as landscape fragmentation (Leach and Givnish 1996), oak savannas disappeared or succeeded into woodlands or forests over much of their previous range. By the early 1980s, intact savanna remnants occupied only 0.02% of their pre-settlement extent (Nuzzo 1986). In southern Wisconsin, oak savannas in aggregate were the most widespread vegetation type soon after settlement, covering ;42% of the area below the Tension Zone (Curtis 1959, Hole 1976). Curtis (1959) recognized three primary kinds of oak savanna, based on canopy composition and substrate. (1) Oak openings occupied mesic, loamy soils on upland sites and were dominated by large, single-stemmed bur oaks (Quercus macrocarpa), although white oak (Q. alba) and black oak (Q. velutina) were also sometimes common. (2) Oak barrens occupied sandy or gravelly substrates on upland sites and were dominated by shrubby, multistemmed Hill’s oaks (Q. ellipsoidalis) or black oaks. (3) Lowland oak savannas (seen by Curtis as related to oak openings) were an especially rare variant on floodplains and glacial lake beds, dominated by a combination of bur oak and swamp white oak (Q. bicolor). Although there has been general agreement on the canopy composition of oak savannas, a lively debate has emerged regarding the nature of savanna ground layers, which would have housed the vast majority of plant species in savanna communities. Based on field studies by Bray (1955, 1958, 1960), Curtis (1959) emphasized the close similarity of savanna ground layers to prairies, noting the dearth of species that reached their peak abundance in savannas. Packard (1988b, 1993) argued that Bray and Curtis greatly underestimated the uniqueness of the savanna flora, and that their conclusions were artifacts of (1) having studied savanna ground layers after many decades of fire suppression, and (2) making flawed calculations of the numbers of species modal in different habitats. Based on a list of ground-layer species in central Illinois savannas soon after settlement (Mead 1846), and on his own experience attempting to restore savannas, Packard (1988b, 1993) proposed that there had been several savanna specialists, but that many of these species had become marginalized or locally extirpated by fire sup-
Ecological Monographs Vol. 69, No. 3
pression. In response, Mendelson et al. (1992) argued that Packard’s work was speculative and based on sites more densely shaded than the savannas studied by Bray and Curtis; they followed Curtis (1959) in arguing that savannas were merely ecotones between forests and prairies, and thus not a priority for conservation and restoration. Largely overlooked in this controversy has been the question of whether the Bray-Curtis view of savannas as essentially ‘‘prairies with trees’’ was itself an artifact of Bray’s (1955, 1958, 1960) explicit selection of study sites based on the abundance of prairie grasses. To help resolve this controversy, we analyzed patterns in ground-layer composition, structure, and diversity of savannas along regional gradients of soil texture and local gradients of understory light regime. We chose 12 sites in southern Wisconsin based on their possession of (1) a scattered canopy of open-grown oaks; (2) a ground layer dominated by native plant species across the entire gradient from sunny to shady microsites; and (3) a history of fires during at least the past 10 yr. These criteria were adopted to avoid sampling biases inherent to the previous studies by Bray (1955, 1958, 1960) and Packard (1988b, 1993), and to provide a more accurate picture of the nature of oak savannas, their horizontal patterning at local and regional scales, and their significance for the conservation and restoration of regional biological diversity. METHODS Site selection We screened remnant savannas in southern Wisconsin using the three criteria just stated. From the resulting pool, several sites were eliminated because part or all of their ground layers contained very few species, or had a near-monoculture of Carex pensylvanica; dominance by the latter is often an indicator of severe grazing pressure or a perched watertable. Cattle had grazed some sites previously, but not within the previous 10 yr. A few sites had some shrubs mechanically removed, but not within the previous 5 yr. The 12 sites chosen for intensive study each had a low (,9%) clay content; as a result, they were distributed along a unidimensional soil texture gradient ranging from 36% to 91% sand content (Table 1: % silt 5 89.3 2 0.92(% sand); r2 5 0.996, P , 0.0001, df 5 10). The three sites with the lowest percentage of sand (Tarr 2, Marshall, and Gratiot) were located on floodplains along rivers or creeks. The four sites at Fort McCoy in west-central Wisconsin (Range 32, Quarry Hill, Tarr 1, and Tarr 2) have been subject to wildfire associated with military activities; the remaining sites have been fire-managed for the past several years. No site, however, was known to have had a continuous history of fire since European settlement.
Canopy composition By their very nature, savannas are mosaic communities with a welter of open, closed, and partially shad-
ECOLOGY OF OAK SAVANNA GROUND LAYERS
August 1999
355
TABLE 1. Study sites, which represent a range of soil conditions typical of southern Wisconsin (see Hole 1976), listed in order of descending sand content.
Site
Area (ha)
No. spp.
Soil Sand type† (%)
Range 32 Tarr 1 Albany Quarry Hill Troy Bluffs Genesee Brooklyn Cadiz Lake Lulu Tarr 2 Marshall Gratiot
3 2 2 1 2 6 1 1 4 1 1 2
83 129 106 95 139 138 137 95 132 111 110 132
S S LS LS SL SL SL SL SL SL STL STL
Silt (%)
O.M. (%)
7 8 10 11 21 21 22 24 25 43 50 55
4 4 3 3 4 9 3 9 7 12 13 6
91 89 85 85 75 74 73 71 71 53 43 36
Soil nutrient concentration (mg/g)
pH
N (%)
P
K
Mg
Ca
Dominant tree spp.‡
BA‡ (%)
6.3 5.2 6.0 5.4 5.8 7.5 5.4 7.4 6.5 4.7 7.1 7.4
0.15 0.14 0.12 0.12 0.14 0.45 0.15 0.46 0.33 0.58 0.64 0.38
11 13 10 19 6 9 14 10 15 17 18 49
68 65 68 65 80 95 107 57 165 125 215 175
175 110 175 160 170 710 95 735 530 170 1,620 730
875 600 875 600 900 2,550 550 2,775 1,750 700 4,300 2,600
Qvel/Qmac Qvel/Pstr Qvel/Pser Qvel/Qmac Qrub/Qalb Qmac/Qrub Qvel/Bpap Qmac/Pser Qalb/Qrub Qbic/Qvel Qmac Qmac/Aneg
31/26 60/8 65/16 84/8 38/35 77/16 87/7 51/16 38/33 69/15 100/0 49/21
† Soil types are: S, sand; LS, loamy sand; SL, sandy loam; and STL, silt loam. ‡ Dominant trees are the two species per site with the greatest basal area (BA). Species are: Aneg, Acer negundo; Bpap, Betula papyrifera; Pstr, Pinus strobus; Pser, Prunus serotina; Qalb, Quercus alba; Qbic, Q. bicolor; Qmac, Q. macrocarpa; Qrub, Q. rubra; Qvel, Q. velutina. Hybrids between Q. velutina and Q. ellipsoidalis are common; for convenience, these are listed under Q. velutina.
ed microsites mixed in patchy fashion at a variety of spatial scales. To characterize the canopy density and composition of this ‘‘froth’’ is inherently difficult, with the values of traditional measures (e.g., tree cover, basal area) depending heavily on where sample boundaries are drawn around groves of open-grown trees. We therefore measured the relative basal area of each tree species using stratified random samples along transects through each study site. We did not attempt to measure ‘‘average’’ canopy cover, an index that is commonly used (Curtis 1959, White and Madany 1978, Haney and Apfelbaum 1990, Leach and Ross 1995) but, in our view, is flawed.
Edaphic characteristics We collected cores from the upper 15 cm of soil from $10 locations within each site. Cores from the same site were pooled and analyzed for percentages of sand, silt, and clay, percentage of organic matter, pH, concentrations of N, P, K, Ca, and Mg, and percentage of total N by the University of Wisconsin Soil and Plant Analysis Laboratory.
Sampling of savanna ground layers At each site, we quantified the composition, structure, and diversity of the ground layer in 50–100 1-m2 marked quadrats, stratified by light availability. Across sites, we sampled a total of 722 quadrats. We quantified the ground-layer light regime via computer analysis of hemispherical photographs, using SOLARCALC 5.41 (Chazdon and Field 1987, Pearcy 1988, Chazdon et al. 1996, Valladares et al. 1997). After full canopy leafout in the year of vegetation sampling, photographs were taken ;50 cm above the southern half of each quadrat, to exclude ground-layer foliage. The film plane was leveled and the top of the camera was oriented to magnetic north; orientation of photographs
was corrected for magnetic declination in SOLARCALC. We estimated potential light availability during the growing season as the sum of direct photosynthetic photon flux density (PFD, in micromoles per square meter per day) for the summer solstice (22 June) and a point midway between the solstice and equinox (5 May–4 August), expressed as a percentage of the larger such sum for an unobscured sky at the same latitude. Estimates of total PFD and percentage of open sky were also made for each quadrat. Percentage of sand content for each quadrat was taken to be the mean for the site. Total projected cover, maximum leaf height, and reproductive activity were visually estimated for each species in each quadrat twice during a single growing season, in early and late summer. Cover classes were employed, with maximum values of 1%, 2%, 5%, 10%, 15%, . . . , 100%. For analysis, we used the midpoint of each cover class to characterize that class. Woody plants ,2 m tall were considered part of the ground layer. We measured maximum leaf height of each ground-layer species occurring in a quadrat to the nearest 0.5 dm, and noted the presence of flowering/fruiting. Species nomenclature followed Gleason and Cronquist (1991). Species were classified into seven sets of guilds based on growth form, life-span, leaf width, leaf inclination, leaf height, association with N-fixing symbionts, and possession of the C3 vs. C4 photosynthetic pathway. Growth forms included graminoids (Poaceae, Cyperaceae, Juncaceae, Hypoxidaceae, Xyridaceae) with grass-like foliage, forbs (herbs with broad leaves), woody vines, and shrubs. Species life-spans (annual, biennial, or perennial) were taken from Gleason and Cronquist (1991). We used field measurements of plants with mature, fully expanded foliage to classify species into guilds based on leaf characteristics. Maximum leaf width (0–5 mm, 6–15 mm, 16–45 mm, .45
356
Ecological Monographs Vol. 69, No. 3
MARK K. LEACH AND THOMAS J. GIVNISH
mm) of forbs was based on the diameter of the largest circle that could be inscribed on a blade. Leaf inclination (08, 308, 608, 908) was taken to be the modal inclination above the horizontal as measured by clinometer; species with leaf inclinations that varied strongly within individuals or between microsites were excluded from analysis. Leaf height (0–10 cm, 11–20 cm, 21–40 cm, 41–80 cm, 81–160 cm, .160 cm) was classified based on the tallest individual observed in the study quadrats. Species with N-fixing symbioses (all in Fabaceae, except Ceanothus americanus [Rhamnaceae]) were as reported by Allen and Allen (1981). Grasses were classified as having the C3 or C4 photosynthetic pathway based on reports by Brown (1977), Heckathorn and DeLucia (1991), and Kindscher (1992).
Data analysis Direct and indirect gradient analyses of ground-layer composition, structure, and diversity were conducted, using sand vs. silt content and light availability as the two primary gradients under study. To confirm that these two factors represented the most important environmental variables in the landscape of quadrats studied, we first conducted an ordination of quadrats in species space via nonmetric multidimensional scaling (NMS; Minchin 1987), as implemented in PC-ORD 3.0 (McCune and Mefford 1997). Standard procedures were used to determine that three dimensions were sufficient to reduce stress in NMS ordination. To ensure that the stress minimum obtained was not a local minimum, we conducted four replicate analyses with random starting points, using Sørenson distances for pairs of all species with frequency .2%. We used the joint-plot method to compare the direction and strength of relationships between various environmental variables and quadrat ordination scores in three dimensions. The direction of each relationship was the vector R, whose x, y, and z components were the Pearson correlations of the variable with each axis; the length of this vector represented the strength S (root mean square of the Pearson correlations) of the relationship. To assess the orthogonality of different environmental variables in a given analysis, we formed the dot product of the corresponding vectors in ordination space, and calculated the angle between those vectors as u 5 cos21(Ri·Rj/(zRiz·zRjz)). The mean and standard deviation of such angles across the four replicate analyses were then compiled. Environmental variables included all soil parameters, percentage of direct PFD, percentage of total PFD, and percentage of open sky. A principal components analysis (Greig-Smith 1983, McCune and Mefford 1997) was conducted to determine what fraction of the total variance in the soil parameters could be associated with a unidimensional gradient. We also used regression analysis to determine
how well percentage of direct PFD could predict percentage of open sky and percentage of total PFD. Two-dimensional b diversity.—To assess the relative importance of sand content vs. light availability in affecting ground-layer composition using direct gradient analysis, we calculated two-dimensional b diversity (slopes of species turnover), using the approach of Hujik (1995). Quadrats were grouped into quintiles along both the soil and light gradients, resulting in a classification of each quadrat into one of 25 microhabitats. The average species composition of each microhabitat was calculated from the average, across quadrats, of each species’ maximum cover across sample dates. The quantitative Sørenson index of similarity (Magurran 1988) was then calculated between each of the 300 distinct, nontrivial pairs of microhabitats. Finally, the natural logarithm of the Sørenson index was regressed simultaneously on the differences in the number of steps (0, 1, 2, 3, or 4) between microhabitats on each gradient (Hujik 1995). The slopes of this multiple regression represent the relative amounts of turnover in overall species composition along the soil and light gradients, respectively. We compared these estimates of the relative importance of the two primary gradients with those based on S for percentage of sand and percentage of PFD in the NMS ordination. Species distributions.—The weighted mean 6 1 SD of a species’ position along both soil and light gradients was calculated for the 85 species occurring in $5% of quadrats. The mean position xi of species i along each axis was calculated as
xi 5
O C z @O C ij j
(1)
ij
where Cij is the cover of species i in quadrat j, and zj is the position of quadrat j along the gradient in question (percentage of sand or percentage of direct PFD). The standard deviation si of the distribution of species i along each axis was calculated as si 5
[1 O C (z 2 x ) 2@O C ] ij
j
i
2
ij
0.5
.
(2)
Standard deviations of species’ positions were used to compare their niche breadth along both soil and light gradients. To determine whether flowering individuals within a species tended to occur in more brightly lit microsites, we recalculated the mean position of each common species using only those quadrats in which flowering by that species had been noted. A paired t test was then used to determine whether, across species with reproductive activity in $2% of the quadrats, flowering individuals occupied a significantly brighter position along the light gradient than did all individuals of the same species. Guild distributions.—Distribution and diversity of forbs and graminoids (the two dominant growth forms) were evaluated along both soil and light gradients. The light gradient was divided into four steps (#12.5%,
August 1999
ECOLOGY OF OAK SAVANNA GROUND LAYERS
25%, 50%, or 100% direct PFD), reflecting the roughly logarithmic distribution of irradiance within savannas (Pruka 1994). The soil gradient was similarly divided into four steps, based on standard soil texture classes of sand, loamy sand, sandy loam, and silt loam (Brady 1974, Hole 1976), involving a roughly logarithmic series of steps in silt content. To ensure that this method of analysis was not influenced by uneven distributions of light availability across soil classes, we used the GLM procedure in SAS and the Student-NewmanKeuls test. There was no significant relationship between light availability and soil class (P . 0.36, df 5 720). We then calculated the mean cover and species richness (number of species per square meter) of forbs and graminoids for each of the 16 light 3 soil microhabitats. Mean cover and richness of each growth form guild were related to each other using simple regression. Backward-elimination multiple regression was used to relate cover of each guild to position on the soil and light gradients, including as independent variables the step positions (mean silt content, midpoint of PFD range) of each microhabitat on both gradients; the squares, natural logarithms, and squares of natural logarithms of step positions; products of step positions; and products of natural logarithms of step positions. To test whether the distributions of guilds or species differed significantly along the sand content and direct PFD gradients, we employed a new nonparametric geostatistic using the program GEODISTN (Syrjala 1996). Syrjala originally used this test to compare the geographic distribution of two populations in two dimensions. Here we use it, apparently for the first time, to evaluate the distribution of pairs of populations in a two-dimensional ecological space. The test requires that data on the abundance of the two populations being compared come from the same set of data points, with coordinates in a two-dimensional space; relative population size is immaterial. The null hypothesis is that the underlying distributions of the populations are identical. All tests used $1000 replicate bootstrap resamplings. Syrjala tests were conducted to evaluate the significance of observed differences in the soil 3 light distribution of (1) C3 grasses, C4 grasses, and sedges; (2) different leaf width, inclination, and height classes; (3) N-fixing species; and (4) congeneric species of Aster and Solidago, which were the two largest genera of forbs seen in the study; all species with frequencies .2% were compared. Niche breadth vs. ecological amplitude.—We compared species niche breadth within savannas with their breadth of distribution across habitats, based on comparisons with the fidelity data compiled by Curtis (1959). For the 85 most common species found in our study, we calculated niche breadth as eH9, where H9 is the Shannon index of diversity computed based on coverage by the species in question within each of the 16 light 3 soil microhabitats defined previously. For 75
357
of these species, Curtis (1959) presented a fidelity index, based on studies at 1232 sites in Wisconsin, equal to the number of the 34 recognized native communities in which a species occurred. Relationships between these measures of niche breadth within savannas vs. between habitats were examined using rank correlation. Comparisons of a and b diversity with other Wisconsin communities.—To analyze levels of vascular plant richness in the three dominant native communities (savannas, prairies, and forests) in the uplands of southern Wisconsin, we compared our findings with data culled from unpublished field notes in the files of the Plant Ecology Laboratory (PEL) at the University of Wisconsin–Madison. Lowland stands were omitted. The PEL data were collected by Curtis and his students and colleagues during the 1940s and 1950s, using 20 1-m2 quadrats per stand. The species densities reported by these investigators were often under-reported, in part because alien species were often not tallied (G. Cottam, personal communication). To help avoid spurious comparisons, we removed alien species from the savanna data before conducting analyses, but (for ease of collation and calculation) retained the few alien species in the PEL database. This approach tended to bias the results in favor of greater diversity in the historical samples of forests and prairies. For 16 upland prairies, 22 upland forests, and the nine upland savannas in this study, we computed the mean number of species per quadrat (a diversity), the total number of species found in 20 quadrats (g diversity), and the amount of species turnover across 20 quadrats (b diversity 5 g/a). Differences between each of the habitat means were compared using two-tailed t tests. RESULTS
Canopy composition Tree canopies of the 12 remnant savannas were dominated by open-grown oaks, which made up 56–100% (mean 82%) of total basal area (Table 1). Black oak tended to dominate on the sandiest sites, white and red oak on intermediate sites, and bur and swamp white oaks on silt-loams. The oaks tended to be aggregated in various configurations, with open spaces near or between most trees. Non-oaks that contributed $10% to total basal area at one or more sites included black cherry (Prunus serotina, four sites), basswood (Tilia americana, two sites), and jack pine (Pinus banksiana, one site). Generally, the trees dominating the smaller size classes were fire-intolerant species (e.g., Acer negundo and Prunus virginiana), suggesting that these species have invaded during recent lapses in fire. Range 32 Barrens, which had the lowest percentage of oak basal area, would have been classified as a pine barrens by Curtis (1959). Most of the remaining sites would have been classified as oak barrens or oak openings. A few sites bordering on more heavily wooded areas might have been classified as one or another kind
Ecological Monographs Vol. 69, No. 3
MARK K. LEACH AND THOMAS J. GIVNISH
358
TABLE 2. Frequency and mean distributions of the 85 most common species (omitting Poa compressa and P. pratense) along gradients of PFD and sand. Species present in $5% of the quadrats are tabulated. Direct PFD (%)
Species
Frequency‡ (%)
Mean
1
Carex pensylvanica Cornus racemosa Euphorbia corollata Prunus serotina Taraxacum officinale† Aster sagittifolius Helianthus strumosus Vitis riparia Schizachyrium scoparium Rhus glabra Smilacina racemosa Amphicarpaea bracteata Monarda fistulosa Andropogon gerardii Tradescantia ohiensis Fragaria virginiana Achillea millefolium Oxalis stricta Hydrophyllum virginianum Solidago canadensis Corylus americana Quercus rubra Quercus velutina Melilotus alba† Amorpha canescens Panicum oligosanthes 3 acuminatum Rhamnus cathartica† Elytrigia repens† Solidago nemoralis Aster pilosus Comandra umbellata Rubus occidentalis Smilacina stellata Phlox pilosa Polygonatum biflorum Aster oolentangiensis Rosa carolina Toxicodendron radicans Geranium maculatum Quercus macrocarpa Galium trifidum Panicum acuminatum Rubus allegheniensis Rumex acetosella† Circaea lutetiana Rudbeckia hirta Antennaria plantaginifolia Solidago ulmifolia Galium boreale Prunus virginiana Anemone cylindrica Potentilla simplex Smilax herbacea Zanthoxylum americanum Desmodium glutinosum Anemone virginiana Asclepias syriaca Elymus riparius Galium concinnum Lathyrus venosus Carya ovata Lysimachia quadrifolia Hepatica americana Heracleum lanatum Liatris aspera Thalictrum dasycarpum
46.4 38.4 32.4 30.1 27.6 26.7 23.4 23.0 22.4 21.7 21.5 21.2 18.8 18.1 15.9 15.5 14.4 13.6 13.3 13.3 13.0 13.0 13.0 12.6 12.5 11.8 11.8 11.5 11.2 10.9 10.9 10.9 10.8 10.7 10.4 10.0 9.8 9.7 9.4 9.3 8.9 8.9 8.6 8.6 8.4 8.4 8.3 8.3 8.2 8.2 8.0 7.9 7.5 7.2 7.1 6.8 6.8 6.8 6.8 6.8 6.6 6.6 6.5 6.5 6.5 6.5
24.7 33.9 56.3 25.0 29.8 39.2 50.7 35.2 74.6 56.3 26.0 33.2 47.4 56.9 50.4 44.0 50.8 32.2 24.9 47.6 40.3 32.3 33.4 65.9 70.3 59.8 47.1 35.1 68.2 56.1 66.4 46.4 34.7 56.0 47.5 39.1 57.8 31.1 25.7 45.9 11.7 64.3 45.3 37.4 24.3 51.6 26.2 44.3 49.6 22.6 49.0 25.9 36.8 20.9 13.7 24.6 50.2 14.7 31.4 42.2 45.6 24.8 10.6 26.0 64.9 27.9
23.1 25.2 25.5 22.2 24.8 25.9 25.8 25.4 23.7 28.4 23.5 26.0 26.2 24.2 29.1 23.8 24.7 28.0 21.5 27.0 31.1 26.9 27.2 18.9 27.4 26.8 20.5 27.3 32.1 28.3 23.0 24.6 21.5 28.8 33.6 30.7 28.6 25.3 29.3 26.9 14.2 37.1 32.1 30.7 18.6 27.2 22.0 19.3 26.2 19.0 27.4 23.7 31.8 21.8 15.0 23.8 27.4 14.2 37.3 25.6 28.4 22.3 10.9 26.2 23.2 21.0
SD
Sand (%) Mean
1
76.4 64.3 80.4 68.0 75.3 71.0 65.7 68.7 78.9 69.9 62.8 72.3 74.8 84.5 77.6 64.4 82.0 57.4 39.6 55.5 72.7 73.5 74.3 73.3 77.0 80.4 73.9 75.7 76.1 79.5 75.1 69.2 67.5 80.3 56.0 82.9 78.9 72.0 59.9 69.3 72.4 80.4 69.4 77.0 61.1 83.7 80.6 74.2 72.9 63.3 74.2 70.0 58.2 69.9 73.4 66.5 77.7 66.8 50.4 55.2 73.3 77.3 74.5 34.0 75.4 42.4
9.7 15.6 7.7 15.0 11.9 15.4 13.9 12.6 6.9 13.5 17.8 11.8 16.6 5.4 16.4 20.5 5.1 21.1 7.4 16.7 17.0 2.3 11.2 6.3 6.9 6.0 2.2 12.4 5.5 6.8 8.6 12.5 19.1 7.4 22.4 7.0 7.2 10.7 18.8 16.2 14.3 2.5 13.4 6.7 16.3 9.7 5.9 0.4 5.1 20.1 11.1 12.6 19.4 7.8 0.8 15.4 12.8 17.5 21.8 19.4 6.3 11.9 10.4 0.0 3.7 2.2
SD
ECOLOGY OF OAK SAVANNA GROUND LAYERS
August 1999
359
TABLE 2. Continued.
Direct PFD (%)
Species
Frequency‡ (%)
Mean
1
Bouteloua curtipendula Rubus idaeus Polemonium reptans Quercus alba Lonicera 3 bella† Lysimachia lanceolata Acer rubrum Ambrosia artemisiifolia Anemone quinquefolia Populus tremuloides Rubus flagellaris Viola cucullata Viola sororia Zizia aurea Besseya bullii Helianthus grosseserratus Sanguinaria canadensis Solidago juncea Tilia americana
6.4 6.4 6.2 5.8 5.7 5.5 5.4 5.4 5.4 5.4 5.4 5.4 5.4 5.4 5.3 5.3 5.3 5.3 5.3
66.7 37.0 12.0 35.8 27.4 37.6 10.4 42.3 32.6 64.4 38.8 32.2 19.8 58.2 46.1 53.0 24.7 53.2 14.9
19.4 21.3 15.1 24.6 24.4 27.6 9.4 27.8 24.1 28.6 30.2 24.6 19.4 25.9 19.7 25.6 19.1 34.0 14.5
SD
Sand (%) Mean
1
75.9 50.1 61.5 74.4 76.8 85.5 69.2 77.9 69.1 58.6 79.0 53.4 74.6 45.3 74.9 46.4 45.9 73.1 61.5
4.7 17.6 21.4 0.9 6.6 8.3 17.6 11.2 12.5 16.1 9.3 13.7 4.3 8.1 3.8 11.5 17.4 0.3 18.4
SD
Note: Alien species Poa compressa and P. pratense were among the most frequent species, but were inadequately distinguished in the field due to their strong vegetative similarity; hence, they were omitted from this list. † Alien species. ‡ Percentage of the 722 1-m2 quadrats in which a species is present.
of forest (arbitrarily distinguished from savannas as having a mean canopy cover .50%), depending on where boundaries of each sample were drawn. All sites, however, had a wide range of shaded, intermediate, and open microsites as determined by hemispheric photography.
Environmental gradients Sand content varied across sites from 36% to 91%; we divided one locale (Tarr Creek) into two study sites based on an abrupt transition from sands to sandy loams (Table 1). A PCA revealed that ;81% of the total variance in soil characteristics was explained by eigenvector 1, strongly associated with sand content. All soil variables are significantly related to sand content except pH (P . 0.23, two-tailed t test, df 5 10) and P concentration (P . 0.06, two-tailed t test, df 5 10). Direct PFD varied across quadrats from 0.0% to 100.0% (37.8 6 29.5%, mean 6 1 SD), was strongly correlated to both percentage of open sky ( r 2 5 0.74, P , 0.0001, df 5 720) and percentage of total PFD (r 2 5 0.99, P , 0.0001), and showed no significant correlation with sand content (r 2 5 0.001, P . 0.3, df 5 720).
Gradients in ground-layer composition Ordination of quadrats in species space using nonmetric multidimensional scaling showed that (1) all measures of light regime (percentages of direct PFD, open sky, and total PFD) were strongly colinear (u 5 7.6 6 0.58, mean 6 1 SD, averaged across three measures and four replicate runs); (2) the 12 soil characteristics were less strongly colinear (u 5 36.5 6 6.38);
and (3) the measures of light regime and soil characteristics were essentially orthogonal ( u 5 93.6 6 4.38). These results strongly suggest that two fundamental ecological gradients, soil texture and light availability, affect ground-layer composition in the savannas examined. Percentage of sand explained 32% more variance in ordination scores than did percentage of direct PFD; when r2/(1 2 r2) was used to calculate the ratio of explanatory ‘‘signal’’ to noise, percentage of sand had 2.3 times the explanatory power of percentage of direct PFD. A multiple regression of Sørenson similarity among pairs of 25 soil 3 light microhabitats showed that variation in soil texture had roughly twice the effect of light availability on average species composition: ln C 5 3.94 2 0.31Gsand 2 0.16Glight
(3)
where C is the quantitative Sørenson index (Magurran 1988) and Gsand and Glight are the number of steps separating a pair of microhabitats along the soil and light gradients, respectively. The coefficients (slopes) associated with Gsand and Glight indicate the rate at which species composition changes with position on the soil and light gradients; together they are a two-dimensional measure of b diversity (Hujik 1995). In total, 417 plant species were detected in 722 1-m2 quadrats. This represents ;22% of the native vascular flora of Wisconsin (T. Cochrane, personal communication). Forbs accounted for 64% of total herb cover; graminoids for 34%; and vascular cryptogams (ferns), for 2%. Perennials accounted for 88% of the species observed; annuals and biennials each accounted for 6%. In all, 83 families were represented. The six most
360
MARK K. LEACH AND THOMAS J. GIVNISH
Ecological Monographs Vol. 69, No. 3
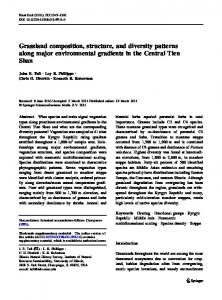
FIG. 1. Absolute coverage of (A) forbs, (B) graminoids, and (C) all ground-layer herbs, and (D) relative coverage of forbs, plotted as a function of direct PFD (photon flux density) and sand content. Numbers represent mean values for each of the 16 light 3 soil microhabitats, plotted at the centroids of those microhabitats. Contours reflect the best fit equations relating coverage to the independent variables. Coefficients of determination (r 2) are all significant at P , 0.001: (A) 0.96, df 5 12; (B) 0.85, df 5 13; (C) 0.91, df 5 12; and (D) 0.98, df 5 12. Note the log scales.
species-rich families were Asteraceae (74 spp.), Poaceae (46 spp.), Rosaceae (26 spp.), Fabaceae (20 spp.), Ranunculaceae (15 spp.), and Apiaceae (14 spp.). Mean positions along the soil and light gradients of the 85 most common species are given in Table 2. The average standard deviation of species distributions along the light gradient was 2.2 times greater than that for the soil gradient (mean difference 13.7%, P , 0.001, paired t test, df 5 84); 94% of the most common species had broader amplitudes along the light gradient than along the soil gradient. Among the 82 species reproductive in $2% of quadrats, flowering individuals had mean distributions significantly skewed toward brighter microhabitats than did the entire population of conspecifics (mean D 5 1.9% maximum PFD; P , 0.001, two-tailed paired t test, df 5 81).
Gradients in community structure and diversity Mean forb cover was greater than graminoid cover in all but the sandiest, brightest environments (Fig. 1A). Backward-elimination regression showed that forb cover increased in a significant, nonlinear fashion with increasing silt content:
Cforb 5 20.89 1 0.050(% silt)2 2 1.41(% silt) 1 2.493(ln % light)(ln % silt)
(4)
(r 5 0.96, P , 0.0001, df 5 12). Graminoid cover varied nonlinearly with both soil texture and light availability, and was greatest in well-lit, moderately sandy microhabitats (Fig. 1B): 2
Cgram 5 24.15 1 0.0043(% light)2 2 0.41(% silt) (5) (r 2 5 0.85, P , 0.0001, df 5 13). Total cover by ground-layer plants increased nonlinearly with percentage of silt at a given level of irradiance; total cover increased with light availability on silty sites, but decreased at the highest PFD levels on sandy sites (Fig. 1C):
Ctotal 5 44.69 1 0.067(% silt)2 2 3.326(% silt) 1 5.858(ln % light)(ln % silt)
(6)
(r 5 0.91, P , 0.0001, df 5 12). The percentage of total cover accounted for by forbs increased with percentage of silt and decreased with irradiance in a highly regular fashion (Fig. 1D): 2
August 1999
ECOLOGY OF OAK SAVANNA GROUND LAYERS
FIG. 2. Mean number of species of forbs and of graminoids per square meter, plotted as a function of the mean coverage by each group in each of the 16 light 3 soil microhabitats. Lines represent least mean squares regressions.
%Cforb 5 47.90 1 0.986(% silt) 2 0.00289(% light) 2
(7)
(r 2 5 0.98, P , 0.0001, df 5 12). Averaged across quadrats within each of 16 microhabitats (4 soil steps 3 4 light steps), the mean numbers of species of forbs and graminoids per quadrat increased linearly with total cover by their respective groups (Fig. 2). However, at a given level of coverage by guild members, the mean richness of forbs was significantly greater than that of graminoids ( P , 0.001, ANCOVA; df 5 1, 14). The trend for forbs to have greater total cover than graminoids in any given microhabitat, and to achieve much higher cover in some microhabitats than that for graminoids across microhabitats (Fig. 2), reinforced the tendency toward higher species richness in forbs. Annuals and biennials contributed only 4.9% of total cover, on average. Only four such species had a frequency .5%: Amphicarpa bracteata (19.8%), Melilotus alba (11.8%), Rudbeckia hirta (7.9%), and Ambrosia artemisiifolia (5.1%). Among graminoids, C4 grasses were generally restricted to brightly lit microsites, except on sandier soils where Schizachyrium scoparium and Andropogon gerardii also grew in semishade (Fig. 3). C3 grasses and sedges were more widely distributed along the light gradient, but graminoids as a whole were most common on moderately sandy microsites (Fig. 3). When cover by species in each of the three guilds of graminoids was pooled, the distributions of the three guilds differed significantly from one another (P , 0.0001, Syrjala test for all three pairwise comparisons). C4 grasses predominated in brightly lit (mean PFD 5 60.6%), sandy microsites; C3 grasses in shadier microsites (mean PFD 5 51.5%), and sedges in the shadiest microsites (mean PFD 5 39.0%). Grasses occupied somewhat sandier microsites (mean 72.6 6 15.0% sand) than
361
sedges (66.0 6 18.6% sand), but their unweighted mean distributions did not differ significantly (P . 0.2, twotailed t test, df 5 29). Among forbs, the mean distributions of guilds based on different leaf widths, inclinations, or heights differed significantly from each other, based on the Syrjala test (Figs. 4–6). On average, forb species with wider leaves occupied shadier, siltier microsites (Fig. 4), as expected from between-habitat comparisons elsewhere and from economic theory (Givnish 1987, 1988). Forb species with more steeply inclined leaves occupied more brightly lit microsites (Fig. 5). The expected tendency for such leaves to be common in sandy (and hence, droughty and/or nutrient-poor) microsites (Givnish 1979, 1988) did not manifest itself (Fig. 5). It may have been counteracted, in terms of the effect on the mean distribution of forb species with vertical leaves, by the tendency for total cover to increase with silt content on well-lit microsites (Fig. 2). As expected, the taller leaf height classes were associated with siltier and brighter microsites (Fig. 6). Such microsites generated greater amounts of total herb cover (Eq. 6), which, in turn, is closely correlated with the logarithm
FIG. 3. Distribution of graminoids along gradients of soil texture and potential light availability. Each point represents the weighted mean distribution of a species; bars indicate the standard deviation of its occurrence along both gradients. Note the relative restriction of C4 grasses to sunny, sandy microsites; C3 grasses and sedges occupy siltier and progressively shadier conditions.
362
MARK K. LEACH AND THOMAS J. GIVNISH
Ecological Monographs Vol. 69, No. 3
FIG. 4. Mean leaf width of forbs (A) and relative coverage of forb species with different leaf widths (B–E), plotted as a function of direct PFD and sand. Mean values for each of the 16 light 3 soil microhabitats are plotted at the centroids of those microhabitats. Contours (not shown if r 2 , 0.75) reflect the best fit equations relating leaf width or coverage to the independent variables. Axes are logarithmic in PFD and silt (reversed polarity). Values of r 2 are (A) 0.97, df 5 10, P , 0.001; (B) 0.72, df 5 11, P , 0.01; (C) 0.75, df 5 13, P , 0.001; (D) 0.09, df 5 14, NS; and (E) 0.92, df 5 12, P , 0.001.
of the mean leaf height (h) of herbaceous species found in those microsites (Fig. 7):
h 5 265.90 1 43.22 ln Ctotal
(8)
(r 5 0.80, P , 0.0001, df 5 14). Contrary to expectations (Givnish 1989, Leach and Givnish 1996), plants with N-fixing symbionts were 2
present across much of the light and soil gradients (Fig. 8). Most species, however, did grow on well-lit, sandy microsites, in accord with predictions that plants in such habitats should be strongly limited by N availability and, thus, likely to realize a net energetic and competitive advantage through investment in nitrogen fixation. Interestingly, five of the six species with N-fix-
August 1999
ECOLOGY OF OAK SAVANNA GROUND LAYERS
363
FIG. 5. Mean leaf inclination above the horizontal (A) and relative coverage of forb species with different leaf inclinations (B–E), plotted as a function of direct PFD and sand. Mean values for each of the 16 light 3 soil microhabitats are plotted at the centroids of those microhabitats. Contours reflect the best fit equations relating leaf inclination or coverage to the independent variables. Axes are logarithmic in PFD and silt (reversed polarity). Values of r 2 are (A) 0.90, df 5 9, P , 0.001; (B) 0.89, df 5 9, P , 0.001; (C) 0.83, df 5 8, P , 0.05; (D) 0.79, df 5 11, P , 0.001; and (E) 0.93, df 5 12, P , 0.001.
ing symbionts that grew in shadier and/or siltier microsites were climbing or scrambling vines; the shade specialist Desmodium glutinosum, a free standing species, was exceptional in this regard. The bivariate mean distributions of species in the two most diverse genera of forbs (17 species in Aster
and nine species in Solidago) appeared to be staggered relative to each other (Fig. 9). Among species occurring in .2% of the quadrats, pairs of congeners differed significantly in their distributions along the two-dimensional soil 3 light gradient (P , 0.05, Syrjala test) in 27 of 28 cases for Aster and 14 of 15 cases for
364
MARK K. LEACH AND THOMAS J. GIVNISH
Ecological Monographs Vol. 69, No. 3
August 1999
ECOLOGY OF OAK SAVANNA GROUND LAYERS
365
FIG. 7. Mean leaf height of forbs as a function of mean forb cover in the 16 light 3 soil microhabitats. The line represents the least mean squares regression.
Solidago. The exceptions were Aster lanceolata and A. puniceus (P 5 0.10, Syrjala test), and Solidago juncea and S. nemoralis (P 5 0.054, Syrjala test). Diversity in savannas vis-a`-vis prairies and forests.—Based on comparisons with earlier surveys of Wisconsin forests and prairies by Curtis and his colleagues, the savannas investigated in this study had much higher levels of plant species richness at the a, b, and g scales, sensu Whittaker (1972). In savannas, the mean number per quadrat (a diversity) was 16.1 6 1.3 species/m2, significantly greater (P , 0.01, twotailed t test) than that for forests (8.2 6 2.5 species/ m2) or prairies (11.4 6 2.6 species/m2). At slightly larger spatial scales, savannas showed a very high amount of g diversity, averaging 89.3 6 12.0 species/ 20 m2, more than twice that for forests (42.8 6 8.0 species/20 m2) or prairies (41.5 6 8.3 species/20 m2). Savannas thus showed a substantial amount of internal species turnover with distance (b diversity 5 g/a 5 5.6 6 0.9), slightly greater than that seen in forests ( b 5 5.4 6 0.9) and significantly greater than that seen in prairies (b 5 3.7 6 0.5). The relatively low levels of b diversity within prairies may partly reflect lower microsite heterogeneity in light levels than in layered forest and savanna communities. An additional measure of the high level of plant diversity within and between savanna remnants is provided by comprehensive lists of vascular plants compiled for the 12 study sites and an additional 10 chosen in southern Wisconsin, using the same sampling cri-
FIG. 8. Distribution of species with N2-fixing symbioses along gradients of soil texture and potential light availability. Each point represents the weighted mean distribution of a species; bars indicate the standard deviation of its occurrence along both gradients. Taxa include Amorpha canescens, Amphicarpaea bracteata, Apios americana, Baptisia bracteata, Ceanothus americanus, Dalea candida, Dalea purpurea, Desmodium glutinosum, D. illinoense, Lathyrus venosus, Lupinus perennis, and Vicia americana.
teria. In all, 507 native vascular plant species were tallied across 22 sites totaling 42 ha. This total makes up ;27% of the total native flora of Wisconsin (T. Cochrane, personal communication), inhabiting an area of ;14 3 106 ha. An additional 73 species of alien origin were noted. The 22 sites surveyed supported 41 tree species, 42 shrub species, seven species of woody vines, 94 graminoids, 380 forbs, and 16 vascular cryptogams. We encountered nine species considered as threatened or endangered in Wisconsin (Wisconsin DNR 1993): Agastache nepetoides, Asclepias purpurescens, Besseya bullii, Camassia scilloides, Cypripedium candidum, Gentiana alba, Hypericum sphaerocarpum, Parthenium integrifolium, and Polytaenia nuttallii. In addition, seven species on the Wisconsin
←
FIG. 6. Mean leaf height (A) and relative coverage of forb species with specific leaf heights (B–G), plotted as a function of direct PFD and sand. Mean values for each of the 16 light 3 soil microhabitats are plotted at the centroids of those microhabitats. Contours (not shown if r2 , 0.60) reflect the best fit equations relating leaf height or coverage to the independent variables. Axes are logarithmic in PFD and silt (reversed polarity). Values of r2 are (A) 0.93, df 5 11, P , 0.001; (B) 0.35, df 5 14, P , 0.05; (C) 0.43, df 5 12, P , 0.05; (D) 0.93, df 5 12, P , 0.001; (E) 0.60, df 5 14, P , 0.001; (F) 0.75, df 5 10, P , 0.01; and (G) 0.85, df 5 12, P , 0.001.
366
MARK K. LEACH AND THOMAS J. GIVNISH
Ecological Monographs Vol. 69, No. 3
Relationship of species niche breadth within savannas to ecological breadth across habitats The number of habitats occupied by common savanna species in Wisconsin (fide Curtis 1959) increased significantly with the Shannon diversity of 16 soil 3 light microhabitats occupied in this study (Fig. 10: Spearman rank correlation rS 5 0.38, P , 0.01, df 5 83). The 25 species that occupied the broadest range of microhabitats are listed in Table 3. Among these generalists, there were four species of Asteraceae, three of Liliaceae, and two each of Anacardiaceae, Fabaceae, and Rosaceae. Eight generalist species had fleshy fruits, dispersed internally by birds or mammals; two had nutlike seeds, scatter-hoarded by squirrels and other mammals. DISCUSSION
FIG. 9. Distribution of species of Aster (top) and Solidago (bottom) along gradients of soil texture and potential light availability. Points depict weighted mean distributions; horizontal and vertical bars indicate the standard deviations of a species’ occurrence along both gradients. Solid circles represent species with frequency .2%, for which the Syrjala test for divergent distributions was significant (P , 0.05) in 27 of 28 species pairs in Aster and in 14 of 15 species pairs in Solidago.
Natural Heritage Program’s Watch List were detected: Botrychium simplex, Corallorhiza odontorhiza, Eupatorium sessilifolium, Napaea dioica, Talinum rugosum, Thaspium trifoliatum, and Trillium recurvatum.
This study is the first, since Bray’s (1955, 1958, 1960) classic work, to survey patterns in the composition, structure, and diversity of oak savannas in Wisconsin across a variety of edaphic conditions. Bray included only sites with a scattered oak canopy and a ground layer dominated by prairie grasses. Our sampling criteria differ critically from Bray’s, including sites with a scattered oak canopy, a ground layer dominated by native species across the entire light gradient, and a history of frequent fire. Bray’s presupposition of ground layers dominated by prairie grasses may have led, circularly, to the now-common description of savannas (e.g., see Tester 1995) as ‘‘prairie with trees.’’ It may also explain why Bray could find no sites fitting his grass criterion on moister, finer textured soils, given that forbs dominated all but the sandiest and sunniest microsites in the current study (Fig. 1). Consistent with our findings, Anderson et al. (1994) and Bowles and McBride (1998) noted a lack of grasses in two Illinois oak savannas, and Packard (1988b) remarked that Mead (1846) listed few grasses as growing in savannas. Because forb cover and species richness exceed those of graminoids in most savanna microsites, it might be more appropriate to describe midwestern oak savannas as forblands rather than grasslands. Including only sites burned during the previous 10 years addresses one of the key criticisms of Bray’s research by Packard (1988b), who claimed that the apparent dominance of savanna ground layers by prairie grasses and the apparent rarity of savanna specialists were artifacts of studying heavily grazed, fire-suppressed sites. Sites chosen for the current study were unusual in having had a recent history of frequent prescribed burns or wildfires, as well as a high diversity of native ground-layer species, with few invading aliens. Many are protected and managed under the Scientific Areas program of the Wisconsin Department of Natural Resources. Although these sites collectively span a large range of habitats, several types of savanna
August 1999
ECOLOGY OF OAK SAVANNA GROUND LAYERS
FIG. 10. Number of macrohabitats (e.g., southern mesic forest, fen, dry prairie) occupied by common savanna species as a function of the diversity of light 3 soil microhabitats that they occupy within savannas. The line represents the least mean squares regression for the 30 most common species.
(e.g., acid thin-soil glades, brush prairies) were not included in the current study. Turnover in ground-layer composition was roughly twice as great along the soil (percentage of sand) gradient as along the light (direct PFD) gradient (Eq. 3). A potential criticism of this finding is that the soil gradient corresponds to the ranking of relatively few (12) sites based on their soil texture, whereas the light gradient corresponds to a ranking of many (722) quadrats along a range of light conditions replicated at each site. Consequently, it might be argued that turnover along the soil gradient reflects not only the response of species to sand content, but also the site-specific factors confounded with soil texture, including site history, geographic location, and local pool of species with access to that site. It is not possible, based on the data gathered for this paper, to evaluate how important soil texture and its correlates are compared with such site-specific factors. However, the results of a savanna reassembly experiment (Leach 1996; M. K. Leach and T. J. Givnish, unpublished manuscript) indicated that, when species pool, site history, and disturbance regime are carefully controlled across a range of soil and light conditions comparable to those seen in the current study, species turnover along the soil texture gradient is four times that along the light gradient. This finding strongly suggests that the smaller, twofold difference in species turnover along soil vs. light gradients in remnant savannas is not an artifact of the soil gradient being confounded with site history, location, and species pool.
Trends in community structure Significant differences in the distributions of graminoids vs. forbs, of C4 vs. C3 grasses, of N-fixers vs. nonfixers, and of species with different leaf widths, heights, and inclinations (see Figs. 1, 3–7) suggest that the competitive potential associated with different
367
growth forms and strategies of energy capture varies strongly across soil and light gradients. The trends observed are generally consistent with those expected based on the energetic/ecological impact of the traits involved. C4 grasses were dominant only in open, sandy microsites in savanna remnants; such plants generally transpire less water per unit of photosynthate than those with C3 photosynthesis, maintain higher photosynthetic rates under dry, sunny conditions by suppressing photorespiration, and achieve higher photosynthetic rates at a given leaf N content (Pearcy and Ehleringer 1984, Field and Mooney 1986, Reich et al. 1992). Thus, C4 species (mostly grasses, in Wisconsin) should have a competitive edge under the sunny, hot, dry, and nutrient-poor conditions expected on open, sandy microsites. C3 species should have an advantage in shadier, moister, and/or more nutrient-rich microsites, given the higher quantum yield of the C3 pathway under optimal conditions (Pearcy and Ehleringer 1984), and given that photosynthetic light capture in C3 plants proceeds over the entire leaf surface, not just the cells associated with the vascular bundles. Plants with N-fixing symbioses were generally concentrated in sandy, brightly lit microsites, where N fixation would be expected to yield the greatest energetic advantage (Givnish 1988, Leach and Givnish 1996). Under more nutrient-rich conditions, perennial legumes generally have lower maximum growth rates than other herbaceous plants (Grime and Hunt 1975), preTABLE3. Niche breadth within savannas (modified Shannon index [eH9 ] of species frequency in the 16 light 3 sand microhabitats) is correlated with the number of macrohabitats across which species occur in Wisconsin, (Curtis 1959). Species with the 25 highest values of eH9 are tabulated.
Species
eH9
No. macrohabitats
Polygonatum biflorum Corylus americana Amphicarpaea bracteata Aster sagittifolius Carex pensylvanica Fragaria virginiana Monarda fistulosa Amorpha canescens Rhus glabra Oxalis stricta Toxicodendron radicans Smilacina racemosa Vitis riparia Euphorbia corollata Cornus racemosa Schizachyrium scoparium Asclepias syriaca Rubus occidentalis Smilacina stellata Phlox pilosa Tradescantia ohiensis Helianthus strumosus Conyza canadensis Ceanothus americanus Rudbeckia hirta
14.0 13.4 13.4 13.1 11.8 11.2 11.1 10.7 10.3 10.2 10.2 10.0 10.0 10.0 9.7 9.4 9.3 9.2 9.2 9.1 9.1 9.0 8.9 8.8 8.8
17 21 19 12 16 25 17 15 12 4 25 19 22 15 21 15 15 5 21 18 15 15 5 12 13
368
MARK K. LEACH AND THOMAS J. GIVNISH
sumably because they divert photosynthate toward maintaining symbiotic bacteria, rather than to the production of productive tissue (Tilman 1988). Under shady conditions, leaf N content and associated darkreaction enzymes do not limit photosynthesis as much as they do under sunnier conditions (Bjo¨ rkman 1981), so it is less likely that N fixation would yield a net advantage at low light levels. It is intriguing that four of the six N-fixers that peak outside sunny, sandy microsites are vines (Amphicarpaea, Apios, Lathyrus, and Vicia) occurring on somewhat siltier soils (Fig. 7). Such N-fixing vines may be able to realize a greater growth rate on richer soils than do free-standing nonfixers, either by orienting their highly mobile foliage (Teramura et al. 1991) to intercept sidelighting, or by allocating less to unproductive stem tissue. Given the high specific conductance (and thus, presumably, photosynthesis) of many herbaceous vines (Teramura et al. 1991), and their dependence on rapid rates of extension to outcompete free-standing hosts, N-fixing may be coadapted to the vine habit. At least under moderately well-illuminated conditions, N fixation would permit high rates of photosynthesis that require high rates of transpiration, which may not be sustainable on coarser grained soils. Under the light levels typically inhabited by Amphicarpaea, Apios, Lathyrus, and Vicia (30–50% direct PFD), a plant would spend a substantial fraction of each day, and would conduct most of its photosynthesis, under high levels of irradiance (including side lighting), where leaf N content is limiting (Bjo¨ rkman 1981). More densely shaded sites should provide much shorter periods and amounts of net photosynthesis during sunflecks (Chazdon 1988, Chazdon et al. 1996, Valladares et al. 1997) to balance against the continual high cost of N fixation. Interestingly, all four N-fixing vines appear to avoid drought stress under hot, sunny conditions by folding their leaflets together and/or away from direct sunlight. N-fixing vines may be excluded from open, sandy sites by the low moistureholding capacity of sandy soils and by the low density of free-standing forbs (their most likely structural host). The occurrence of Desmodium glutinosum under fairly dense shade (;10% direct PFD) is anomalous; it can harbor N-fixing bacteria (Allen and Allen 1981), but its actual behavior under low light should be investigated. Its congener, Desmodium mollicullum, was considered to be the only shade-obligate legume in a neotropical savanna (Izaguirre-Mayoral et al. 1995). The distributions of species differing in leaf width, leaf inclination, and leaf height varied in accord with predictions based on economic theory (see reviews by Givnish 1988, 1995). Forbs with narrow leaves tended to inhabit microsites that were sunnier (and hence, drier) and sandier (and hence, drier and more nutrient poor) than those occupied by species with broader leaves. Narrow leaf surfaces reduce total water loss per unit area, at the cost of any increase to photosynthesis caused by elevating leaf temperature over air temper-
Ecological Monographs Vol. 69, No. 3
ature. Across herbs, leaf inclination increased toward sunnier sites, where steeply inclined foliage transpires less and suffers less heat loading, while allowing photosynthesis to proceed under a saturating level of irradiance. Leaf inclination is also expected to increase toward sandy sites, as supported by the distribution of three of the four inclination classes (Fig. 5). The shift of the mean distribution of species with the steepest leaves toward siltier sites is partly an artifact of the reduction in total herb cover in the sunniest, sandiest microsites (Fig. 1). As expected, the mean distribution of herbs with progressively taller leaves shifts toward brighter, siltier sites that support a greater density of total herb cover. Denser coverage favors taller herbs by increasing the expected photosynthetic benefit of an increment in leaf height, to be balanced against the energetic cost of building a taller stem (Givnish 1982, 1995, Tilman 1988). Finally, the differential distribution of forbs vs. graminoids might be understood in terms of the characteristic differences between these growth forms and the advantage each might yield in different environments. Forb cover increases toward siltier soils, whereas graminoids reach their peak in sunny, sandy conditions (Fig. 1). Forbs tend to have wider and more nearly horizontal leaves than graminoids, to have extensive rather than intensive root systems, and to have deeper root systems (Weaver 1954, Weaver and Albertson 1956). Consequently, we expect forb cover to be greater on fine-grained soils and graminoid cover to be greater on sunny, sandy microsites. The fall-off in forb cover toward the sunniest, sandiest microsites might reflect the lower drought tolerance of C3 forbs vs. C4 grasses. Forbs might also gain an advantage on less frequently burned microsites: their broad, often horizontal, leaves should cast shade more effectively than grass blades, and simultaneously confer greater shade tolerance. As a result, the relative abundance of forbs might increase, between fires, as they shade the grasses and sedges. However, because graminoids have basal meristems and are thus pre-adapted to regenerate rapidly following fire and/or grazing (Tainton and Mentis 1984, Anderson 1990), their relative abundance might be expected to increase immediately following fire. To the extent that fine fuels (i.e., standing dead herbaceous material) are more likely to accumulate and have low moisture content on sunny, nutrient-poor sites (Givnish 1981), the resulting increase in fire frequency would work to maintain dominance by graminoids on such sites. The Syrjala (1996) geostatistical test proved useful in evaluating differences between species and guilds along two ecological gradients simultaneously, and appears to be an important new approach to employ in direct gradient analyses involving two or more dimensions. This test showed that almost all congeneric pairs of common species in the two large genera Aster and Solidago differed significantly in their distribution with
August 1999
ECOLOGY OF OAK SAVANNA GROUND LAYERS
respect to soil texture and light availability, suggesting that competition and resource partitioning in these genera play an important role in determining species distributions. In some ways, these results generalize to two ecological dimensions the partitioning of a soil texture gradient by prairie species of Solidago (Werner 1976, Werner and Platt 1976) and the partitioning of a badger disturbance gradient by fugitive prairie plants (Platt 1975, Platt and Weis 1985).
Trends in plant species richness Upland savannas appear to have much higher levels of a, b, and g diversity than do Wisconsin upland forests and prairies surveyed by Curtis and his colleagues during the 1940s and 1950s. Because the PEL data sets were collected using different methods (often involving a single census for forested sites, which might lead to the exclusion of certain phenologically ephemeral groups), such comparisons should be viewed cautiously. However, results of these comparisons are consistent with recent findings by Pruka (1994). He compared vascular plant richness at the 1-m2 scale in prairie, savanna, woodland, and forest along a single intact gradient in south-central Wisconsin, and found that richness peaked in savanna microsites. The high diversity of midwestern oak savannas at a variety of scales, from single square meters to large portions of southern Wisconsin, is a previously unrecognized property of such communities. However, it is consistent with a number of hypotheses regarding diversity, based on environmental heterogeneity, release from dominance by C4 grasses, disturbance, and dispersal. Environmental heterogeneity has long been recognized as an important factor maintaining biological diversity (see MacArthur 1972, Abrams 1988, Huston 1994). The broken canopy of an oak savanna creates an internal mosaic, involving spatial gradients of light, soil moisture, soil organic matter, temperature, and effective rainfall (Ko and Reich 1993, Breashears et al. 1997, Dahlgren et al. 1997, Jenkins et al. 1997). As manifested by the differential distributions of individual species, pairs of congeners, and guilds based on different growth forms and/or energy capture strategies (Table 2; Figs. 1–6, 8–9), these gradients form resource spectrums that are exploited differently by each species or ecological group. As manifested by the turnover in species composition with position on both the soil and light gradients (Eq. 3), and relatively high levels of horizontal b diversity, savannas that individually or collectively embrace broader portions of those gradients will encompass more species and guilds. Certain aspects of environmental heterogeneity within a savanna are temporal in nature. As in other, more closed communities dominated by deciduous woody plants, certain conditions vary seasonally in relation to tree canopies (e.g., light availability and soil temperature at various depths). Tree canopies themselves
369
change over longer time periods, with the birth and death of branches and boles. Compared with forests or prairies, individual savannas provide a more diverse array of microsites relative to canopy coverage and associated ecological parameters, several of which may shift through seasonal or successional time. The greater patchiness of canopy coverage and associated parameters in savannas should, itself, lead to higher levels of species diversity at the a, b, and g scales; the great diversity across savannas in substrate and disturbance regime should promote high diversity at the regional (d) scale as well. Release of forbs from competition with C 4 grasses may be another factor promoting high diversity in savanna ground layers relative to prairies. In the Midwest, Andropogon gerardii, Schizachyrium scoparium, Sorghastrum nutans, and other C4 grasses often limit the growth of forbs (Powell et al. 1982, Martin et al. 1991, Howe 1995). Given that (1) forb richness is proportional to forb coverage (Fig. 2), and (2) forb richness at a given level of coverage is greater than that for graminoids (Fig. 2), any substantial increase in forb cover based on a reduction in graminoid cover should lead to an increase in overall ground-layer richness. Apparently, the partial shade cast by savanna trees suppresses the growth of C4 grasses somewhat, while providing satisfactory conditions for a large number of C3 forbs (and to a lesser extent, graminoids) adapted to a range of light levels. Summer fires appear to suppress growth by C4 grasses as well (Howe 1995). Overly dense shade, typical of fire-suppressed savannas, can decrease the diversity of both grasses and forbs (Bowles and McBride 1998). Disturbance often plays a key role in maintaining biological diversity in species-rich communities (Huston 1994). For example, grazing helps to maintain high levels of local diversity (;1-m2 scale) in European chalk grasslands by reducing coverage by tall competitive dominants (Grime 1979). Frequent fires help to promote high levels of plant diversity in pine–wiregrass savannas in North Carolina and Florida (Walker and Peet 1983, Glitzenstein et al. 1995), oak savannas in Minnesota (White 1983), and prairies in Wisconsin (Leach and Givnish 1996). Due to an internal mosaic of physical and biological conditions within savannas (e.g., fuel density, composition, flammability, and moisture content), savanna fires may be spatially and temporally patchy (Anderson and Brown 1986); as a result, they may be less uniform in their extent and intensity than the fires that frequently sweep through prairies, or rarely (but catastrophically) burn through forests. Disturbance (i.e., plant death) caused by drought may also be spatially more heterogenous in savannas than in prairies or closed forest, due to the mosaic of open and shaded microsites and the patchy distribution of tree roots. Certain forms of disturbance caused by animals might also be strongly patchy in savannas, given that many animals restrict their activity
370
MARK K. LEACH AND THOMAS J. GIVNISH
Ecological Monographs Vol. 69, No. 3
FIG. 11. Histograms of the mean distributions of ground-layer species along the PFD and sand gradients. Black bars represent the number of common species (frequency $5%) with a mean distribution in each 10th of the environmental range indicated; white bars indicate the corresponding number of rare species (frequency ,5%). For comparison, the number of quadrats falling into each 10th of the light and soil gradients (gray bars) is also plotted. Note the unimodal distributions of species’ mean locations along each environmental gradient for common species, and their divergence from the null expectation created by the distributions of quadrats. Rare species, as might be expected for taxa that occur in only a few quadrats, have distributions along each gradient that are somewhat similar to the distribution of quadrats.
to open, closed, or edge microsites, or behave differently under canopies than between canopies (Davis et al. 1995). Dispersal may be another factor promoting high diversity in savannas. Given the large range of microsites within a savanna that favor different sets of species, and given the proximity of such microsites to each other, there should be a large pool of potential migrants for any given microsite. Repeated colonization of species into microsites from which they would be excluded in the long run might so ‘‘subsidize’’ populations within microsites that their time to local extinction is increased considerably, increasing microsite diversity in an immigration–extinction balance. Savannas thus form a nearly ideal setting for testing the importance of mass effects and source–sink interactions (sensu Holt 1985, 1992, Shmida and Wilson 1985, Pulliam 1988) in helping to maintain local diversity. Many of the factors promoting high plant diversity in midwestern oak savannas may also operate, although perhaps to different degrees, in other temperate woodlands, including the remarkably diverse longleaf pine savannas and flatwoods of the southern Atlantic and Gulf Coastal Plains and wooded meadows in Estonia. In longleaf pine savannas, it appears that frequent,
nearly annual fire combines with extremely infertile soils to prevent competitive exclusion among scores of short-statured graminoids and narrow-leaved forbs in the ground layer (Walker and Peet 1983, Harcombe et al. 1993, Peet and Allard 1993). As expected, vines and broad-leaved forbs are almost absent. Frequent fires play a major role in fostering herb diversity in these communities by reducing competition from large oaks and shrubs (Glitzenstein et al. 1995). Fire can also prevent C4 grasses from excluding certain forbs (e.g., Pityopsis graminifolia), but such forbs may actually perform best during nonfire years in sites not occupied by C4 grasses (Brewer et al. 1996). Soil drainage and chemistry appear to play a large role in determining ground-layer composition among longleaf pine-dominated communities (Peet and Allard 1993). Although plant diversity in longleaf pine savannas peaks in rather open, infertile, frequently burned microsites, diversity in midwestern oak savannas peaks in shady, fertile, infrequently burned sites. In Estonia, soil infertility and frequent disturbance by mowing appear to play important roles in maintaining as many as 63 species/m 2 (Kull and Zobel 1991). Data on the differential distribution of species along light gradients within temperate and tropical savannas generally appear to be lacking.
August 1999
ECOLOGY OF OAK SAVANNA GROUND LAYERS
This study provides a potential template for future research on horizontal patterning in the composition, structure, and diversity of such mosaic communities, and is perhaps the first to quantify such characteristics, in any biome, at the whole-community level, along rigorously measured light gradients.
Biological distinctiveness of midwestern oak savannas The positive correlation of within-savanna niche breadth and the range of habitats in which a species is found suggest that the processes limiting species distributions within savannas operate across communities as well. This finding does not support Packard’s (1988a, b) hypothesis that processes unique to savannas (viz., frequent, locally catastrophic fires) select for a highly distinctive flora. However, many dominant species do reach their peak abundance in microsites with intermediate illumination (Fig. 11), consistent with the idea that there are indeed species adapted to conditions that are especially prevalent in savannas. Most of Packard’s (1988a) ‘‘oddball’’ species and ‘‘distinctive savanna species’’ (Packard 1985), hypothesized to be savanna specialists, were found among the 722 quadrats, where they typically inhabited rather closed microsites (PFD 5 36.4 6 20.3%, mean 6 1 SD ; n 5 70). Several of Curtis’ (1959) putative savanna species were joined by a much greater number of species that were thought to reach their modes in prairies or (especially) oak woodlands. These findings are consistent with Pruka’s (1994) hypothesis that Bray (1955, 1958, 1960) and Curtis (1959) greatly underestimated the distinctiveness of the savanna flora by tallying as forest specialists those species that had reached their peak abundance in oak savannas before settlement, but persisted in fire-suppressed former oak savannas (i.e., oak woodlands and forests). The finding that midwestern oak savannas are especially rich in plant species and show substantial turnover in composition along edaphic gradients (Table 3, Fig. 11) has several implications for conservation. First, any attempt to manage such savannas must maintain the ecological conditions (frequent fire, internal patchiness, low competition from C4 grasses, and propinquity of sunny and shady microsites) that appear to be responsible for maintaining high levels of local species diversity and turnover in species composition. Second, a regional strategy for savanna conservation must encompass sites with a wide range of soil textures and (presumably) disturbance regimes. Third, conservation efforts aimed at savannas may pay rich dividends in terms of plant and insect conservation, generally. On ,50 ha, in total, 22 savannas can support more than one-quarter of the entire native flora of Wisconsin, including nine plant species endangered or threatened in Wisconsin. Oak savannas and pine barrens often also support several regionally rare insects, particularly Lepidoptera such as the Karner blue, Lycaeides melissa
371
samuelis, or frosted elfin, Incisalia irus (Givnish et al. 1988, Bleser and Leach 1994). Fourth, the exceptional ground layers of intact savanna remnants, and their divergence from that seen in heavily grazed or herbicide-treated remnants, reinforces the view that identification of communities as savannas must combine floristic data with physiognomic aspect if community classifications are to protect the biological diversity that they are designed to reflect (e.g., Faber-Langendoen 1995). Finally, this study provides a new, detailed profile of savanna composition and structure, and should thus be highly valuable for efforts to conserve and/or restore these endangered ecosystems. The recognition that many savannas are not ‘‘prairies with trees,’’ but forblands with a paucity of prairie grasses in many microsites, should improve the ability of conservationists to identify fire-suppressed sites worthy of conservation and management (see Pruka 1995). Although remnant savannas with intact, species-rich ground layers are indeed extremely rare, several choked sites that might respond positively to fire-based management were seen during our reconnaissance in southern Wisconsin and northern Illinois. The exceptional potential diversity of such sites should make the widespread implementation of prescribed burns and control of alien species on such sites a high priority. ACKNOWLEDGMENTS This research was supported, in part, by NSF grants DEB9107379 and DEB-9509550 to T. J. Givnish and by a grant from the Friends of the University of Wisconsin Arboretum to T. J. Givnish and M. K. Leach. Early drafts benefited from comments by Michael Adams, Roger Anderson, John Harrington, Richard Henderson, Virginia Kline, Steven Packard, Kenneth Systma, and Donald Waller. We thank land managers and their agencies for their assistance and access to field sites: Kim Mello and Timothy Wilder (Fort McCoy Military Reservation); Nancy Braker (The Nature Conservancy), Steve Hubner (Lafayette County); Jeb Barzen (International Crane Foundation); Randy Hoffman, Mark Martin, Doris Rusch, and Reynald Zeller (Wisconsin Department of Natural Resources); Annie, Dolores, and Wallace Kamm; and Helen and Scott McGregor. Theodore Cochrane, Robert W. Frechmann, Hugh Iltis, and Harvey Ballard verified the identities of several hundred plant specimens. Kandis Elliot artistically prepared the figures. LITERATURE CITED Abrams, P. A. 1988. Resource productivity–consumer species diversity: simple models of competition in spatially heterogeneous environments. Ecology 69:1418–1433. Allen, O. N., and E. K. Allen. 1981. The Leguminosae: a source book of characteristics, uses, and nodulation. University of Wisconsin Press, Madison, Wisconsin, USA. Anderson, R. C. 1983. The eastern prairie–forest transition— an overview. Pages 86–92 in Proceedings of the Eighth North American Prairie Conference, University of Oklahoma Press, Norman, Oklahoma, USA. . 1990. The historic role of fire in North American grassland. Pages 8–18 in S. L. Collins and L. L. Wallace, editors. Fire in North American tallgrass prairies. University of Oklahoma Press, Norman, Oklahoma, USA. . 1991. Savanna concepts revisited. BioScience 41: 371. Anderson, R. C., and L. E. Brown. 1986. Stability and in-
372
MARK K. LEACH AND THOMAS J. GIVNISH
stability in plant communities following fire. American Journal of Botany 73:364–368. Anderson, R. C., D. Schmidt, M. R. Anderson, and D. Gustafson. 1994. Parklands savanna restoration. Pages 275– 278 in J. S. Fralish, R. C. Anderson, J. E. Ebinger, and R. Szafoni, editors. Proceedings of the North American Conference on Barrens and Savannas. U.S. Environmental Protection Agency, Chicago, Illinois, USA. Bjo¨rkman, O. 1981. Responses to different quantum flux densities. Pages 57–107 in O. L. Lange, P. S. Nobel, C. B. Osmond, and H. Ziegler, editors. Physiological plant ecology. I. Responses to the physical environment. Encyclopedia of Plant Physiology, New Series. Volume 12A. Springer-Verlag, Berlin, Germany. Bleser, C., and M. K. Leach. 1994. Protecting the Karner blue butterfly in Wisconsin: shifting focus from individuals to populations and processes. Pages 139–142 in J. S. Fralish, R. C. Anderson, J. E. Ebinger, and R. Szafoni, editors. Proceedings of the North American Conference on Barrens and Savannas. U.S. Environmental Protection Agency, Chicago, Illinois, USA. Bowles, M. L., and J. L. McBride. 1998. Vegetation composition, structure, and chronological change in a decadent midwestern North America savanna remnant. Natural Areas Journal 18:14–27. Brady, N. C. 1974. The nature and properties of soils. Eighth edition. Macmillan, New York, New York, USA. Bray, J. R. 1955. The savanna vegetation of Wisconsin and an application of the concepts of order and complexity to the field of ecology. Dissertation. University of Wisconsin, Madison, Wisconsin, USA. . 1958. The distribution of savanna species in relation to light intensity. Canadian Journal of Botany 36:671–681. . 1960. The composition of savanna vegetation in Wisconsin. Ecology 41:721–732. Breashears, D. D., P. M. Rich, F. J. Barnes, and K. Campbell. 1997. Overstory-imposed heterogeneity in solar radiation and soil moisture in a semiarid woodland. Ecological Applications 7:1201–1215. Brewer, J. S., W. J. Platt, J. S. Glitzenstein, and D. R. Streng. 1996. Effects of fire-generated gaps on growth and reproduction of golden aster (Pityopsis gaminifolia). Bulletin of the Torrey Botanical Club 123:295–303. Brown, W. V. 1977. The Kranz syndrome and its subtypes in grass systematics. Memoirs of the Torrey Botanical Club 23:1–97. Chazdon, R. L. 1988. Sunflecks and their importance to forest understory plants. Advances in Ecological Research 18: 1–63. Chazdon, R. L., and C. B. Field. 1987. Photographic estimations of photosynthetically active radiation: evaluation of a computerized technique. Oecologia 73:525–532. Chazdon, R. L., R. W. Pearcy, D. W. Lee, and N. Fetcher. 1996. Photosynthetic responses of tropical forest plants to contrasting light environments. Pages 5–55 in S. S. Mulkey, R. L. Chazdon, and A. P. Smith, editors. Tropical forest plant ecophysiology. Chapman and Hall, New York, New York, USA. Curtis, J. T. 1959. The vegetation of Wisconsin. University of Wisconsin Press, Madison, Wisconsin, USA. Dahlgren, R. A., M. J. Singer, and X. Huang. 1997. Oak tree and grazing impacts on soil properties and nutrients in a California oak woodland. Biogeochemistry 39:45–64. Davis, M. A., B. Ritchie, N. Graf, and K. Gregg. 1995. An experimental study on the effects of shade, conspecific crowding, pocket gophers, and surrounding vegetation on survivorship, growth, and reproduction in Penstemon grandiflorus. American Midland Naturalist 134:237–243. Faber-Langendoen, D. 1995. The Nature Conservancy’s Natural Community Classification and its application to Mid-
Ecological Monographs Vol. 69, No. 3
west oak savannas and woodlands. Pages 65–76 in M. K. Leach and L. Ross, editors. Midwest Oak Ecosystem Recovery Plan, Midwest Oak Savanna and Woodland Ecosystems Conference. Springfield, Missouri, USA. Field, C., and H. A. Mooney. 1986. The photosynthesis– nitrogen relationship in wild plants. Pages 25–55 in T. J. Givnish, editor. On the economy of plant form and function. Cambridge University Press, Cambridge, UK. Givnish, T. J. 1979. On the adaptive significance of leaf form. Pages 375–407 in O. T. Solbrig, P. H. Raven, S. Jain, and G. B. Johnson, editors. Topics in plant population biology. Columbia University Press, New York, New York, USA. . 1981. Serotiny, geography, and fire in the Pine Barrens of New Jersey. Evolution 35:101–123. . 1982. On the adaptive significance of leaf height in forest herbs. American Naturalist 120:353–381. . 1987. Comparative studies of leaf form: assessing the relative roles of selective pressures and phylogenetic constraints. New Phytologist 106:131–160. . 1988. Adaptation to sun and shade: a whole-plant perspective. Australian Journal of Plant Physiology 15:63– 92. . 1989. Ecology and evolution of carnivorous plants. Pages 243–290 in W. G. Abrahamson, editor. Plant–animal interactions. McGraw-Hill, New York, New York, USA. . 1995. Plant stress: biomechanical adaptation for energy capture and influence on species distribution. Pages 3–49 in B. L. Gartner, editor. Plant stems: physiology and functional morphology. Chapman and Hall, New York, New York, USA. Givnish, T. J., E. W. Menges, and D. F. Schweitzer. 1988. Minimum-area requirements for long-term conservation of the Albany Pine Bush and the Karner blue butterfly. Published report to Malcolm Pirnie, Incorporated and the City of Albany, New York, USA. Gleason, H. A. 1913. The relation of forest distribution and prairie-fires in the Middle West. Bulletin of the Torrey Botanical Club 13:173–181. . 1923. The vegetational history of the Middle West. Annals of the Association for American Geography 12:39– 83. Gleason, H. A., and A. Cronquist. 1991. Manual of vascular plants of northeastern United States and adjacent Canada. Second edition. New York Botanical Garden, New York, New York, USA. Glitzenstein, J. S., W. J. Platt, and D. R. Streng. 1995. Effects of fire regime and habitat on tree dynamics in north Florida longleaf pine savannas. Ecological Monographs 65:441– 476. Greig-Smith, P. 1983. Quantitative plant ecology. Third edition. Blackwell Scientific, Oxford, UK. Grime, J. P. 1979. Plant strategies and vegetation processes. Wiley, New York, New York, USA. Grime, J. P., and R. Hunt. 1975. Relative growth rate: its range and adaptive significance in a local flora. Journal of Ecology 63:393–422. Grimm, E. C. 1983. Chronology and dynamics of vegetation change in the prairie–woodland region of southern Minnesota, U.S.A. New Phytologist 93:311–350. . 1984. Fire and other factors controlling the Big Woods vegetation of Minnesota in the mid-nineteenth century. Ecological Monographs 53:291–311. Haney, A., and S. I. Apfelbaum. 1990. Structure and dynamics of Midwest oak savannas. Pages 19–30 in J. M. Sweeney, editor. Management of dynamic ecosystems. North Central Section, The Wildlife Society, West Lafayette, Indiana, USA. Harcombe, P. A., J. S. Glitzenstein, R. G. Knox, S. L. Orzell, and E. L. Bridges. 1993. Vegetation of the longleaf pine
August 1999
ECOLOGY OF OAK SAVANNA GROUND LAYERS
region of the west Gulf Coastal Plain. Proceedings of the Tall Timbers Fire Ecology Conference 16:83–104. Heckathorn, S. A., and E. H. DeLucia. 1991. Effect of leaf rolling on gas exchange and leaf temperature of Andropogon gerardii and Spartina pectinata. Botanical Gazette 152:263–268. Hole, F. D. 1976. Soils of Wisconsin. University of Wisconsin Press, Madison, Wisconsin, USA. Holt, R. D. 1985. Population dynamics in two-patch environments: some anomalous consequences of an optimal habitat distribution. Theoretical Population Biology 28: 181–208. . 1992. A neglected facet of island biogeography: the role of internal spatial dynamics in area effects. Theoretical Population Biology 41:354–371. Howe, H. F. 1995. Succession and fire season in experimental prairie plantings. Ecology 76:1917–1925. Hujik, P. M. 1995. Lowland savannas: groundlayer composition and distribution in relation to elevation and light. Thesis. University of Wisconsin, Madison, Wisconsin, USA. Huston, M. A. 1994. Biological diversity. Cambridge University Press, New York, New York, USA. Izaguirre Mayoral, M. L., A. I. Vivas, and T. Oropeza. 1995. New insights into the symbiotic performance of native tropical legumes. 1. Analysis of the response of thirty-seven native legume species to artificial shade in a neotropical savanna. Symbiosis 19:111–129. Jenkins, S. E., R. Guyette, and A. J. Rebertus. 1997. Vegetation–site relationships and fire history of a savanna– glade–woodland mosaic in the Ozarks. Pages 184–201 in S. G. Pallardy, R. A. Cecich, H. G. Garret, and P. S. Johnson, editors. Proceedings of the 11th Central Hardwood Forest Conference, Univeristy of Missouri, Columbia, Missouri, USA. Kindscher, K. 1992. Rockefeller prairie: a case study on the use of plant guild classification of a tallgrass prairie. Pages 123–140 in R. G. Wickett, P. D. Lewis, A. Woodliffe, and P. Pratt, editors. Spirit of the land: our prairie legacy. Proceedings of the 13th North American Prairie Conference, Department of Parks and Recreation, Windsor, Ontario, Canada. Ko, L. J., and P. B. Reich. 1993. Oak tree effects on soil and herbaceous vegetation in savannas and pastures in Wisconsin. American Midland Naturalist 130:31–42. Kull, K., and M. Zobel. 1991. High species richness in an Estonian wooded meadow. Journal of Vegetation Science 2:715–718. Leach, M. K. 1996. Gradients in groundlayer composition, structure, and diversity in remnant and experimentally restored oak savannas. Dissertation. University of Wisconsin, Madison, Wisconsin, USA. Leach, M. K., and T. J. Givnish. 1996. Ecological determinants of species loss in remnant prairies. Science 273: 1555–1558. Leach, M. K., and L. Ross, editors. 1995. Midwest Oak Ecosystem Recovery Plan. Midwest Oak Savanna and Woodland Conference, Springfield, Missouri, USA. MacArthur, R. M. 1972. Geographical ecology. Harper and Row, New York, New York, USA. Magurran, A. E. 1988. Ecological diversity and its measurement. Princeton University Press, Princeton, New Jersey, USA. Martin, C. E., F. S. Harris, and F. J. Norman. 1991. Ecophysiological responses of C3 forbs and C4 grasses to drought and rain on a tallgrass prairie in northeastern Kansas. Botanical Gazette 152:257–262. McCune, B., and M. J. Mefford. 1997. PC-ORD: multivariate analysis of ecological data. Version 3.0. MjM Software Design, Gleneden Beach, Oregon, USA.
373
Mead, S. B. 1846. Catalogue of plants growing spontaneously in the state of Illinois, the principal part near Augusta, Hancock County. The Prairie Farmer 6:15–36; 60; 93; 119– 122. Mendelson, J., S. P. Aultz, and J. D. Mendelson. 1992. Carving up the woods: savanna restoration in northeastern Illinois. Restoration and Management Notes 10:127–131. Minchin, P. R. 1987. An evaluation of the relative robustness of techniques for ecological ordination. Vegetatio 69:89– 107. Nuzzo, V. 1986. Extent and status of Midwest oak savanna: presettlement and 1985. Natural Areas Journal 6:6–36. Packard, S. 1988a. Rediscovering the tallgrass savanna of Illinois. In A. Davis and G. Stanfore, editors. The prairie: roots of our culture, foundation of our economy. Proceedings of the 10th North American Prairie Conference, Denton, Texas, USA. . 1988b. Just a few oddball species: restoration and the rediscovery of the tallgrass savanna. Restoration and Management Notes 6:13–20. . 1993. Restoring oak ecosystems. Restoration and Management Notes 11:5–16. Pearcy, R. W. 1988. Photosynthetic utilization of lightflecks by understory plants. Australian Journal of Plant Physiology 15:223–238. Pearcy, R. W., and J. Ehleringer. 1984. Comparative ecophysiology of C3 and C4 plants. Plant Cell and Environment 7:1–13. Peet, R. K., and D. J. Allard. 1993. Longleaf pine vegetation of the southern Atlantic and eastern Gulf Coast regions: a preliminary classification. Proceedings of the Tall Timbers Fire Ecology Conference 16:45–81. Platt, W. J. 1975. The colonization and formation of equilibrium plant species associations on badger disturbances in a tall-grass prairie. Ecological Monographs 45:285–305. Platt, W. J., and I. M. Weis. 1985. An experimental study of competition among fugitive prairie plants. Ecology 66: 708–720. Powell, J., J. F. Stritzke, R. W. Hammond, and R. D. Morrison. 1982. Weather, soil and 2,4-D effects on tallgrass prairie in Oklahoma, USA. Journal of Range Management 35:483– 488. Pruka, B. W. 1994. Distribution of understory plant species along light and soil depth gradients in an upland oak savanna remnant in southern Wisconsin. Thesis. University of Wisconsin, Madison, Wisconsin, USA. . 1995. Lists indicate recoverable oak savannas and open oak woodlands in southern Wisconsin. Restoration and Management Notes 13:124–126. Pulliam, H. R. 1988. Sources, sinks, and population regulation. American Naturalist 132:652–661. Rebertus, A. J., and B. R. Burns. 1997. The importance of gap processes in the development and maintenance of oak savannas and dry forests. Journal of Ecology 85:635–645. Reich, P. B., M. B. Walters, and D. S. Ellsworth. 1992. Leaf life-span in relation to leaf, plant, and stand characteristics among diverse ecosystems. Ecological Monographs 62: 365–392. Shmida, A., and M. V. Wilson. 1985. Biological determinants of species diversity. Journal of Biogeography 12:1–20. Syrjala, S. E. 1996. A statistical test for a difference between the spatial distributions of two populations. Ecology 77: 75–80. Tainton, N. M., and M. T. Mentis. 1984. Fire in grassland. Pages 117–147 in P. de Van Booysen and N. M. Tainton, editors. Ecological effects of fire in South African ecosystems. Springer-Verlag, New York, New York, USA. Teramura, A. H., W. G. Gold, and I. N. Forseth. 1991. Physiological ecology of mesic, temperate woody vines. Pages 245–286 in F. E. Putz and H. A. Mooney, editors. The
374
MARK K. LEACH AND THOMAS J. GIVNISH
biology of vines. Cambridge University Press, New York, New York, USA. Tester, J. R. 1989. Effects of fire frequency on oak savanna in east-central Minnesota. Bulletin of the Torrey Botanical Club 116:134–144. . 1995. Minnesota’s natural heritage. University of Minnesota Press, Minneapolis, Minnesota, USA. Tilman, D. 1988. Plant strategies and the dynamics and structure of plant communities. Princeton University Press, Princeton, New Jersey, USA. Valladares, F., M. T. Allen, and R. W. Pearcy. 1997. Photosynthetic responses to dynamic light under field conditions in six tropical rainforest shrubs occurring along a light gradient. Oecologia 111:505–514. Walker, J., and R. K. Peet. 1983. Composition and species diversity of pine–wiregrass savannas of the Green Swamp, North Carolina. Vegetatio 55:163–179. Weaver, J. E. 1954. North American prairie. Johnsen Press, Lincoln, Nebraska, USA.
Ecological Monographs Vol. 69, No. 3
Weaver, J. E., and F. W. Albertson. 1956. Grasslands of the Great Plains. Johnsen Press, Lincoln, Nebraska, USA. Werner, P. A. 1976. Ecology of plant populations in successional environments. Systematic Botany 1:246–268. Werner, P. A., and W. J. Platt. 1976. Ecological relationships of co-occurring goldenrods (Solidago: Compositae). American Naturalist 110:959–971. White, A. S. 1983. The effects of thirteen years of annual prescribed burning in a Quercus ellipsoidalis community in Minnesota. Ecology 64:1081–1085. White, J., and M. Madany. 1978. Classification of natural communities in Illinois. Illinois Natural Areas Inventory Technical Report. Illinois Department of Conservation, Springfield, Illinois, USA. Whittaker, R. H. 1972. Evolution and measurement of species diversity. Taxon 21:213–251. Wisconsin DNR (Department of Natural Resources). 1993. Guide to Wisconsin’s endangered and threatened plants. PUBL-ER-067, Department of Natural Resources, Madison, Wisconsin, USA.