Graphical Representations and Infinite Virtual Worlds in a Logic and Functional Programming Course J. E. Labra Gayo Department of Computer Science, University of Oviedo C/ Calvo Sotelo S/N, 3307, Oviedo, Spain
[email protected]
Abstract. The assignment scheme of our Logic and Functional Programming course has adopted the generation of graphical representations, quadtrees and octrees to teach the different features of this kind of languages: higher order functions, lazy evaluation, polymorphism, logical variables, constraint satisfaction, etc. The use of standard XML vocabularies: SVG for graphics and X3D for virtual worlds enables to have numerous visualization tools. We consider that the incorporation of these exercises facilitates teaching and improves the motivation of students.
1
Introduction
The Logic and Functional Programming course is given as an elective course of 60 hours to third year undergraduate students in Computer Science Engineering at the University of Oviedo. The rest of programming courses is based on imperative languages like Pascal, C, C++ and Java. In this way, our course is the first, and sometimes the only, contact that our students have with declarative languages. Given its elective nature, the course survival depends on the number of registered students. Apart from the intrinsic difficulty of programming courses, the choice of students is conditional on several aspects related with this kind of languages: poor programming environments, lack of graphical and intuitive debugging and tracing systems, lack of libraries or difficulties to link with libraries written in different languages, etc. With the main goal of increasing students motivation and course scope we have developed the IDEFIX Project [17] since course 2000/2001, which is focused on the development of an Internet based platform for teaching multiparadigm programming languages. The course devotes 45 hours to theoretical presentations and 15 hours to programming assignments. In this paper, we just describe the programming assignment scheme, which is based on the use of XML vocabularies that include bidimensional graphics in SVG and virtual worlds in X3D. These assignments follow an incremental presentation scheme using the taxonomy of cognitive goals [15]:
firstly, we present a correct program that the students have to compile and execute. Secondly, we ask them to make some modifications to the program so they learn by imitation a basic understanding of program construction. Finally, we ask them to create a new program by themselves. The paper begins with a brief overview of these XML vocabularies. In the next section we present the first basic exercise consisting of the development a XML generation library. In section 3 we present the next exercise which allows to generate graphical function representations using higher order functions. In section 4 we study the quadtree recursive structure. In section 5 we present octrees and in section 6 we present the manipulation of infinite virtual worlds using lazy evaluation. In section 7 we describe the creation of polymorphic datatypes. Section 8 describes the use of logic programming features (logical variables and non-determinism) and in the next section we solve the quadtree coloring problem using constraints. Notation. Along the paper, we use Haskell and Prolog syntax. We suppose that the reader is familiar with these languages.
2
XML Vocabularies
XML [5] is becoming a standard for Internet information exchange and representation. One of the first assignments is to develop a small library for XML generation. This library will allow the students to have a common base for the rest of exercises and as it only requires string manipulation, it can serve as a simple familiarization with declarative languages. The library must contain the following functions: – empty e as generates an empty element e with attributes as. – gen e es generates element e with subelements es – genAs e as es generates element e with attributes as and subelements es The above functions could be implemented as: empty :: String → [ ( String , String ) ] → String empty e a s = ”” gen :: String → String → String gen e c = genAs e [ ] c genAs :: String → [ ( String , String ) ] → String → String genAs e a s c = ”” ++ c ++ ”” p u t At t s = concat . map f where f ( v , n ) = ” ” ++ v ++ ”=\”” ++ n ++ ” \” ”
2
One of the specific XML vocabularies that will be used is SVG [3] which is becoming the main standard for Internet graphics. Also, VRML (Virtual Reality Modelling Language) can be considered the main standard to represent Internet virtual worlds. However, as this standard precedes XML and does not follow its syntax, since year 2000 the Web3D consortium has developed X3D [2], which can be considered as a new VRML adapted to XML plus some new features.
3
Higher order functions: Graphical Representations
The second assignment is the development of graphical representations of functions. We present them the function plotF which stores in a SVG file the graphical representation of a function: p l o t F :: ( Double → Double ) → String → IO ( ) p l o t F f f n = writeFile f n ( p l o t f ) p l o t f = gen ” svg ” ( p l o t P s ps ) where plotPs = concat . map m k line m k li n e ( x , x ’ ) = l i n e ( p x ) ( p x ’ ) ps = zip l s ( t a i l l s ) ls = [ 0 . . sizeX ] p x = ( x0+x , s i z e Y − f x ) l i n e ( x , y ) ( x ’ , y ’ ) = empty ” l i n e ” [ ( ” x1 ” ,show x ) , ( ” y1 ” ,show y ) , ( ” x2 ” ,show x ’ ) , ( ” y2 ” ,show y ’ ) ] s i z e X = 500 s i z e Y = 500 x0 = 10
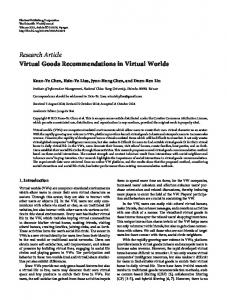
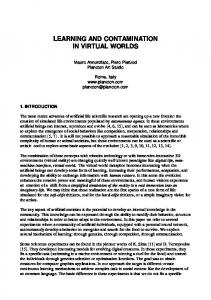
Notice that plotF does Input/Output actions. Traditionally, most of the courses that teach purely declarative languages try to delay the presentation of the IO system. We consider that a more incremental presentation of this system avoids future misunderstandings. Since when delayed it in previous years, a lot of students found strange its introduction in a language that they were told to be pure. The source code of the plotF function also serves as an example that uses the recursive combinators zip, map, foldr, etc. that characterize Haskell. In this assignment, the proposed exercises use the concept of higher order functions, which is a key concept of functional programming languages. For example, we ask the student to build a function plotMean that writes in a file the graphical representation of two functions and their mean. In figure 1 we show the mean of (\x →10 ∗ sin x) and (\x →10 + sqrt x). The code to represent the mean function is as simple as: mean f g = p l o t F ( \ x → ( f x + g x ) / 2 )
3
Fig. 1. Graphical representation of 2 functions and their mean
4
Recursive Datatypes: Quadtrees
The next didactic unit is centered on the definition of recursive datatypes and their manipulation. The traditional assignments used the predefined datatype of lists and defined a new datatype of binary trees. Usually, the students had serious difficulties to understand these recursive definitions and are usually not motivated by these exercises [11, 20]. In order to increase their motivation we use the concept of quadtrees [19], which are recursive structures that can represent pictures and have numerous practical applications. In a quadtree, pictures are represented by a unique color or by the division of the picture in four quadrants which are quadtrees. The generalization of quadtrees to three dimensions are called octrees, as they divide the cube in eight parts. These structures are widely used in computer science because they allow to optimize the internal representation of scenes and tridimensional databases for geographical information systems. In Haskell, a quadtree can be represented using the following datatype: data C o l o r = RGB Int Int Int data QT = B C o l o r | D QT QT QT QT
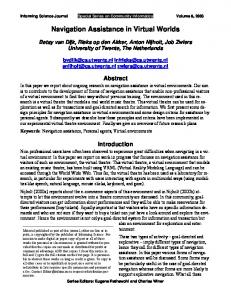
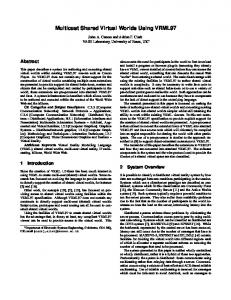
An example of a quadtree could be: exQT = D r g g (D r g g r ) where r = B (RGB 2 5 5 0 0 ) g = B (RGB 0 2 5 5 0 )
The above example is represented in figure 2. Quadtree visualization is made using SVG files which are generated using the functions empty, gen and genAs implemented by students for XML file generation. type P o i n t = ( Int , Int ) type Dim = ( Point , Int )
4
Fig. 2. Example of quadtree
wQt :: QT → FileName → IO ( ) wQt q f n = writeFile f n ( gen ” svg ” ( sh ( ( 0 , 0 ) , 5 0 0 ) q ) ) sh :: Dim → QT → String sh ( ( x , y ) , d ) ( B c ) = r e c t ( x , y ) ( x+d+1 ,y+d +1) c sh ( ( x , y ) , d ) (D u l ur d l dr ) = l e t d2 = d ‘ div ‘ 2 in i f d