INT. J. BIOAUTOMATION, 2015, 19(2), 245-258
Hand Vein Images Enhancement Based on Local Gray-level Information Histogram Jun Wang, Guoqing Wang*, Ming Li, Wenkai Du, Wenhui Yu School of Information and Electrical Engineering China University of Mining and Technology Xuzhou, 221110, China E-mails:
[email protected],
[email protected],
[email protected],
[email protected],
[email protected] *
Corresponding author
Received: January 03, 2015
Accepted: June 18, 2015 Published: June 30, 2015
Abstract: Based on the Histogram equalization theory, this paper presents a novel concept of histogram to realize the contrast enhancement of hand vein images, avoiding the lost of topological vein structure or importing the fake vein information. Firstly, we propose the concept of gray-level information histogram, the fundamental characteristic of which is that the amplitudes of the components can objectively reflect the contribution of the gray levels and information to the representation of image information. Then, we propose the histogram equalization method that is composed of an automatic histogram separation module and an intensity transformation module, and the histogram separation module is a combination of the proposed prompt multiple threshold procedure and an optimum peak signal-to-noise (PSNR) calculation to separate the histogram into small-scale detail, the use of the intensity transformation module can enhance the vein images with vein topological structure and gray information preservation for each generated sub-histogram. Experimental results show that the proposed method can achieve extremely good contrast enhancement effect. Keywords: Contrast enhancement, Gray-level information equalization, Vein topological structure, Image quality evaluation.
histogram,
Histogram
Introduction Hand-vein recognition as a newly and emergent modality for biometric authentication has attracted increasing attention in recent years. And the feature we adopt is the subcutaneous tissue that forms a network with a high random manner [16]. Compared with other traditional biometric characteristics (such as face, iris, fingerprints, hand-gesture), hand vein is superior in stability, uniqueness, active liveness and permanence. Furthermore, the hand-vein based identification systems can be immune to counterfeit hands and noninvasive to users in practice. As veins mainly course under the human skin, hand-vein patterns should be illuminated by near infrared (NIR) lights and captured by image sensors in a transillumination manner. Due to the light attenuation in biological mediums, the irradiation power are always in great degrading condition which directly results in poor quality of hand vein images with extremely low contrast, as shown in Fig. 1. In order to improve the clarity of hand-vein patterns effectively, hand-vein image enhancement thus plays a crucial role in hand-vein recognition. Image enhancement techniques can be used to improve the visual appearance of an image, or to convert an image to form better suited to the subsequent processing, such as segmentation, feature extraction, detection and recognition. Our group has conducted a deep research on this subject, many methods have been hitherto proposed. For instance: adaptive histogram 245
INT. J. BIOAUTOMATION, 2015, 19(2), 245-258
equalization method [9], morphological method [10], line-tracking method [12], curvature-based method [12], and transformation-based methods [4, 17-19]. One of the most popular methods for image contrast enhancement but has never been mentioned in hand-vein images enhancement is Global Histogram Equalization (GHE), which attempts to alter the gray-level histogram of an image to closely match a uniform distribution. Although the GHE method [6] is simple and fast, its performance is not good and effective enough in many cases due to its intrinsic limitations, such as the mean-shift problem (i.e. the mean brightness of the output image is significantly different from the input image which may result in false recognition) and we have also found that it cannot adapt to local brightness which causes limitations in the amount of contrast enhancement in some parts of the image [2].
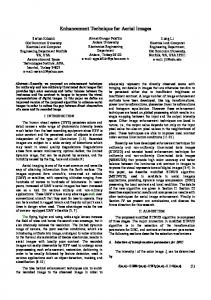
(a) (b) (c) Fig. 1 Vein images with extremely low contrast: (a) the finger vein image, (b) the dorsal vein image and (c) the palm vein image To overcome the aforementioned drawbacks, many variants of histogram equalization have been proposed [1, 3, 5, 7-8, 11, 14]. In order to preserve the resulting image’s brightness and detailed feature, Kim proposed Brightness Preserving Bi-Histogram Equalization (BPBHE) [7]. This method first separates the input images into two sub-histograms based on the mean of the input image’s brightness and then the two sub-histograms are equalized independently. Later, Chen and Ramli proposed an optimal extension of BPBHE, called Minimum Mean Brightness Error Bi-Histogram Equalization (MMBEBHE) [1]. This method separates the histogram using the threshold that would yield minimum brightness difference between the input image and the output image. Other solutions can be found in [5, 8, 11, 14]. A direct extension of GHE is termed local histogram modification. In order to efficiently improve the visibility of the small-scale detail (the veins), local histogram modification techniques independently equalize each sub-histogram on the basis of histogram separation. However, local histogram modification techniques sometimes cause over-enhancement and noise-enhancing artifacts and also fake vein information in some portion of an image. A good contrast enhancement technique especially for the low contrast biological images for recognition should specially address several significant properties according to the criterion we set, some of which are listed below: (1). Noise tolerance: The contrast enhancement technique should exhibit appropriate noise immunity. (2). Partial contrast: The contrast enhancement technique should provide special enhancement for the certain detailed area of the hand vein according to the later process demand.
246
INT. J. BIOAUTOMATION, 2015, 19(2), 245-258
(3). Basic vein topological structure preservation: The enhancement technique should enhance the contrast of the hand vein image without losing the basic topological structure information. (4). Convenient implementation: The contrast enhancement technique should be able to set up quickly and reliably according to the technology demand. In this paper, a novel contrast enhancement method based on the self-designed gray-level information histogram is proposed to enhance the contrast of the hand vein images without losing the original vein topological structure information and importing the fake vein information. It is expected to eliminate the abovementioned drawbacks of the conventional global-based and local-based histogram modification methods effectively. The proposed method can be briefly described as follows: (1). Obtaining the gray-level information histogram, the components amplitudes of which can objectively reflect the contribution of the gray levels to the representation of image information. (2). Separation of the gray-level information histogram with the proposed multiple thresholding procedure by using a prompt mean function and standard deviation. (3). Achievement of the contrast enhancement by equalizing sub-histograms in small-scale and certain detail. Experimental results show that the proposed method gives more accurate and satisfactory results than other classical histogram-based methods without importing fake vein information and realizing the result of good contrast enhancement on the important and basic detailed region to get higher recognition rate, the performance of the proposed method will be demonstrated through the self-designed estimated parameters and recognition rate by template matching method. The rest of the paper is divided into Sections 2-5. In Section 2, we present the forming procedure of the self-designed gray-level information histogram. Section 3 describes the proposed contrast enhancement method based on the self-designed gray-level information histogram. Section 4 presents the comparison of the experimental results of the proposed method and some of the other existing methods. Our concluding remarks are presented in Section 5.
Gray-level information histogram Construction of gray-level information histogram The gray-level information histogram is constructed as follows: (1). Smooth the hand vein image with a Gaussian filter mask to mitigate the possible noise influence. This can be performed into different and small scales, by varying the size of the filter mask which corresponds to the variance of the Gaussian function. (2). Calculate the gradient magnitude at each pixel using equations similar to the Canny edge detector. A 3×3 pixel gradient operator is described by the pixel numbering convention of Fig. 2. The square root gradient is defined as: 1/2
2 2 G x, y GR x, y GC x, y
(1)
247
INT. J. BIOAUTOMATION, 2015, 19(2), 245-258
where GR x, y and GC x, y are the row gradient and the column gradient at respectively: 1 GR x, y A2 2 A3 A4 A6 2 A7 A0 4 1 GC x, y A0 2 A1 A2 A4 2 A5 A6 4 A0
A1
A7
B x, y
A6
A5
x, y ,
(2) (3) A2 A3 A4
Fig. 2 Numbering convention for gradient calculation (3). Divide the original hand vein image captured by the self-designed device as shown in Fig. 3 into a proper number of equal-sized regions (i.e., default five regions), according to ascending order of their intensities of gradient. Each pixel location in the original image has a specific statistical weighting coefficient depending on its specific gradient magnitude. The coefficients are determined as follows:
W x, y
w1
if G x, y T1
w2 if T1 G x, y T2
w3 if T2 G x, y T3
(4)
,
w4 if T3 G x, y T4 w5
otherwise
where Ti i 1, 2, 3, 4 denotes the limits of the gradient intervals, wi i 1, 2, 3, 4, 5 is the statistical weighting coefficients (usually w1 w2 w3 w4 w5 due to the different contribution to the hand vein images contrast enhancement, the next half of Section 2 will discuss how to determine the optimal weighting coefficients).
Fig. 3 Self-designed vein capture device (4). Compute the cumulative summation of the weighted statistical values of each gray level in different detailed regions: 5
N r wi ni r ,
(5)
i 1
248
INT. J. BIOAUTOMATION, 2015, 19(2), 245-258
where ni r is the number of pixels at the gray level r in a certain region. N r is the summation of all weighted statistical values of the gray level r in the five regions. It should be pointed out that the standard histogram is a special case of our new histogram, that is, when w1 w2 w3 w4 w5 1 , the components of the two types of histograms have the same value.
Determination of the optimal parameters In the previous paragraph, we describe the basic procedure of constructing the new histogram. In order to obtain desired histogram shape for image contrast enhancement, several problems we met should be solved to get better enhancement result. Here, we list these problems as follows: (1). How to choose a proper number of the equal-sized regions. (2). How to choose a robust and precise method to evaluate the distribution of the detailed vein information. (3). How to choose the optimal weighting coefficients. As mentioned previously, we use a default value (i.e., 5) as the total number of the divided regions. The choice of this number is also based on the fact that the percentage area of the detailed regions in the entire image is usually in the changing range of 20-80% (e.g., the detailed region covers nearly 20% area in the simple hand dorsal vein images (Fig. 1b), but, over 70% in the palm vein image with rich vein information, as shown in Fig.1c. We choose the lowest limit (i.e., 20%) as the size of the region, and therefore the corresponding total number of regions is five. Moreover, from multiple trials, we found that the resulting histogram shape is not very sensitive to the number of the regions if the number is over 4, and a large number of divided regions would cost more computationally. The next problem is to develop a robust and precise method to evaluate the distribution of details in the captured vein images. This is important because it can provide useful information for estimating the regions’ contribution for the vein image enhancement. Here, we propose a simple solution: we use the Canny edge detection technique to evaluate the distribution of the details. The Canny edge detection algorithm is a robust and accurate edge detection method. The motivation for this solution is that if a region contains many details, it generally has the larger number of edge points. In other words, the amount of the detailed information is equivalent to the number of edge points. Therefore, the distribution of details in different regions is executed as follows: (1) detect the edge of the hand vein images using the Canny edge detection operator; (2) count the number of edge points in different regions. Test examples are given in Fig. 4 on the hand dorsal vein images of the database. The results of edge detection are shown in Fig. 4a-c. The number of edge points in different regions is listed in Table 1. The final problem is how to choose appropriate weighting coefficients in order to perform the weighting process to yield a desired histogram shape for vein image contrast enhancement. One can specify these coefficients in an empirical way to yield satisfactory results, but this precludes the new histogram from being applied in many cases in which full automatic processing are needed. Furthermore, since there are five parameters, direct trial-and-error requires a lot of work. Here, we developed a simple method to overcome this problem. Our idea is to normalize the number of the edge points in different regions to generate their corresponding weighting coefficients. The equation can be represented as follows:
249
INT. J. BIOAUTOMATION, 2015, 19(2), 245-258
wi
Ni , i 1, ..., 5 , N5
(6)
where N i is the number of edge points in region i, N 5 denotes the number of edge points in Region 5 which contains the biggest number of edge points.
(a) (b) (c) Fig. 4 Test examples of dorsal hand vein image: (a) the enhanced dorsal hand vein image, (b) the corresponding edge detection result and (c) segmentation result of the proposed Region 5 Table 1. The number of edge points in the different proposed 5 regions Dorsal hand vein
Region 1 0
Region 2 0
Region 3 2
Region 4 25
Region 5 36
Using Eq. (6), normalized weighting coefficients for Fig. 5a-c are calculated and listed in Table 2. The later process results show that it is worth nothing that these results agree well with those of visual perception. Table 2. Normalized weighting coefficients for different proposed5 regions
Dorsal hand vein
1
2
3
4
5
0
0
0.06
0.69
1
Here, we have given the detailed procedure of constructing the gray-level information histogram, the fundamental characteristics of which is that the amplitudes of its components can objectively reflect the contribution of the gray levels to the representation of the image information, and it is of great significance for the later enhancement for the information-based images including the vein images.
The proposed contrast enhancement method based on the self-designed gray-level information histogram In this section, we propose a novel contrast enhancement method based on the previously proposed gray-level information histogram, which involves two important modules: a histogram separation module and an intensity transformation module. First, the proposed histogram separation module is a combination of the proposed prompt multiple thresholding procedure and an optimum PSNR calculation to separate the histogram in small-scale detail. As the final step of the proposed process, the use of the intensity transformation module can enhance the image with vein topological structure and brightness preservation for each generated sub-histogram.
250
INT. J. BIOAUTOMATION, 2015, 19(2), 245-258
Gray-level histogram separation Each M N discrete input image I xy can be defined as an M-by-N matrix, where xy denotes an arbitrary pixel in the spatial domain. The matrix of the original vein image I xy is expressed as follows:
I 0,0 I xy I M 1,0
I 0, N 1 I M 1, N 1
(7)
(1) Prompt multiple threshold selection: Suppose that an input image I is composed of G discrete intensity levels: thus, the statistical histogram of an input image I is expressed as follows:
H h nh , h 0, 1, 2, ..., G 1
(8)
Note that nh represents the number of pixels that correspond to the intensity h of the input image I. Based on the statistical histogram H of the input image I, the mean value can be calculated using the following mean function: b
h H h ha
(9)
b
H h ha
After the mean value is calculated, the standard deviation function is expressed as follows: 1/2
b h 2 H h h a b h aH h
(10)
Notice that [a, b] represents the interval of calculation, which is initialized as [0, 255]. According to the calculated mean value and standard deviation, three threshold values, , and , can be defined to further separate the histogram. (2) Optimum recursion level: For each recursion level, the low boundary is set to and the high boundary b is set to . According to the new calculated interval [a, b], mean function, and standard deviation, the two new threshold values and are calculated as an addition to the thresholds, and then, the existing threshold is replaced with when it is closet to the new mean value. In order to accurately decide the appropriate number of sub-images, we calculate the peak signal-to-noise ratio (PSNR) at each recursion level. The PSNR defined as the follows:
251
INT. J. BIOAUTOMATION, 2015, 19(2), 245-258
PSNR 20 log10
255 , RMSE
(11)
where RMSE is the root-mean-square error, defined as follows:
1 RMSE MN
1/2
Iˆxy I xy x 0 y 0
M 1 N 1
2
(12)
Here, I and Iˆ are the original and enhanced images of size M N respectively. Note that a higher PSNR value represents a better image quality. And the optimum recursion level can be determined when the increasable PSNR is lower than a particular value of 0.1 which tends to saturate the sub-histograms generation by separating the image histogram.
Intensity transformation Based on the histogram separation, the optimum number of sub-images can be expressed as follows:
I xyk I xy | Sk I xy Sk 1, I xy I , where k 0, 1, 2,
(13)
, t 1 , and I xyk represents each sub-image.
(1) Probability density function and cumulative distribution function: For each sub-image I k , the probability density function (pdf) is expressed as follows:
pdf k h
nh , nh
(14)
where h S k 1, S k 2, ..., S k 1 . Notice that pdf k h is associated with the histogram of the k-th sub-image to represent the frequency of a specific input intensity h. Then, the cumulative distribution function (cdf) is expressed as follows:
cdf k h
pdf e h
k
(15)
e S 1 k
(2) Transformation mapping function: Finally, the transformation mapping function is used for enhancing the original image. This is characterized by utilizing the cdf k of sub-image I k for k segments. Then, the transformation mapping function is defined as follows:
T k h S k S k 1 S k cdf k h ,
(16)
where k 0, 1, 2, ..., t 1 and h S k 1, S k 2, ..., S k 1 .
252
INT. J. BIOAUTOMATION, 2015, 19(2), 245-258
Experimental results and discussion For a robust visual quality and good performance of contrast enhancement method, some specific properties are extremely desirable in an effective contrast enhancement method. These are the noise tolerance ability, original feature information preservation after enhancement, convenient implementation and improvement on performance of later process. In order to demonstrate the advantages of the proposed method for the necessary specific properties, this section presents a comparison of the proposed method with some of the aforementioned classical existing methods. Experimental results are produced on the self-established databases of hand vein images.
Qualitative evaluation We adopt the proposed contrast enhancement method on all the vein images of the databases and it gets good effect, and here we just list one of the vein images to show the extremely good enhancement results compared with other aforementioned histogram-based enhancement methods. Fig. 5 shows the dorsal vein images (Fig. 5(a)) and the corresponding contrast-enhanced versions (Fig. 5(b-f)). Fig. 5(b) shows the traditional histogram equalized vein image of the original dorsal hand vein image. An extreme contrast of the image can be observed between the background and the vein topological information. We can see that all the aforementioned methods cannot achieve good contrast enhancement result, but the proposed contrast enhancement method not only enhance the contrast between the background and the statistical vein topological information but also keep the original vein information well without importing fake vein information.
(a)
(b)
(c)
(d) (e) (f) Fig. 5 Dorsal hand vein images: (a) the original dorsal hand vein images captured by self-designed device, (b) the traditional HE method, (c) the BBHE method, (d) the DSIHE method, (e) the RSIHE method, and (f) the proposed method
Quantitative evaluation In addition to the qualitative evaluation, accuracy measurement is necessary for a further comparison between the proposed method and other state-of-the-art methods, and according to the later process and image processing demand, we calculate the cross points change and PSNR value to show the advantage of the proposed methods to other classical histogram
253
INT. J. BIOAUTOMATION, 2015, 19(2), 245-258
equalization-based enhancement methods, the results are shown in Table 3, the experiment result are carried out on the self-established databases of hand vein images which includes altogether 500 images and the final values are being processed by mean function. Table 3. Comparison of cross points values and PSNR values for all considered contrast enhancement methods Evaluation Cross points PSNR value
Period Before process After process Before process After process
HE
BBHE
DSIHE
RSIHE
Ours
9
9
9
9
9
10
11
8
8
9
10.0583
10.0583
10.0583
10.0583
10.0583
10.0494
14.9109
13.2561
13.4218
29.9760
(all the values are the mean of the processed 500 images of the database)
From the statistical value in the above chart, we can see that: (1). The proposed contrast enhancement method achieve the highest PSNR value because the method enhances the images by equalizing the optimum sub-histograms in great small-scale detail, the enhanced images obtained using the proposed method produce neither noise artifacts nor over-enhancement. (2). The proposed contrast enhancement method achieves the effect of both original vein structure information and the global brightness preservation, while the other classical histogram equalization-based enhancement methods result in losing the original vein information or importing the fake vein information both of which have great influence on the later process.
Recognition rate improvement evaluation In this part of evaluation, we adopt the recognition rate change after the enhancement process to compare the performance of the proposed contrast enhancement method and other classical methods including HE, BBHE, DSIHE, RSIHE, and the procedure is that we adopt the contrast enhancement methods in the pre-process section and then we design the following process methods including ROI (region of interest) extraction, segmentation, deburring, and template forming process, in the end we carried out the experiment of template matching [3, 15] (on the mode of 1:N) on the self-designed databases and calculate the recognition rate to compare the performance of the contrast enhancement methods. The specific recognition procedure is as shown in Fig. 6 and the evaluation values comparison is shown in Fig. 7, both the trend curve and recognition rate bar chart can show that the proposed enhancement method improve the recognition effect to a certain extent and is a state-of-the-art HE-based contrast enhancement method used for biometrical images especially for vein images compared with other classical HE-based contrast enhancement methods such as BBHE, DSIHE and RSIHE.
254
INT. J. BIOAUTOMATION, 2015, 19(2), 245-258
Fig. 6 Vein template matching process
Fig. 7 Comparison of recognition rate values for all considered contrast enhancement methods
Conclusion In this paper, we propose a novel gray-level information histogram equalization method for enhancing the contrast of an image. First, we propose the new concept of gray-level information histogram, the fundamental characteristic of which is that the amplitudes of the components can objectively reflect the contribution of the gray levels and information to the representation of image information. Then the original gray-level information histogram was separated into several sub-histograms automatically by using the proposed histogram separation module. The generated sub-histograms were then equalized by the intensity transformation module to achieve an accurate and useful contrast enhancement. Experimental results revealed that the proposed method generated very high-quality and well information preservation enhancement vein images, as demonstrated using a qualitative visual inspection, quantitative PSNR and cross points evaluations and template-matching-based recognition rate performance, as compared to the other classical methods, it can increase the PSNR value from 10.0494 to 29.9760 and the recognition rate from 87% to 92.8% with the experiment carried out with the processed 500 images of the database.
255
INT. J. BIOAUTOMATION, 2015, 19(2), 245-258
Acknowledgements The research described in this paper has been supported by three main projects: the Fundamental Research Funds for the Central Universities of China (Grant No. 2011QNB21); the Innovative Engineering Developing on Graduates of Jiangsu Province in China (Grant No. CXZZ11-0293); the Chinese Coal Industry Association of Science and Technology Guiding Plan Project (Grant No. MTKJ2011-306); the Innovative Training Project of the China University of Mining and Technology (Grant No. XZD1029014185).
Reference 1. Chen S. D., A. R. Ramli (2003). Minimum Mean Brightness Error Bi-histogram Equalization in Contrast Enhancement, IEEE Transactions on Consumer Electronics, 49, 1310-1319. 2. Chen Z. Y, B. R. Abidi, D. L. Page, M. A. Abidi (2006). Gray-level Grouping (GLG): An Automatic Method for Optimized Image Contrast Enhancement – Part II: The Variations, IEEE Trans on Image Process, 15(8), 2303-2314. 3. Christov I., I. Jekova, V. Krasteva, I. Dotsinsky, T. Stoyanov (2009). Rhythm Analysis by Heartbeat Classification in the Electrocardiogram, International Journal Bioautomation, 13(2), 84-96. 4. Da W. J., Y. S. Huan (2009). Driver Identification Using Finger-vein Patterns with Radon Transform and Neural Network, Exp Sys Appl, 36, 5793-5799. 5. Kim I., J. Paik (2008). Adaptive Contrast Enhancement Using Gain-controllable Clipped Histogram Equalization, IEEE Transactions on Consumer Electronics, 54(4), 1803-1810. 6. Kim J.-Y, L.-S. Hwang, S.-H Hwang (2001). An Advanced Contrast Enhancement Using Partially Overlapped Sub-block Histogram Equalization, IEEE Trans on Circuits Syst Video Technol, 11(4), 475-484. 7. Kim Y.-T. (1997). Enhancement Using Brightness Preserving Bi-histogram Equalization, IEEE Transactions on Consumer Electronics, 43(1), 1-8. 8. Kong N. S. P., H. D. Lbrahim (2008). Color Image Enhancement Using Brightness Preserving Dynamic Histogram Equalization, IEEE Transactions on Consumer Electronics, 54, 1962-1968. 9. Lv P., S. Hai (2007). Image Enhancement and Feature Matching of Palm-dorsa Vein, Computer Engineering and Design, 28(15), 3623-3625. 10. Mei C., X. Xiao, G. Liu, Y. Chen (2009). Feature Extraction of Finger Vein Patterns Based on Morphologic Algorithm, International Conference on Fuzzy Systems and Knowledge Discovery, 407-411. 11. Menotti D., L. Najman, J. Facon, A. A. Araujo (2007). Multi-histogram Equalization Methods for Contrast Enhancement and Brightness Preserving, IEEE Transactions on Consumer Electronics, 53, 1186-1194. 12. Miura N., A. Nagasaka, T. Miyatake (2004). Feature Extraction of Finger Vein Patterns Based on Repeated Line Tracking and Its Tracking and Its Application to Personal Identification, Machine Vision and Applications, 15, 194-203. 13. Miura N., A. Nagasaka, T. Miyatake (2007). Extraction of Finger Vein Patterns Using Maximum Curvature Points in Image Profiles, IEICE Transactions on Information and Systems, 185-194. 14. Park G. H., H. H. Cho, M. R. Choi (2008). A Contrast Enhancement Method Using Dynamic Range Separate Histogram Equalization, IEEE Transactions on Consumer Electronics, 54(4), 1981-1987. 15. Wang J., G. Wang, M. Li, K. Wang, H. Tian (2015). Hand Vein Recognition Based on Improved Template Matching, International Journal Bioautomation, 18(4), 337-348.
256
INT. J. BIOAUTOMATION, 2015, 19(2), 245-258
16. Xu M., Q. Sun (2003). Vasculature Development in Embryos and Its Regulatory Mechanisms, Chinese Journal of Comparative Medicine, 13(1), 45-49. 17. Yang J. F., J. L. Yang, Y. H. Shi (2009). Finger-vein Segmentation Based on Multi-channel Even-symmetric Gabor Filters, ICIS, 4, 500-503. 18. Yang J. F., X. Li (2010). Efficient Finger Vein Localization and Recognition, International Conference on Pattern Recognition, 1148-1151. 19. Zhang Z., D. Wu, S. Ma, J. Ma (2005). Multiscale Feature Extraction of Finger-vein Patterns Based on Wavelet and Local Interconnection Structure Neural Network, ICINNB, 1081-1084.
Assoc. Prof. Jun Wang, Ph.D. Student E-mail:
[email protected] Jun Wang received his M.Sc. in Control Engineering (2013) and he is studying for Ph.D. degree at School of Information and Electrical Engineering, China University of Mining and Technology. He is an Associate Professor in China University of Mining and Technology now. His main research fields are robot, biometric and innovation education.
Guoqing Wang, B.E. E-mail:
[email protected]
Guoqing Wang received his B.E. in Information Engineering (2014). Now he is a postgraduate of Control Engineering in China University of Mining and Technology. His current research interests are pattern recognition and intelligent system and biometric features recognition.
Prof. Ming Li, Ph.D. E-mail:
[email protected]
Ming Li received his Ph.D. degree from China University of Mining and Technology in 2002. He is a Professor and Ph.D. supervisor in China University of Mining and Technology now. His main research fields are intelligent detection and system.
257
INT. J. BIOAUTOMATION, 2015, 19(2), 245-258
Wenkai Du, B.E. E-mail:
[email protected]
Wenkai Du received his B.E. in Measurement-control technology and instrument (2013). Now he is a student in China University of Mining and Technology. His current research interest is control engineering.
Wenhui Yu, B.E. E-mail:
[email protected]
Wenhui Yu received his B.E. in Information Engineering (2014). Now he is a postgraduate in China University of Mining and Technology. His current research interest is biometric features recognition.
258