Behav Ecol Sociobiol DOI 10.1007/s00265-013-1550-5
ORIGINAL PAPER
Hierarchical dominance structure in reintroduced California condors: correlates, consequences, and dynamics James K. Sheppard & Matthew Walenski & Michael P. Wallace & Juan J. Vargas Velazco & Catalina Porras & Ronald R. Swaisgood
Received: 20 November 2012 / Revised: 18 April 2013 / Accepted: 19 April 2013 # Springer-Verlag Berlin Heidelberg 2013
Abstract Populations of reintroduced California condors (Gymnogyps californianus) develop complex social structures and dynamics to maintain stable group cohesion, and birds that do not successfully integrate into group hierarchies have highly impaired survivability. Consequently, improved understanding of condor socioecology is needed to inform conservation management strategies. We report on the dominance structure of free-ranging condors and identify the causes and consequences of rank in condor populations by matching social status with the behavioral and physical correlates of individual birds. We characterized the hierarchical social structure of wild condor populations as mildly linear, despotic, and dynamic. Condor social groups were not egalitarian and dominance hierarchies regulated competitive access to food resources. Absence of kinbased social groups also indicated that condor social structure
is individualistic. Agonistic interactions among condors were strongly unidirectional, but the overall linearity and steepness of their hierarchies was low. Although one aggressive male maintained the highest dominance rank across the 3-year observation period, there was considerable fluidity in social status among condors within middle and lower rank orders. Older condors were more dominant than younger birds and younger males supplanted older females over time to achieve higher status. Dominance rank did not predict the amount of time that a bird spent feeding at a carcass or the frequency that a bird was interrupted while feeding. Thus, younger, less dominant birds are able to obtain sufficient nutrition in wild social populations. Keywords California condor . Socioecology . Dominance hierarchy . Reintroduction
Communicated by C. R. Brown Electronic supplementary material The online version of this article (doi:10.1007/s00265-013-1550-5) contains supplementary material, which is available to authorized users. J. K. Sheppard : M. P. Wallace : R. R. Swaisgood San Diego Zoo Institute for Conservation Research, Escondido, CA, USA M. Walenski University of California San Diego/San Diego State University, Escondido, CA, USA J. J. V. Velazco : C. Porras WildCoast/CostaSalvaje, Ensenada, Mexico J. K. Sheppard (*) : M. Walenski : M. P. Wallace : J. J. V. Velazco : C. Porras : R. R. Swaisgood Applied Animal Ecology Division, San Diego Zoo Institute for Conservation Research, 15600 San Pasqual Valley Road, Escondido, CA 92027-7000, USA e-mail:
[email protected]
Introduction The concept of dominance was developed to describe, explain, and predict social relationships in animal groups by ranking an individual's competitive ability from highest to lowest (see review and definitions by Drews 1993). Dominance hierarchies in social foragers promote the efficient use of resources by suppressing costly intraspecific aggression (Rowell 1974). Hierarchies also reduce the energy and time needed for social interactions, which can be spent performing other important activities such as foraging or predator avoidance (reviewed by Dewsbury 1982; Drews 1993). Noninjurious threat and display behaviors reinforce social hierarchies as individuals within a group learn to evaluate their chances of successfully challenging dominant conspecifics. Dominance hierarchies can be categorized according to their composition, configuration, and how they change through
Behav Ecol Sociobiol
time. Hierarchies can be either “despotic” or “egalitarian”, “nepotistic”, or “individualistic”, and “stable” or “dynamic”. In despotic social species, benefits (e.g., food, mates, shelter) are strongly biased towards higher-ranking individuals, whereas in egalitarian species they are more equally distributed (Vehrencamp 1983; van Schaik 1989). High dominance rank confers fitness benefits in despotic societies because competitive individuals have improved access to resources. For example, highly ranked individuals in hierarchical primate societies appear to have greater foraging efficiency and energy intake rates than lower ranked animals (e.g., Range and Noe 2002; Vogel 2005; Chancellor and Isbell 2009). Consequently, despotic societies tend to endow a few individuals with the majority of benefits or the majority of costs (Vehrencamp 1983; Stahl et al. 2001; Archie et al. 2006). Species that utilize patchy resources that can be monopolized by individuals will tend to live in despotic societies with well-differentiated, transitive, and stable social relations and form dominance hierarchies that are rigid, linear, and steep. Conversely, species that utilize dispersed, abundant resources tend to live in egalitarian societies with poorly differentiated, relatively intransitive, and unstable social relationships that form weakly linear and shallow dominance hierarchies (Hand 1986; van Schaik 1989; Archie et al. 2006; Stevens et al. 2007). Nepotistic hierarchies, in which relatives aid each other in dominance interactions leading to increases in rank, may evolve in groups if related individuals gain direct or inclusive fitness benefits from mutual aid with their relatives. Conversely, individualistic hierarchies occur when dominance ranks are independent of kin-based social structures (Wrangham 1980; van Schaik 1989; Sterck et al. 1997; Isbell and Young 2002; Archie et al. 2006; Wittemyer and Getz 2007). Stable dominance relationships occur when stable competitive asymmetries arise between individuals (Dewsbury 1982). Competitive asymmetries may also be temporally dynamic depending on the context of contests and the condition and motivation of the contestants (Dewsbury 1982; Kaufmann 1983). For example, contests for food resources may be strongly modified by each animal's hunger or satiation levels (Komers 1989). New world vultures are ideal test subjects for examining the role of dominance hierarchies in social foragers because they feed in highly structured groups at food resource patches (carcasses), some of which can be monopolized and their dominance relationships can influence the priority of access to food (Coleman and Fraser 1986; Wallace and Temple 1987; Kirk and Houston 1995). The California condor is the largest avian scavenger in North America and wild condor populations share communal home ranges where competition for food and reproduction occurs. Condors typically congregate at carcasses in large groups (>5 animals) where the priority of access to food resources appears to be at least partly determined by social status, and
they have developed complex social dynamics that maintain a stable, non-injurious social cohesion (Snyder and Snyder 1989; Snyder and Snyder 2000; Bukowinski et al. 2007). The California condor has been the focus of intensive conservation management for 25 years (see reviews by Snyder and Snyder 2000; Mee and Hall 2007) and the behavior and socioecology of condors have been intensively observed since the landmark work of Koford (1953). However, most empirical studies have been restricted to small groups (∼5 individuals) of captive birds in artificial environments (Cox et al. 1993; Bukowinski et al. 2007; Clark et al. 2007). No formal analysis of the dominance hierarchies of California condors reintroduced to the wild has been made and systematic data are missing from the literature. Birds that do not develop appropriate social behaviors and do not successfully integrate into the group hierarchy have highly impaired survivability in the wild from increased predation risk and reduced access to information sharing about food resources (Snyder and Snyder 2000; Wallace 2000). Hence, improved understanding of condor socioecology is vital to tailoring management strategies and reintroduction programs to the specific social requirements of condors. We describe the socioecology of wild condors by observing and analyzing the dominance structure of 22 reintroduced condors in Baja California, Mexico over a 3-year period. Our objective was to identify the causes and consequences of dominance in condor societies by matching condor social status with the behavioral and physical correlates of individual birds as they changed through time. The socioecology literature is replete with studies of herbivore and omnivore societies that forage for widespread, ubiquitous, and predictable (e.g., seasonal) plant food resources (e.g., primates and elephants, see Wittemyer et al. 2007). The structure of these societies tends to be egalitarian, weakly linear, and nepotistic because kin relationships are known and the availability of their food resources inhibits monopolization. Conversely, the carcasses upon which condors feed under natural conditions are widely distributed as spatiotemporally unpredictable and ephemeral point sources that can be monopolized. Therefore, we tested the hypothesis that condor social structure is transitive and linear (sequential) and despotic because it is modified by the patchy and unpredictable spatiotemporal distribution of monopolizable food resources. California condors are initially hatched and reared in captivity in isolation (for ∼30 days), so kin recognition is likely absent in reintroduced condor social groups, at least until a selfsustaining breeding population is established in the wild. Therefore, we predicted that condor social structure is individualistic since kin-based alliances are absent in the current reintroduced population. Finally, we predicted that condor social structure is dynamic because competitive interactions between condor conspecifics are asymmetrical and unstable
Behav Ecol Sociobiol
and dominance rank seems to change within a bird's lifetime (e.g., Bukowinski et al. 2007; A. Mee unpublished data).
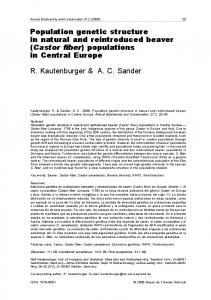
Methods Study site and subjects San Diego Zoo Global successfully reintroduced a population of California condors to their former range in northern Baja California, Mexico in 2003 in collaboration with Mexican partner organizations (see “Acknowledgements”). The reintroduction site lies in the mountain ranges of the Parque Nacional Sierra de San Pedro Martir region, amongst the tallest peaks of Baja (31° 1'53.19"N, 115°33'55.52"W) (Fig. 1). The population of freeranging condors in Mexico at the time of this study consisted of 17 birds in 2008, 18 in 2009, and 22 in 2010 (with 50/50 sex ratios and ages ranging from 2 to 10 years). The Los Angeles Zoo reared nine of the 22 birds and the San Diego Zoo reared 13. All released condors were fitted with solar-powered VHF and Argos GPS transmitters that provided hourly location data to 200 m using binoculars. Fig. 1 Location of the California condor reintroduction site, in the mountains of the Parque Nacional Sierra de San Pedro Martir, central northern Baja California, Mexico
Observation procedure We deployed six field digital video recorders (DVRs) at three feeding stations within the range of the reintroduced condor population. Feeding stations are protected sites where field managers proffer animal carcasses to the released birds so that they can safely feed until they gain sufficient experience and confidence to successfully forage independently. Food carcasses are proffered at night at irregular intervals once or twice weekly, so food resources for the condors are currently spatiotemporally semi-predictable. Carcasses include whole sheep and the legs of horses and donkeys. We assumed that the type of carcass had negligible effect on condor social interactions since they were similarly sized. Condors fed almost exclusively on the proffered carcasses, and only rarely were birds observed returning to roosts from long distance flights with full crops from independent foraging. Condor social interactions are heightened around communal feeding events as the birds become excited, and the feeding stations concentrated the bird's activity within the field of view of the DVR cameras. Feeding Station-1 was established on a 6-m2 boulder that was elevated 3 m off the ground, with an electric fence to prevent attacks to the condors and scavenging of the proffered carcasses by other carnivores. Feeding Station-2 was sited on an open flat area of rock at the edge of an escarpment. Feeding Station-3 was installed on a 4-m2 boulder that was
Behav Ecol Sociobiol
elevated 3 m off the ground next to a field aviary. All feeding stations were situated on open ground close to trees and snags so that the condors could safely survey the landscape surrounding the carcasses and gain confidence to land and feed. The feeding stations were located within an 8-ha area and were set 100–200 m apart from each other and within 300 m from the site where captive condors were initially released into the wild. Field DVR units consisted of one Sandpiper Sentinel MAGNUM DVR with a 160-Gb hard drive and five Advance Security SSC-773 V2 DVRs with a 32-Gb SD memory card and a 580 Line, 8 mm weatherproof color bullet camera (Sony Super HAD 1/3 in. CCD). Cameras were mounted atop 3 m tall, heavy-duty boom stands that were bolted to the underlying rock so that they acquired a stable, unobstructed panoramic view of the feeding station (∼9 m2 field of view). The DVRs were powered by 12-V batteries that were in turn trickle charged by a 62-W flexible solar panel (Global Solar Energy Inc.), providing near continuous power. DVRs were preprogrammed to initiate recording when triggered by movement to conserve power and recording memory. We collected group samples of condor dominance behaviors using the DVRs at the three feeding stations across eight seasons from October 2008 to November 2010. We acquired a total of 42 h of observational data from 16 separate feeding events. We classified a feeding event as the time between the arrival of the first condor at a videoed carcass and the time the last bird leaves the carcass once it is consumed (mean event time=2.6 h, min=0.2 h, max=7.7 h). Mean time between observed feeding events was 51 days (±17. SE). Observations also included the social interactions of two adult breeding pairs (#269–#284 and #261–#217) that both produced wild-hatched chicks in 2009 and 2010. We were able to score a total of 1,057 condor social interactions between all 22 reintroduced birds using the recorded DVR footage. Each condor was identified interacting at an average of 8.8 feeding events (±1.0 SE), with a mean of 92 total social interactions per individual (±14 SE). We recorded a mean observation time of 2.63 h (±0.52 SE, min=0.24, max=7.73) for each feeding event across the three feeding stations. A mean of 12 condors were observed interacting at each feeding event (±1.0 SE, min=8, max=18), and we recorded an agonistic social interaction between feeding condors on average every 4.5 min. Each bird spent an average of 27.0 min of total time feeding at each event (±3.5 SE, min=18 s, max=2.1 h) and the mean proportion of the total time at each event that the condors spent feeding was 0.69 (±0.06 SE). For example, video footage of condor social interactions recorded remotely around a feeding carcass refer to Online Resource 1. We determined condor dominance relationships by the direction of agonistic dyadic interactions. We scored only unidirectional interactions where the apparent intent to
dominate another bird was unambiguous and did not include drawn interactions. We classified agonistic behaviors into the following three categories using a simplified ethogram: (1) contact aggression; (2) non-contact aggression, and; (3) displacement (Table 1). We also recorded four additional behavioral properties during feeding events: (1) the time and direction of each agonistic interaction; (2) the time of all condor arrivals and departures during each communal feeding event; (3) the total time that each condor spent feeding; (4) the number of times each bird paused or was interrupted for >20 s while feeding. We were able to determine the identity of each individual condor at all time via wing ID tags, precluding pseudoreplication issues associated with data pooling. We were also able to observe social interactions between all 22 birds, which enabled us to sample the entire reintroduced population. Data for individual birds were averaged across each of the 3 years that observations were recorded. Analysis of individual social dominance levels We assumed that the outcomes of condor dyadic interactions were sufficiently predictable to enable description of the social order. We used a Bayesian version of the Bradley– Terry model, based on the method of pair comparisons (Bradley and Terry 1952; David 1988), for determining individual values of dominance levels (Adams 2005; Romero and Castellanos 2010). Bayesian analysis determines the most likely rank orderings, similar to nonparametric methods such as the IandSI technique (de Vries 1998). Unlike nonparametric methods, Bayesian analysis provides additional measures of certainty by generating the posterior probabilities of those orderings based on prior probability distributions. These measures allowed us to determine whether there were several plausible hierarchies with similar posterior probabilities (Gill 2002; Adams 2005; Chancellor and Isbell 2009). In addition to inferring which estimate of ranks had the greatest support, this probability-based model quantified the degree of belief that could be assigned to possible parameter values (Gelman et al. 2004). These measures of certainty about the inferences of dominance values could be summarized and carried on into further analyses (Adams 2005). Furthermore, this method of paired comparisons produced estimates of dominance abilities on an interval scale, so that the magnitude of the differences could also be examined (Boyd and Silk 1983). We ranked condor dominance ability using scripts provided by Adams (2005) for use within OpenBUGS 3.2.1 (Lunn et al. 2000), a software program that uses Markov chain Monte Carlo (MCMC) simulation to estimate Bayesian models. Before proceeding, we inspected the condor interaction data for intransitivities and non-convergence of the Markov chains (the lists of samples from the posterior distribution). Convergence of the parameters was examined
Behav Ecol Sociobiol Table 1 Definitions of the 1,057 mutually exclusive agonistic behaviors observed in wild California condors Behavior type
Definition
Display
Frequency Mean % ♂
Focal bird displays ∙ Nip, bite, stab, tug or pull 253 agonistic behavior at skin or feathers of other towards other bird bird.Bird quickly and actual physical strikes another with foot contact is made. Non-contact aggression Focal bird makes ∙ Bird attempts to nip, 197 threatening behavior bill-strike, or tug at another that does not include but fails to make contact. any physical contact. Displacement Focal bird approaches ∙ Bird walks toward or pushes 159 and takes over other another, causing the other to avoid. bird’s resource. From flight or hop/jump the aggressor lands on spot occupied by another. Contact aggression
41 % (±3.6)
Frequency Mean % ♀ 144
34 % (±4.2)
24 % ((±6.2) 159
37 % (±5.3)
35 % (±4.7)
29 % (±4.0)
145
Behaviors are divided by condor sex into total frequency and mean percentage across individual birds (±SE)
using trace plots, and the stability of the convergence was confirmed by a Gelman–Rubin statistic (Gelman and Rubin 1992). For each sample group (year), we then discarded the first 10,000 MCMC iterations of the Markov chain to ensure convergence and mixing to a suitably stationary posterior distribution before drawing 100,000 samples to calculate the posterior probability of rank orderings using the Bradley– Terry model. We used CodaReader 1.2.2 (Adams 2005), a free, stand-alone application for Windows operating systems, to find the posterior probability of the condor rank orderings. Each bird was then assigned a rank from 1 (most dominant; high dominance ability) to 22 (most subordinate; low dominance ability). Analysis of factors predicting social rank Both prior residence and an animal's age have been reported to influence rank in avian dominance hierarchies (Cristol et al. 1990 and references therein). We examined the effects on condor dominance ability of the following intrinsic characteristics of individual birds: (1) origin (San Diego Zoo or Los Angeles Zoo); (2) sex (m/f); (3) age (months); (4) total time free ranging in the wild (months); (5) total flight distance travelled previous 30 days before each feeding event (kilometer); (6) home range size previous 30 days before each feeding event (square kilometer). To characterize the spatial behaviors of each bird, we used the GPS location dataset collected from the condors in the weeks leading up to a feeding event. We filtered out all two-dimensional GPS locations to improve the quality of our dataset while minimizing the loss of spatial information. We calculated the total distance that each bird flew in the previous 30 days before each feeding event using the Spatial Analyst extension for the ArcGIS v10.0 program (Environmental Systems Research, Inc., Redlands, CA) and
the Geospatial Modeling Environment program (GME v0.5.3 Beta, http://www.spatialecology.com). Mean length of condor movement paths summed across the 30 days prior to a feeding event was 1023.2 km (±50.0 SE). We calculated the size of condor home ranges in the previous 30 days before a feeding event using the fixed-k local convex hull (LoCoH) algorithm of Getz and Wilmers (2004) and Getz et al. (2007) within the program R (http://www.r-project.org/). To maintain comparability between the spatial behaviors of individual birds, we set the value of k to 21 (k—1 nearest neighbors of root GPS location points). An individual home range was defined as the area of the outer 100 % LoCoH contour. Mean area of condor LoCoH home ranges during the 30 days prior to a feeding event was 2,768.9 km2 (±262.7 SE). Analysis of intrinsic variables on condor dominance rank was conducted using restricted maximum likelihood (REML) in a mixed effects regression model (SAS 9.2 proc mixed). The model included a random effect of bird on the intercept, and fixed effects of time (16 points across 2008, 2009, 2010, corresponding to the 16 feeding events that were evaluated), origin, sex, age, and the interactions between these four factors. Origin (0=Los Angeles Zoo, 1= San Diego Zoo) and sex (0=female, 1=male) were dummy coded. Total time free-ranging in the wild, flight path distance, home range area, and carcass type (dummy coded: 0= whole animal, 1=leg) were included as additional fixed effects. The model was fitted with an unstructured covariance matrix, and degrees of freedom were adjusted with the Satterthwaite approximation. For all effects, α=0.05. Analysis of feeding time To examine the relationship between condor dominance rank and condor feeding behavior, we again used a mixed
Behav Ecol Sociobiol
effects regression model with restricted maximum likelihood. In separate models, we examined three dependent measures of feeding behavior: (1) the total time (in seconds) that individual condors were able to spend feeding during each event; (2) the proportion of time around a carcass that each condor spent feeding (as opposed to other behaviors such as conspecific interactions, observing, preening), and; (3) how often each condor was interrupted for periods lasting >20 s while feeding to perform other activities, such as interacting socially, observing conspecifics, and moving to different areas of the feeding station. Dominance rank was included as an independent fixed effect variable. Given the influence of other variables on dominance rank (see results below), we also included the same variables and interactions from the analysis as fixed effect covariates (time, origin, sex, age, and their interactions, as well as time spent free ranging in the wild, flight path distance, home range area, and carcass type). The model was fitted with an unstructured covariance matrix, and degrees of freedom were adjusted with the Satterthwaite approximation. For all effects, α=0.05. Hierarchy linearity, steepness, and directional consistency Linearity and steepness are complementary measures of social structure, with linearity measuring the degree of transitivity (e.g. individual A>B>C) and steepness measuring the degree to which individuals differ from each other in winning dominance encounters (de Vries et al. 2006). Where rank distances are large, the hierarchy is steep and despotic; where they are small, it is shallow and egalitarian (van Schaik 1989; de Vries et al. 2006). For comparability with traditional nonparametric measures of dominance, we used MatMan 1.1 (Noldus Information Technology, Wageningen, see also de Vries 1998) to test the linearity of condor dominance hierarchies using Landau's index h. Where there were unknown relationships between dyads, we used the corrected index of linearity h'. These indexes vary from 0 (indicating the absence of linearity) to 1 (complete linearity). A strongly linear hierarchy has an index of linearity >0.90 (Martin and Bateson 1993; Vervaecke et al. 2000). We determined the significance of the degree of linearity using a two-step randomization test with 10,000 randomizations (de Vries 1995). For years where the degree of linearity was significant, the matrices were then reordered using the IandSI method (de Vries 1998), which gave the most consistent IandSI rank order for each group by minimizing the number of inconsistencies and minimizing the total strength of inconsistencies. We calculated the directional consistency index (DC) to measure the degree of symmetry within dyadic relationships across two or more agonistic interactions (van Hooff and
Wensing 1987; Isbell and Young 2002; Smith et al. 2011). The DC ranges from zero, for completely bidirectional exchanges, to one for completely unidirectional exchanges and is calculated as: (H−L)/(HC+L), where H is the total number of times that agonistic interactions were seen in the higher-frequency direction and L is the total number of times that agonistic interactions were seen in the lower frequency direction. A high DC index indicates that wins are highly asymmetrical among pairs of condors that interacted multiple times. Finally, we calculated the steepness of each condor dominance hierarchy using the package Steepness v0.1 for the program R (de Vries et al. 2006). The steepness of a dominance hierarchy refers to the size of the absolute differences between adjacently ranked individuals in their overall success in winning dominance encounters (i.e., dominance success). When these differences are large, the hierarchy is steep; when they are small, the hierarchy is shallow (de Vries et al. 2006). The Steepness package calculates a dyadic dominance index Dij, in which the proportion of wins and losses are corrected for the chance occurrence of these events. Dij is then used to calculate the normalized David's score (DS) for each individual, with values varying between 0 and N−1, where N is the number of individuals in the group (de Vries et al. 2006). Ranking the normalized DSs provides the DS rank and regressing the DS ranks against the normalized DS values provides the slope or steepness of the hierarchy, which varies between 0 (an egalitarian hierarchy) and 1 (a despotic hierarchy) (Hewitt et al. 2009). We assessed the significance of each steepness value through 10,000 randomizations of the condor aggression matrices.
Results Dominance hierarchy characteristics The numbers of condors present at the feeding events peaked at around ten individuals after 20–30 % of the total feeding event time had elapsed following the arrival of the first bird at the carcass. The average number of agonistic interactions between feeding condors also peaked at around 2.5 interactions/min during this same period (Fig. 2). All feeding events were initiated by the arrival of 1–4 young sub-adult condors at the feeding station, and these juvenile birds were then soon displaced as older, more dominant birds landed to feed. Typically, these same younger condors were also the last to leave the carcass because they had to wait their turn to again feed undisturbed once the dominant birds were sated and departed. Condors exhibited an even frequency of the three agonistic interaction types when averaged across the observed population (Table 1). We recorded no significant difference between the frequencies
Behav Ecol Sociobiol Fig. 2 Relationship between the proportion of total time recorded during condor feeding events (x-axis), (top y-axis) the mean number of agonistic interactions summed across all feeding birds and feeding events, and (bottom y-axis) the mean total number of condors present at the feeding station± SE. The frequency of agonistic interactions peaked with condor numbers during the first time quarter when the first individuals to land and feed (always juveniles) were deposed from the carcass by a wave of more dominant birds. Agonistic interactions then fell faster than condor numbers as the hierarchy was established
of agonistic interaction types within or between male and female sex categories (male = χ 2 (2) = 1.41, P = 0.49; female=χ2 (2)=0.65, P=0.96). The agonistic interactions of the wild condor population were frequent enough for us to detect dominance hierarchies. As predicted, we were able to successfully implement Bayesian and nonparametric modeling techniques to order condor agonistic interactions into dominance ranks. Table 2 shows the Bayesian posterior probabilities of the most likely dominance rankings for each year from highest to lowest within a 95 % credibility set. Posterior probabilities varied by year and were low (P=0.0001 to 0.035), likely due to the high numbers of individuals observed within each aggression matrix. The low probabilities in year 2008 may also be due to fewer interactions being observed between some dyads. However, simplifying our proposed dominance orders by grouping condors into the high, medium, and low categories in Table 2 produced probabilities of 0.50, 0.94, and 0.77. The nonparametric method also produced orderings of condor rank groups that were similar to those of the Bayesian technique (ISandI=88 %, Normalized David's scores=82 %). Not all birds were observed across all 3 years of the study due to their removal from the wild population through mortality or quarantine.
Agonistic interactions among condors were strongly unidirectional and the number of reversals was relatively low, indicating that most interactions followed the direction of the hierarchy (mean directional consistency index=0.92± 0.02 SE). Two of the three years of behavioral observations showed significant linear ordering of dominance relationships within the condor hierarchies (year 2009: 0.68, P=0.0001; year 2010: 0.46, P=0.0002). Condor hierarchies were significantly steeper than random in two of the three observation years, and ranged from shallow (0.12) to moderately steep (0.52). The shallowest hierarchy (year 2008) was not significantly steeper than random or linear (P=>0.05), suggesting egalitarianism. However, the low frequency of aggressive interactions and high proportion of unknown relationships recorded for this year may have decreased the likelihood of detecting a hierarchy. Factors predictive of dominance rank and feeding behavior We detected a significant interaction between age, sex, and origin (B=−5.43, t (125)=3.78, P=0.0002; Fig. 3). This interaction indicates that female condors from the Los Angeles Zoo exhibited reduced dominance as they aged, in contrast to the female condors from San Diego and the male condors from both zoos. Also significant was an interaction of age×origin
Behav Ecol Sociobiol Table 2 The most likely dominance rank orders for each observation year based on the posterior probabilities from Bayesian analyses
Condor numbers are individual IDs and age is presented in years. Bayesian rank orders are grouped into High (dark gray), Medium (medium gray), and Low (light gray) dominance abilities with summed posterior probability values. Also presented are the dominance hierarchy linearity, directional consistency, and steepness values. Bird IDs with asterisks in 2008 were not included in subsequent years due to mortality events
(B=7.17, t (127)=7.41, P0.15). In our analyses, examining the effects of dominance rank on feeding time, which controlled for these other factors, dominance rank weakly predicted the proportion of time during each event spent feeding, and more dominant birds tended to exhibit a greater proportion of time feeding than less dominant condors (B=−0.03, t (54)=1.73, P=0.09). Dominance rank did not predict total time feeding (B=75.7, t (62)=1.46, P=0.15) or the number of interruptions during feeding (B=0.61, t (7.8)=1.66, P=0.14). Carcass type did not predict the proportion of time during each
Behav Ecol Sociobiol Fig. 3 Condor dominance rank as a function of age (in months), origin (Los Angeles or San Diego Zoo), and sex (male, female). Lines represent individual birds
event that condors spent feeding (B=0.05, t (54)=0.52, P=0.6). However, carcass type did predict the frequency that birds were interrupted while feeding, with interruptions increasing when the birds fed on animal legs rather than whole carcasses (B=6.77, t (57)=2.64, P=0.01). Carcass type also predicted total time feeding, with feeding time increasing when the birds were fed legs (B = 1233.2, t (62)=3.73, P=