Bayesian hierarchical models have been around for over thirty years. .... population correlation coefficient for each pair of media is zero â dark gray shading.
Bayesian Analysis (2009)
4, Number 1, pp. 1–36
Hierarchical Model Building, Fitting, and Checking: A Behind-the-Scenes Look at a Bayesian Analysis of Arsenic Exposure Pathways Peter F. Craigmile∗ , Catherine A. Calder† , Hongfei Li‡ , Rajib Paul§ , and Noel Cressie¶ Abstract. In this article, we present a behind-the-scenes look at a Bayesian hierarchical analysis of pathways of exposure to arsenic (a toxic heavy metal) using the Phase I National Human Exposure Assessment Survey carried out in Arizona. Our analysis combines individual-level personal exposure measurements (biomarker and environmental media) with water, soil, and air observations from the ambient environment. We include details of our model-building exercise that involved a combination of exploratory data analysis and substantive knowledge in exposure science. Then we present our strategies for model fitting, which involved piecing together components of the hierarchical model in a systematic fashion to assess issues including parameter identifiability, Bayesian learning, model fit, and convergence diagnostics. We also discuss practical issues of data management and algorithm debugging, especially in the light of missing and censored data. We believe that our presentation of these behind-the-scenes details will be of use to other researchers who build complex Bayesian hierarchical models. Keywords: Arizona, Bayesian learning, data management, environmental health, Markov chain Monte Carlo (MCMC) algorithm, model validation, National Human Exposure Assessment Survey (NHEXAS)
1
Introduction
Bayesian hierarchical modeling has been increasingly recognized as a powerful approach for analyzing complex phenomena. This framework has moved from simply the Bayesian analogue of classical multilevel modeling for nested data, to being recognized as an essential tool for performing modern statistical science. Bayesian hierarchical models are now commonly used both within and outside the statistics literature and are widely lauded for their capacity to synthesize data from different sources, to accommodate complicated dependence structures, to handle irregular features of data such as missingness and censoring, and to incorporate scientifically based process information. However, ∗ Department of Statistics, The Ohio State University, Columbus, OH, USA, http://www.stat.osu. edu/~pfc/ † Department of Statistics, The Ohio State University, Columbus, OH, USA, http://www.stat.osu. edu/~calder/ ‡ IBM T. J. Watson Research Center, Yorktown Heights, NY, USA, http://www.stat.osu.edu/ ~hongfei/ § Department of Statistics, Western Michigan University, Kalamazoo, MI, USA ¶ Department of Statistics, The Ohio State University, Columbus, OH, USA, http://www.stat.osu. edu/~ncressie/
c 2009 International Society for Bayesian Analysis °
DOI:10.1214/09-BA401
2
Hierarchical Model Building, Fitting, and Checking
despite the inherent elegance of the approach, effective derivation of inferences from these models is by no means a trivial task. The aim of this paper is to provide a behind-the-scenes look at a Bayesian hierarchical analysis. We show the reader how we carried out our model building, fitting, and checking, which were complicated by issues related to the quality and quantity of available data. Strategies will be presented for compartmentalizing model components and inputs in order to allow efficient assessment of the impact of modeling assumptions on inferences. While the reader may not agree with all of our modeling decisions, and there certainly are aspects of our analysis that warrant further study, our goal is to start a dialog on practical hierarchical-modeling strategies that allow defensible statistical learning from complex Bayesian analyses. This article is organized as follows. In Section 2, we introduce the environmentalexposure application that underlies our discussion of Bayesian hierarchical modeling. Model building through a combination of exploratory data analysis and prior knowledge in exposure science is the focus in Section 3. Then, in Section 4, we discuss our modelfitting strategies, including data management, algorithm (Markov chain Monte Carlo, MCMC) checking (debugging), and assessing convergence. We take the reader through the fitting of various components of our complex hierarchical model in order to examine issues such as parameter identifiability, Bayesian learning, and model fit. Section 5 contains a summary of scientific conclusions, and we conclude with a general discussion of Bayesian hierarchical modeling in Section 6.
2 2.1
Environmental exposure application Overview
Our motivating application is a Bayesian hierarchical analysis of human exposure pathways. Generally, a pathways analysis refers to the study of the relationship between levels of toxicants in environmental media (e.g., air, water, dust, food) and levels of personal exposure. In order to provide data to study pathways of exposure to a variety of toxic substances, Phase I of the National Human Exposure Assessment Survey (NHEXAS) was carried out in the 1990s by the Office of Research and Development (ORD) of the U.S. Environmental Protection Agency (USEPA), along with the U.S. Centers for Disease Control and Prevention (CDC) and the U.S. Food and Drug Administration (FDA) (NERL and National Center for Environmental Assessment 2000). This study was conducted in three areas: Arizona, EPA Region 5 (six midwestern states), and Maryland. In this paper, we limit our Bayesian hierarchical analysis to the Arizona (AZ) NHEXAS data consisting of environmental media measurements and biomarker measurements (i.e., indicators of personal exposure) for 178 individuals in 15 AZ counties (Robertson et al. 1999; O’Rourke et al. 1999). The selection of the AZ portion of the NHEXAS data for our study was driven by the relatively easier access to water, soil, and air observations from the ambient environment. Using NHEXAS AZ data, we focus on modeling pathways of exposure to arsenic (As). Acute exposure to As is associated with irritation of the gastrointestinal and respiratory tracts, while chronic exposure has been shown to be related to melanosis, hyperpigmentation, depigmenta-
Craigmile, Calder, Li, Paul, and Cressie
3
tion, hyperkeratosis, and skin cancer, and may also affect the nervous, cardiovascular, and haematopoietic systems (WHO 1981). Further details on the NHEXAS data used in our analysis can be found in Section 2.2. Hierarchical modeling is natural in pathways analyses due to the direct and indirect relationships between environmental media and personal exposure. For example, the concentration of a toxicant in water may be related to personal exposure directly through ingestion (drinking) and dermal (bathing) pathways. However, part of the ingestion pathway may also be indirect if water is used for cooking purposes. Recognizing the complexity of these relationships, Clayton et al. (2002) used a structural-equationsmodeling approach to explore pathways of exposure to As and lead (Pb) using NHEXAS Region 5 data. Also using the As NHEXAS Region 5 data, McMillan et al. (2006) and Cressie et al. (2007) developed Bayesian hierarchical pathways models. Unlike Clayton et al. (2002)’s approach, these models are able to accommodate measurement error in the environmental media and biomarker measurements, as well as missing and censored (below a specified minimum detection limit (MDL)) observations, in a coherent manner. We rely heavily on these models in the development of our Bayesian hierarchical pathways model described in Section 3. Recognizing that one of the primary aims of NHEXAS was to identify geographical variation in exposure to hazardous chemicals (Pellizzari et al. 1995), Cressie et al. (2007) proposed supplementing the spatially sparse NHEXAS Region 5 data with information on background levels of As in global environmental media. Specifically, background concentrations of As in both topsoil and stream sediments were synthesized using the approach developed in Calder et al. (2008) and were used to drive the soil-related individual exposure pathways. In addition to incorporating background levels of As in soil across AZ, in this paper we also incorporate background levels of As in water and air into our (Bayesian) pathways analysis. Rather than using this supplemental, or global, environmental information to build informative priors for the county-level mean for each local environmental medium (as was done by Cressie et al. 2007), we use mixture models that account for the uncertainty due to the spatial misalignment of the supplemental data and the NHEXAS individuals. In the remainder of this section, we provide an overview of the various data sources that are used in our Bayesian hierarchical pathways model.
2.2
NHEXAS data
The Phase I NHEXAS AZ data were collected using a three-stage, population-based sampling design. In Stage I, 1,200 households were approached and asked to complete descriptive questionnaires. Of the 954 that responded, a subset of 505 completed these questionnaires and had soil and dust analyses collected (Stage II). Our analysis is based on the final Stage III sample, which consisted of a subset of 179 individuals for whom data were collected over a seven-day period. Table 1 lists the number of NHEXASsampled individuals per county in AZ, along with the population of each county (in thousands) based on the 1990 Census. (There are 178 individuals in the table because
4
Hierarchical Model Building, Fitting, and Checking County #Individuals Population County #Individuals Population County #Individuals Population
Apache 4 77 Greenlea 5 217 Pima 44 1021
Cochise 8 138 La Paz 4 117 Pinal 10 243
Coconino 8 136 Maricopa 4 9 Santa Cruz 6 47
Gila 13 62 Mohave 0 26 Yavapai 11 227
Graham 4 40 Navajo 49 4022 Yuma 8 213
Table 1: The number of NHEXAS individuals in each county of AZ, along with the population (in thousands) according to the 1990 Census.
one individual could not be matched to a household). As expected, there are more sampled individuals in counties with larger populations. Further details on the NHEXAS AZ sampling design can be found in Robertson et al. (1999). Only the county is listed for each individual – no finer-scale spatial information is provided for the NHEXASsampled individuals. The NHEXAS AZ data were obtained from the Human Exposure Database System (HEDS) at the EPA (http://oaspub.epa.gov/heds/study_dir_frame?st_id= 23159). From this database, we extracted the As measurements in the environmental media, as well as in the Urine biomarker, for 178 individuals. All As levels in our analysis are concentrations of total (inorganic plus organic) As in units of µg/l; the natural log concentration measurements and natural log of the MDL values are modeled in our analysis. The variables of interest are summarized in Table 2. For each variable, we include the extent of missingness and left-censoring due to values being below their MDL. Personal Air and Soil have the greatest number of missing values, while Indoor Air, Outdoor Air, and Urine have the most observations below the MDL. Water is the only NHEXAS medium that is observed completely. The implications of the amount of missingness and censoring for each medium on our pathways analysis will be discussed in Section 4. The data documentation from NHEXAS in AZ (http://oaspub.epa.gov/eims/xmlreport.display?deid=22956\&z_chk=3399) lists the relative standard deviation (RSD) associated with each medium. The RSD is the absolute value of the coefficient of variation and is often expressed as a percentage. Following Santner et al. (2008, Section 2.2.4), we converted these values into measurement-error precisions (provided in the rightmost column of Table 2) for use in our Bayesian hierarchical pathways model.
2.3
Global-water data
Background levels of the As concentration in water were obtained from the Water Quality Division of the Arizona Department of Environmental Quality. This division man-
Craigmile, Calder, Li, Paul, and Cressie
Media Urine
Personal Air
Indoor Air Outdoor Air Soil
Sill Dust
Food Beverage
Water
Description Morning void urine samples were collected on the third and seventh days of the study. Air samples were collected for a subset of the participants using monitors worn by the participants for a period of 144 hours. Integrated six-day air samples were collected in the primary living area of the participants’ homes. Integrated six-day samples were collected at a location outside the participants’ homes. Soil samples were collected by a sweeping method from an area with high traffic at the primary entrance to the home and by a ring collection method from exposed soil in the primary outdoor activity areas. Dust samples were collected from a windowsill in the participant’s primary living area. NHEXAS participants were required to prepare or obtain duplicate samples of the food and beverages they consumed for four consecutive days. Composites were separated into beverage intake and food intake. Tap-water samples were collected from participants’ homes after flushing the pipes for a period of 3 minutes.
5
#Missing 12
# 1 .
k=1
In the model (2), we assume for each medium that the baseline mean is constant across the state. The choice of pathways {SjM : j = 1, . . . , N M } that we use comes from the baseline model of Clayton et al. (2002), which was used to model As concentrations in
10
Hierarchical Model Building, Fitting, and Checking
Figure 3: The top panel shows a graphical representation of Clayton et al.’s structure linking the various environmental media and the biomarker. Arrows connecting the different nodes in the model indicate the choice of pathways, SjM , j = 1, . . . , N M . Boxes with a double outline denote those media that are part of the GLE models. The bottom panel shows the pathways without Personal Air, that were used in the final version of our LEB model.
Craigmile, Calder, Li, Paul, and Cressie
11
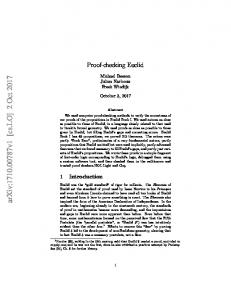
the NHEXAS study for US EPA Region 5. A graphical view of this structure is shown in the top panel of Figure 3. To assess whether or not Clayton et al.’s structure is reasonable for the log As concentrations observed in the NHEXAS study for Arizona (AZ), we looked at a number of graphical summaries of the data. In this preliminary exploratory data analysis (EDA), we replaced any log concentration values below the MDL, by half the log MDL value and ignored any missing values. One summary that gives some credence to Clayton et al.’s structure is shown in the correlation table in Figure 4. The numbers in the table are the sample correlations between pairs of log As concentrations in each medium. Marginally, ignoring any multiplicity considerations, we conducted a test to see whether or not the population correlation coefficient for each pair of media is zero – dark gray shading denotes a P-value less than 0.05, light gray shading denotes a P-value between 0.05 and 0.1, and no shading denotes a P-value greater than 0.1. Rectangles around the correlation values indicate those covariates that appear in Clayton et al.’s model for each response. For example, Beverage, Food, Sill Dust, Indoor Air, and Personal Air all appear in Clayton et al.’s regression model for arsenic in Urine. This exploratory analysis supports Clayton et al.’s pathways structure, except for media with a large number of missing values or values below the MDL (e.g., Soil, Personal Air, Indoor Air, and Outdoor Air). LEB model prior distributions We assume independence between the prior parameters and take the media-specific mean terms, {µM j }, and slope parameters that link the differM ent media in the LEB model, {βjk }, to have N(0, 1000) prior distributions; independence is a maximum-entropy solution when nothing is known about the parameters’ joint distribution (e.g., Cressie et al. 2004). The media-specific process precisions, {τjM }, are given Ga(0.001, 0.001) priors (here Ga(a, b) denotes a gamma prior with shape a and rate b). As stated previously, the measurement-error precisions, {ωjM }, are assumed known and are determined using the method described in Santner et al. (2008, Section 2.2.4).
3.2
The global-to-local-environment (GLE) models
M We now consider alternative versions of the model for {Xji } (Equations 1 and 2) for medium j that draw on supplemental data sources and knowledge about the background spatial processes driving the variation in As levels in that medium. In Section 4, we consider the impacts on inferences for As exposure pathways when these global-to-localenvironment (GLE) models are used.
Global-water model We start with an exploratory data analysis of the global-water data discussed in Section 2.3. The left-hand panels of Figure 5 show the histograms of log As concentrations of NHEXAS and PWS water measurements, both given on the log µg/l scale. For the PWS
12
Hierarchical Model Building, Fitting, and Checking
Personal Air
Indoor Air
Outdoor Air
Soil
Surface Dust
Food
Beverage
Water
0.2
0
−0.1
0
0.3
0.2
0.1
0.5
Beverage
0.2
−0.1
0.1
0
0.2
0.1
0.1
Food
0.3
−0.6
0
−0.1
−0.1
0.1
Surface Dust
0.2
−0.3
0.1
0
0.1
Soil
−0.2
0.2
0.3
−0.2
Outdoor Air
−0.1
0.2
0.3
Indoor Air
−0.2
−0.1
Personal Air
−0.3
−0.1
Water
Urine
covariate
response
0.5 0.1
0.1
0.1
0.1
0.2
0.1
−0.1
0.2
0.3
−0.2
0
−0.1
0
0
0.3
0.3
0.1
0
0.1
−0.1
0.2
0.2
−0.3
−0.6
−0.1
0
Figure 4: The numbers in the table represent the pairwise correlations between the log As concentrations observed in each medium. To calculate each correlation, we removed the missing values and used half the MDL when a datum was censored. The dark gray shading indicates that a pairwise correlation test has a marginal P-value less than 0.05; the light gray shading indicates a marginal P-value between 0.05 and 0.1. A rectangle around a correlation value indicates for a given response (columns), which covariates (rows) are used in Clayton et al.’s model.
data, the observations below the MDL are denoted by tick marks along the x-axis of the histograms. These two distributions look remarkably similar; both of the distributions are slightly right-skewed, although the PWS concentrations have a slightly longer right tail. This similarity lends some credence to the GLE model that we now specify. Global-water data model Not all of the N W public water systems (PWS) in AZ have an observation available, while some water systems have multiple observations. As is the case with the NHEXAS data, certain observations were below an MDL and others W : k = 1, . . . , NjW } are missing. For each PWS j ∈ {1, . . . , N W }, let Y W = {Yjk j W W denote the set of Nj observed log As concentrations. Accordingly, we let Z W j = {Zjk :
Craigmile, Calder, Li, Paul, and Cressie
13
NHEXAS Water 37
0.0 0.1 0.2 0.3 0.4 0.5
8
35
5
4
4
49
8
13 4
10 44 6
31 −2
0
2
4
6
8
10
12
4
11
33
Latitude
Density
log NHEXAS Water As concentrations
−115
−113
−111
0
8
−109
Longitude
0.0 0.1 0.2 0.3 0.4 0.5
Density
log PWS As concentrations
−2
0
2
4
6
8
10
12
Figure 5: Left-hand panels show histograms of the observed log NHEXAS Water and the log PWS As concentrations; for the histogram of PWS measurements, the tick marks denote the MDLs. The map in the top right-hand panel shows the number of NHEXAS Water observations in the counties of AZ.
k = 1, . . . , NjW } denote the set of observation-status variables, with Zjk = 0 if the kth W , Zjk = 1 if the value is above the measurement at PWS i is below the MDL value of Mjk W W MDL, or Zjk = 2 if the observation is missing. Let M W j = {Mjk : k = 1, . . . , Nj } be W W the set of MDLs for PWS j. Taking X W j = {Xjk : k = 1, . . . , Nj } to be the collection W W of the latent log As concentrations in PWS j, and letting Y = {Y W 1 , . . . , Y N W }, W X W W W W W W W X = {X 1 , . . . , X N W }, Z = {Z 1 , . . . , Z N W }, and M = {M 1 , . . . , M N W }, we
14
Hierarchical Model Building, Fitting, and Checking
assume that with ω W the measurement-error precision, h Y
W
W
W
|X , Z , M
W
,ω
W
i =
W N Y
h
W W W W YW j |X j , Z j , M j , ω
i
j=1
=d
W N Y
W W W INCM(X W j , 1/ω ; Z j , M j ).
j=1
Global-water process model We take the global-water process defined at each PWS to be conditionally independent given PWS-specific unknown mean parameters, µW = W W {µW j : j = 1, . . . , N }, and an unknown precision parameter τ . That is, we assume that h i X W |µW , τ W =
W NW j N YY
W
NW
j N YY £ W W W¤ ¡ ¢ W =d . Xjk |µj , τ N µW j , 1/τ
j=1 k=1
j=1 k=1
Global-water-to-LEB model We link the global-water process to the process on the Water medium in the LEB model. We define m(W ) to be the index corresponding to M M the Water medium, and let X M m(W ) = [Xm(W ),1 , . . . , Xm(W ),N I ] be the collection of the N I latent individual log As concentrations in Water. Then we assume NI h i Y i h W W M W M M W M Xm(W X m(W ) , ζ |µ , τm(W ) = ),i , ζ i |µ , τm(W ) .
(3)
i=1
We model the joint distribution of the latent log As concentrations in Water and an W W 0 W W , . . . , ζiN = (ζi1 unknown collection of parameters ζ W = {ζ1W , . . . , ζN W) , I }, where ζ i W that indicate whether a PWS serves an individual (i.e., where ζij = 1 implies that W individual i is served by PWS j and ζij = 0 implies that individual i is not served by PWS j). We decompose the factors in the right-hand side of (3) by assuming that h i W M W M Xm(W = ),i , ζ i |µ , τm(W ) =
h i W W M W M Xm(W ),i |ζ i , µ , τm(W ) [ζ i ] W N Y
W ³h i´ζij ³ ´ W M W M Xm(W |µ , τ × Mult 1, λ c(i) , ),i j m(W )
j=1
where Mult(n, p) denotes the multinomial distribution with parameters n and proba´0 ³ W W , where bility vector p. For each i = 1, . . . , N I , we take λW c(i) = λc(i),1 , . . . , λc(i),N W λW c(i),j is equal to the proportion of the population of county c(i) that is served by PWS j, and c(i) denotes the individual i. Finally, we assume that h i ³ county containing ´ M W M W M Xm(W ),i |µj , τm(W ) =d N µj , 1/τm(W ) .
Craigmile, Calder, Li, Paul, and Cressie
15
Global-water prior distributions Across the PWSs we assume that
£ W W W¤ µ |α , C =
W N Y
j=1
W
N Y £ W W W¤ µj |α , C =d N(αW , 1/C W ), j=1
where αW has a specified N(0, 0.3) prior distribution and C W has a specified Ga(0.001, 0.001) prior distribution. The priors for ω W and τ W are also specified Ga(0.001, 0.001) distributions. We assume all global-water prior distributions are mutually independent. Global-soil model Looking towards modeling these concentrations jointly with the NHEXAS soil data, Figure 6 shows a summary of the NHEXAS soil, the topsoil, and the stream sediment log As concentrations. The histograms in the figure show that the three sets of concentration measurements have similar distributions, each having a slight right-skewness 3 (the median NHEXAS log concentration value is 1.89 log µg/m , versus the median 3 topsoil log concentration value of 1.63 log µg/m and the median stream sediment log 3 concentration of 1.83 log µg/m ). Given the aridness of AZ, it is not surprising that the distributions are so similar. The top right-hand figure shows the number of observed (i.e., not missing) NHEXAS soil measurements for each county of AZ, highlighting the fact that the information content is sparse in many counties. Compared with the locations of the topsoil measurements (left-hand panel of Figure 1), we can see that the topsoil measurements are mostly uniformly spread across the region. On the other hand, the map of the HUC8 regions, with the stream sediment measurements denoted by crosses (right-hand panel of Figure 1), shows that the stream sediment measurements are spatially clustered. The data and process models shown below for the log As concentrations in topsoil and stream sediments are taken from Calder et al. (2008). We complete our model by linking these media to the NHEXAS soil-related media processes in the LEB model using a mixture model (not part of Calder et al. 2008). This mixture model captures the uncertainty in locations of the NHEXAS individuals across AZ and the uncertainty due to our not having precise geographic information for the NHEXAS individuals (NHEXAS only provides county of residence). Our approach accommodates the spatially misaligned sampling schemes of NHEXAS, USSoils, and NGS. Global-soil data model The global-soil data model draws on both As concentration measurements in topsoil and in stream sediments. We let Y T (si ) denote the log As concentration observed in topsoil at location si and define Y T = {Y T (si ) : i = 1, . . . , N T } to be the collection of the N T topsoil observations. We denote the latent topsoil process
16
Hierarchical Model Building, Fitting, and Checking
NHEXAS Soil
0
35
0
4
0
0
6
2
3
4
5
6
0
0
31
0.0
1
−115
−113
0
4
10 42
0
2
0
33
0.4
Latitude
0
0.2
Density
0.6
37
0.8
log NHEXAS Soil As concentrations
−111
−109
Longitude
0.6 0.0
0.2
0.4
Density
0.4 0.0
0.2
Density
0.6
0.8
log Stream sediment As concs.
0.8
log Topsoil As concentrations
0
1
2
3
4
5
6
0
1
2
3
4
5
6
Figure 6: The top panels show a histogram and a map of the number of observed log NHEXAS Soil As concentrations. The lower panels show a histogram of the log USGS topsoil and log NGS stream sediment As concentrations, respectively. at X T (·) and assume that h
T
T
Y |X (·), ω
T
T
i =
T
N N Y Y £ T ¤ ¡ ¢ Y (si )|X T (si ), ω T =d N X T (si ), 1/ω T , i=1
i=1
where X T (·) is a continuously indexed spatial process defined on the domain D ⊂ R2 representing AZ, and ω T is the measurement-error precision. H For the stream sediment observations, we let Yjk be the kth log As concentration measurement taken in the jth HUC8 region (watershed) and denote the collection of H stream sediment observations Y H = {Yjk : k = 1, . . . , NjH , j = 1, . . . , N H }, where NjH
Craigmile, Calder, Li, Paul, and Cressie
17
is the number of observations in the jth HUC8 region and N H is the number of HUC8s. H We denote the latent stream-sediment process as X H = {X1 , . . . , XN H } and assume that h i Y H |X H , ω H =
H NH j N YY
H
NH
j N YY ¢ £ H H H¤ ¡ Yjk |Xj , ω =d N XjH , 1/ω H ,
j=1 k=1
j=1 k=1
where ω H is the measurement-error precision. Global-soil process model We follow Calder et al. (2008) and assume that, conditional on the stream-sediment process X H , the topsoil process {X T (s) : s ∈ D} is independent across locations in D. At each location, we assume that the mean of the latent log topsoil process is linearly related to the stream-sediment process via ³ ´ £ T ¤ H , 1/τ T , X (s)|β0T , β1T , τ T =d N β0T + β1T Xh(s) (4) where h(s) denotes the HUC8 region that contains location s. The spatial dependence in the global-soil model is introduced through a Gaussian prior on the latent stream-sediment process, defined over watersheds. Specifically, we use a conditional autoregressive (CAR) model: h i ³ £ ¤−1 ´ X H |µH , τ H , γ H =d NN H µH 1, τ H (I − γ H A) , (5) where Nl denotes an l-dimensional normal distribution, A is a spatial neighborhood matrix, γ H is an unknown spatial-dependence parameter, and τ H is the stream-sediment process precision. The (i, j) element of A is set to 0 if i = j, 1 when the centroids of watershed (i 6= j) are within 1 degree latitude and 1 degree longitude of one another, and zero otherwise. A justification for this choice of neighborhood structure, in terms of the watershed size, is discussed in Calder et al. (2008). M I Global-soil-to-LEB model Letting X M m(S) = {Xm(S),i : i = 1, . . . , N } be the collection of the N I individuals’ latent log As concentrations in the medium Soil, we assume that
h
T T M XM m(S) , ζ |X (·), τm(S)
I
i =
N h Y
i M M Xm(S),i , ζ Ti |X T (·), τm(S) .
j=1
The difference between this linking model and that for water is that the unknown collection of parameters, ζ T , captures the uncertainty in the spatial location of NHEXAS individuals. From (4), we see that the spatial distribution of X T (s) only depends on the spatial location through h(s), the HUC8 region containing s. Thus, rather than T assigning NHEXAS individuals to watersheds, we define an unknown parameter ζij such T that ζij = 1 if NHEXAS individual i is located in HUC8 region j, and zero otherwise. ´0 ³ Then, for each i = 1, . . . , N I , we define λTc(i) = λTc(i),1 , . . . , λTc(i),N H , where λTc(i),j
18
Hierarchical Model Building, Fitting, and Checking
is equal to the proportion of the area of the county c(i) that contains HUC8 region j (which is zero if a HUC8 region is not contained in county c(i)). Assume that NHEXAS individuals are uniformly distributed across a county, and that h
M M Xm(S),i , ζ Ti |X T (·), τm(S)
=
H N Y
T ³h i´ζij M M Xm(S),i |X T (at any location in the HUC8 region j), τm(S) ×
j=1
=d
H N Y
i
³ ´ Mult 1, λTc(i) T ³ ³ ´´ζij M N X T (at any location in the HUC8 region j), 1/τm(S) ×
j=1
³ ´ Mult 1, λTc(i) .
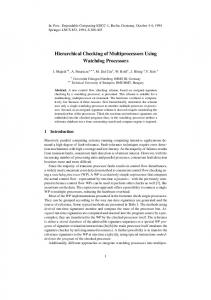
Global-soil prior distributions We assumed a Ga(0.001, 0.001) prior on the stream sediment precision, ω H . Because of a relatively small number of observations for topsoil (left-hand panel of Figure 1), we assume that ω T is known, and it is fixed to equal the measurement-error precision of Soil in the NHEXAS study. The priors for the intercept and slope in the model relating topsoil and stream sediments, β0T and β1T , are independent N(0, 1000) distributions. The stream sediment mean, µH , is also given a N(0, 1000) prior, and we assume Ga(0.001, 0.001) priors for the process precisions, τ T and τ H . We assume a uniform distribution on the spatial-dependence parameter, γ H , in the stream sediment model. The bounds on the uniform distribution are determined by the reciprocal of the smallest eigenvalue (lower bound) and the reciprocal of the largest eigenvalue (upper bound) of the spatial neighborhood matrix A, ensuring that I − γ H A is positive-definite and hence that the distribution of X H is proper (e.g., Banerjee et al. 2004, p.80). All our priors are proper. Global-air model Figure 7 shows time series plots of the observed IMPROVE air-monitor readings of the ambient log As concentrations across AZ, at the fourteen locations displayed in Figure 2. The vertical gray lines indicate the time period during which the NHEXAS study was conducted for the county containing the monitor. As can be seen, there is a clear lack of information about the As level during the NHEXAS time period for 10 out of the 14 monitors. Due to the censoring below the MDL and the trending that is readily apparent in some of the series (e.g., sites #1, #5, and #8), we are hesitant to fit any statistical model to these global-air data. Because of these data-coverage problems for air, we decided to provide an informative prior only for the intercept in the prior model for the Outdoor Air log As concentrations defined by (2). Let m(A) be the index corresponding to the medium Outdoor Air in the LEB model (2). We assume that µm(A) ∼ N (αA , 1/C A ), where in this case αA and C A are fixed. From the information
Craigmile, Calder, Li, Paul, and Cressie
19
contained in Figure 2, we set αA = −6 on the log ppm scale, and C A = 1/4, so that the standard deviation of the intercept parameter is 2 on the log ppm scale. This prior has a larger standard deviation than is suggested by the data, to capture the changeof-support of moving from the IMPROVE monitors to the monitors used outside the home in the NHEXAS study.
4
Model fitting and checking
Before presenting the results of our analysis of arsenic exposure pathways, we provide behind-the-scenes details of our Bayesian analysis. We hope that these details will start a discussion on strategies for fitting complex Bayesian hierarchical models in a defensible manner.
4.1
Data management
In our study, datasets were stored in a hierarchy of directories by data type. As a security feature, access to the original datasets was limited. Instead, modelers had access to the derived data. The scripts used to create these derived dataset were stored along with the derived datasets. Data management and processing was carried out using ArcGIS (for spatial data management), SAS, and R (R Development Core Team 2007). The maptools R library (http://cran.r-project.org/src/contrib/Descriptions/ maptools.html) was also used for further spatial-data management and manipulation. In terms of data format, we found that comma delimited (CSV) text files, although large in size, tended to be the easiest to use for exploratory data analysis and modeling, especially when using many different software packages.
4.2
Implementing the Markov chain Monte Carlo algorithm
In this analysis, the posterior distributions for the model parameters are not available in closed form. Instead, we use a hybrid MCMC sampling algorithm that sequentially samples from the full conditional posterior distributions of the model parameters (Gelfand and Smith 1990). Since some of these full conditional distributions are also not available in closed form, we employ independence or symmetric-random-walk Metropolis steps (Tierney 1994). Although there are other versions of the Metropolis-Hastings algorithm that may have better convergence properties, these methods are easy to implement and straightforward to tune in order to achieve appropriate mixing. In practice, the choice of more complicated candidate distributions and algorithms usually requires careful implementation and tuning. All of the full conditional distributions used in this analysis are provided in the Supplemental Material document2 . To implement the MCMC algorithm, one needs to check that the full conditional distributions are analytically correct, check whether the algorithm converges and mixes well (i.e., whether the full parameter space is adequately 2 available
from http://www.stat.osu.edu/~pfc/supplemental/Arizona_supplemental.pdf
Hierarchical Model Building, Fitting, and Checking
Jan 1997
Jan 1997
Jan 1988
Jan 1997
Jan 1988
−10 −6 Jan 1988
Jan 1997
Jan 1997
site #12 (PIMA)
Jan 1988
Jan 1997
−10 −6
site #14 (GILA) log As conc.
log As conc.
−10 −6
Jan 1997
Jan 1997
−10 −6
log As conc.
log As conc.
−10 −6
Jan 1997
Jan 1997
site #9 (MARICOPA)
site #11 (PIMA)
site #13 (GILA)
Jan 1988
Jan 1988
−10 −6
−10 −6 Jan 1988
site #10 (PINAL)
Jan 1988
Jan 1997
site #8 (APACHE) log As conc.
−10 −6
log As conc.
site #7 (PIMA)
site #6 (APACHE) log As conc.
−10 −6 Jan 1988
Jan 1997
−10 −6
Jan 1988
Jan 1988
site #5 (COCONINO) log As conc.
−10 −6
log As conc.
site #4 (YAVAPAI)
Jan 1997
−10 −6
−10 −6 Jan 1988
log As conc.
Jan 1988
site #3 (YAVAPAI) log As conc.
site #2 (COCONINO) log As conc.
−10 −6
log As conc.
site #1 (COCHISE)
log As conc.
20
Jan 1988
Jan 1997
Figure 7: Time series plots of the log As concentrations for all the observed values at the 14 IMPROVE air-monitor locations. The vertical gray lines delimit the time range of NHEXAS data collection in the county where the monitor is located.
Craigmile, Calder, Li, Paul, and Cressie
21
explored), as well as check the sensitivity of the inferences to the choice of prior distributions and aspects of the data. All of these issues are important in fitting our Bayesian hierarchical pathways model, due to the large number of pathways (processes) and different data sources. Each dataset can have missingness and censoring (due to MDLs). The data also have different (initially incoherent) spatial scales. For some data types, spatial coverage is limited, which may induce identifiability problems into the analysis. In coding the MCMC algorithm, we initially fixed most of the model parameters at reasonable values. Then we systematically unfixed specific parameters (or blocks of parameters) and assessed convergence and mixing of the MCMC algorithm. This approach also proved immensely helpful for debugging. In addition, we generated synthetic data from our model and checked that the fitted model (fitted to the synthetic data), correctly recovered the values of the parameters used to generate the data. Whenever possible, we also fitted components of our model using OpenBUGS, via the R library BRugs (http://cran.r-project.org/src/contrib/Descriptions/BRugs. html). This strategy provided yet another check for the primary implementation in R. There were a number of techniques that helped us in implementing the MCMC algorithm. Depending on the robustness required for sampling, we used a Cholesky decomposition or an eigenvalue decomposition to sample the normally distributed slope parameters of our regression models. (The eigenvalue decomposition is more robust, but much slower.) For censored data, we sampled any values that were below the MDL using a rejection-sampling algorithm for the truncated normal distribution (Geweke 1991). While imputation of the missing data within our MCMC algorithm is not necessary, we found that it simplified the computer code and cut down on errors in implementation. We argue that although MCMC algorithms need to be efficient, they also need to be straightforward to read and debug, especially if the model/code needs to be modified in the future. We found that making the computer code overly general can lead to slow execution times.
4.3
Component-wise model fitting and checking
In this section, we consider the ability of different models to fit the NHEXAS data. We first fit the local-environment-to-biomarker (LEB) model and then fit a model with the LEB pathways augmented with global-to-local-environment (GLE) model components. This LEB+GLE model’s fit is compared to that of the LEB model in a number of ways. Through a comparison of the posterior distributions from the two models, we explore the extent to which the extra global-environmental information results in Bayesian learning about individual pathways of exposure. LEB model We began by fitting the local-environment-to-biomarker (LEB) model containing all of the pathways shown in the top panel of Figure 3. As is traditionally done in any MCMC algorithm, we ran multiple chains from multiple starting locations. After a burn-in of
22
Hierarchical Model Building, Fitting, and Checking
100,000 iterations, we ran each chain for a further 200,000 iterations. Although not entirely necessary, we reduced the autocorrelation in the chain by thinning and storing every 20th iteration. Hence, our inferences are based on 10,000 samples. Trace plots and autocorrelation plots were used to diagnose convergence of the chains. When fitting M the LEB model, the mean parameters {µM j }, slope parameters {βj,k }, and precision parameters {τjM }, where the index j corresponded to Personal Air, Indoor Air, and Outdoor Air, never converged; running the chains longer did not remedy this situation. We believe we have isolated the cause of this problem to having too little information (i.e, few observed values above the MDL) about the various air-media measures as part of NHEXAS, especially for the Personal Air medium (Table 2). This lack of data is most likely due to the burdensome nature of personal-air exposure monitors (Samet and Jaakkola 1999). That is, the lack of convergence is a result of a data-induced, as opposed to a model-induced parameter nonidentifiability issue. To see if the problem could be resolved by removing Personal Air, we refitted the model without the Personal Air medium, now linking the Indoor Air and the Outdoor Air latent processes directly to the Urine biomarker latent process (essentially, we removed the Personal Air node in the top panel of Figure 3). This modification helped a little, but there was still not enough information in the data to identify parameters in the Indoor Air to Urine, the Outdoor Air to Urine, and the Outdoor Air to Indoor Air pathways. Following standard practice for addressing multicollinearity in multiple linear regression models, we decided to remove one of the direct links between the air media and Urine. Since most people spend considerably more time indoors rather than outdoors (Committee on Advances in Assessing Human Exposure to Airborne Pollutants 1991), we decided to keep the direct link from Indoor Air to Urine and remove the Outdoor Air to Urine link. Removing the Outdoor Air to Urine link channels all the air-media pathways to the biomarker through an individual’s Indoor Air. With these modifications, our identifiability problems were resolved. Henceforth, the LEB model without Personal Air, where Indoor Air is linked directly to Urine, will be referred to as the LEB model; the corresponding pathways diagram is shown in the bottom panel of Figure 3. Before we summarize this LEB model, we give a description of how we diagnosed its fit. We started by producing standardized residual plots for the log As concentration M process for each of the media in the NHEXAS study, X M j , j = 1, . . . , N . That is, for I each each medium j, and each individual i = 1, . . . , N , we defined X ¡ ¢ −1/2 M M M M {p} , {p} + {p}X Xji {p} − µM β {p} = τjM {p} rji ki j jk M k∈Sj
where θ{p} denotes the pth sample of the parameter θ from the joint posterior distribution (Gelman et al. 2004, p.170). We found that taking a random realization (or a M M few realizations) from the posterior distribution of parameters, {Xji }, {µM j }, {βjk }, M and {τj }, and then examining plots of the standardized residuals, gave informative diagnoses of model fit. As an example, Figure 8 contains such residual plots for the Urine pathway. The histogram of the standardized residuals (first row, left-hand panel) as well as the plots of the residuals versus the observation number and process vari-
Craigmile, Calder, Li, Paul, and Cressie
23
ables in the pathways to Urine from Indoor Air, Sill Dust, Soil, Food, and Beverage, respectively, show residuals in the range (-6,6) and none that could be identified as unusual. There is also some evidence of non-constant variation in the residual plots for particular media. A plot of the standardized residuals versus the county in Figure 8 (bottom row, right-hand panel) indicates that the variability is not uniform across counties. Examining model fit based on a single random draw from the latent processes residual distributions was useful in this case, however, there is certainly a question as to their calibration and their applicability to other models and datasets. (This also opens up the possibility of posterior predictive checks for these models, which would be quite involved given the missingness and censoring in the data.) Figure 9 displays a summary of the marginal posterior distributions of the slope M parameters {βjk } in the LEB model (bottom panel, Figure 3). Consider the Urine, Food, and Beverage media and their (linear) dependence on other media. We display the posterior mean (black circle) and a 95% credible interval (solid black line) for the slope parameters linking the aforementioned media to other media. For example, Urine is modeled as being possibly related to Indoor Air, Sill Dust, Soil, Food, and Beverage. (We define and compare the gray circles and dashed lines below.) From Figure 9, we see that log Urine As concentrations are positively linearly related with log Sill Dust, log Food, and log Beverage As concentrations. Although the intervals relating log Urine As concentrations with log Indoor Air and log Soil As concentrations cover mostly negative values, they do include zero, indicating no significant linear relationships. In the direct pathway to Food, there are no significant linear relationships between Food and Indoor Air, Food and Sill Dust, and Food and Water. Among the direct pathways to Beverage, an increase in the log Water or the log Indoor Air As concentrations results in an increase in the log Beverage As concentration. As expected, among the direct pathways to Indoor Air, there is a positive relationship with Outdoor Air and Soil. Finally, the direct pathway to Sill Dust from Indoor Air is not significant. The black circles and lines in Figure 10 show posterior summaries (the circles denote the posterior means, the lines are 95% credible intervals) for the process variances {1/τjM }. We can see that the process variances of Urine, Sill Dust, and Outdoor Air are the largest, while the process variance of Soil is the smallest. LEB model + global water + global soil + global air In our model building exercise, we progressively added the global-water, global-soil, and global-air models to the LEB model, checking the results sequentially. In the interests of space, we summarize the model that includes all three components. We collectively refer to the three global-environment models as the global-to-local-environment (GLE) model components and our final model as the LEB+GLE model. We begin by examining the fit of the LEB+GLE model and comparing it to the fit of the LEB model. Figure 11 contains plots of the standardized residuals for the direct pathways leading to Urine for the LEB+GLE model. Comparing the fit of the LEB model (Figure 8) to the LEB+GLE model (Figure 11), we find that the addition of the
2
4
6 2 −2
6
0
50
1
2
6 2 −2
3
−2
0
2
2
3
4
6 2 −2
5
0
2
4
6 2
GREENLEE
−2
GILA
3
GRAHAM
Beverage
2
COCONINO
1
APACHE
0
COCHISE
−1
−6
standardized residual
6 2 −2 −2
8
Food
−6
standardized residual
Soil
6
YUMA
1
YAVAPAI
0
−6
−2
2
6
standardized residual
SillDust
−6
standardized residual
IndoorAir
4
SANTA CRUZ
0
PIMA
−1
−6
standardized residual
6 2 −2 −2
150
Observation number
−6
standardized residual
standardized residuals for Urine
100
PINAL
0
NAVAJO
−2
MOHAVE
−4
MARICOPA
−6
−6
standardized residual
Hierarchical Model Building, Fitting, and Checking
0.00 0.10 0.20
Density
24
Figure 8: Standardized residual plots for the direct pathway to Urine in the LEB model (bottom panel, Figure 3). Moving from left to right, top to bottom, there is a histogram of a single draw of the standardized residuals for Urine, a plot of the residuals by observation number, plots of the residuals versus each of the five media in the Urine pathway, and the standardized residuals for Urine, broken down by County.
Craigmile, Calder, Li, Paul, and Cressie
25
Urine
IndoorAir SillDust Soil Food Beverage
Food
IndoorAir SillDust Water
Beverage
IndoorAir SillDust Water
IndoorAir
OutdoorAir Soil
SillDust
IndoorAir −0.75
−0.50
−0.25
0.00
0.25
0.50
0.75
1.00
Figure 9: The circles (black: LEB model; gray: LEB model + global water + global M }, linearly soil + global air) denote the posterior means of the slope parameters {βjk relating medium k (right-hand side) to medium j (left-hand side) in the LEB model. The horizontal lines through each circle denote the corresponding 95% credible intervals.
26
Hierarchical Model Building, Fitting, and Checking
Urine Food Beverage IndoorAir OutdoorAir Soil SillDust Water
0.00
0.25
0.50
0.75
1.00
1.25
1.50
1.75
Figure 10: The circles compare the posterior means of the process-variance parameters {1/τjM } (black circles: LEB model; gray circles: LEB model + global water + global soil + global air). The horizontal lines through each circle denote the corresponding 95% credible intervals. GLE components results in substantially less variation in the residuals. In terms of inferences on the exposure pathways, Figures 9 and 10 summarize the fitted LEB+GLE model. The gray circles and dashed lines display, respectively, the M posterior means and 95% credible intervals for the slope parameters, {βjk } (Figure 9), M and process variances, {1/τj } (Figure 10). We compare these inferential summaries to the corresponding summaries for the LEB model without the GLE components. In M terms of the posterior distributions of {βjk } we found that adding the global components does not greatly modify our inferences on the pathways of exposure to As. The only exception to this general pattern is that the 95% credible interval for the slope parameter corresponding to the link from Soil to Urine is shifted slightly to the right when the GLE components are included. This difference casts doubt on the negative relationship of Urine with Soil observed when only the LEB model is fitted, which the science in fact
Craigmile, Calder, Li, Paul, and Cressie
27
suggests should be positive. In terms of the process variances, {1/τjM }, including the global components greatly reduces the process variances for the Soil and Water media, but does not affect the process variances for the other media. To illustrate the effect of adding the GLE components to the LEB model, Figure 12 displays boxplots of the posterior means of the local-environment Soil and Air processes for each individual, broken down by whether or not the corresponding NHEXAS measurement is missing or below the MDL. (There are no below-MDL values for local-environment Soil observations. We do not show Water since there are no localenvironment Water observations missing or below the MDL.) In each panel of Figure 12, we compare the distribution across individuals of the local-environment process posterior means from the LEB model and the LEB+GLE model. We can see that the distributions of posterior means differ for individuals with NHEXAS individuals’ observations that are missing or below the MDL. Taking for example the local-environment Soil process, the individual-specific posterior means tend to be larger for the LEB model than they are for the LEB+GLE model. This illustrates Bayesian learning from the global-soil model. Similar conclusions can be made for the local-environment Air process, which implies that our simple global-air model does in fact influence the local-environment Air process.
4.4
Further sensitivity analyses
Given the variation in the quality and extent of the data sources used in our analysis, we explored the sensitivity of the LEB model to aspects of the data. Due to the amount of time required for model fitting, we did not include the global-water, global-soil, or global-air models with the LEB model in this exercise. As an example of such sensitivity analyses, we left out all individuals in each county in turn, and refitted the LEB model. Our interest was in the influence of any one county’s NHEXAS data upon our results. M Figure 13 shows summaries of the posterior distributions of the slope parameters {βjk } in the direct pathways to Urine for fourteen (the number of counties with observations) separately fitted models. The gray horizontal lines denote the corresponding slope M parameters {βjk } obtained from fitting the LEB model to the full dataset. This figure indicates, with perhaps the exception of Pima county, that the posterior distributions are robust to the data by county, which provides us some confidence in our results. In addition to issues regarding the sensitivity of our results to aspects of the data, we also considered our choice of prior distributions. Throughout, we have relied heavily on the use of normal and gamma priors. Certainly, the use of normal priors is standard for modeling log concentrations. However, the use of gamma priors for precisions is more open to debate (e.g., Gelman 2006). As we fitted our various models, we checked that our results were not sensitive to the choice of the parameters in the gamma prior distributions. In a few smaller versions of the model, we replaced the gamma prior distributions by other, commonly used, more informative prior distributions, such as uniform distributions. (Then the full conditional distributions are not available in closed form and thus Metropolis-Hastings steps were required.) Our inferences were not affected by these changes in the prior distributions.
0
2
6 2 −2
4
0
50
1
2
6 2 −2
3
−1
0
1
3
4
6 2 0
2
4
8
6 2
YUMA
YAVAPAI
SANTA CRUZ
GREENLEE
GILA
−2
GRAHAM
3
COCONINO
Beverage
2
APACHE
1
COCHISE
0
−6
standardized residual
6 2 −2
−1
6
Food
−6
standardized residual
Soil
−2
5
−2
5
PIMA
2
PINAL
1
4
−6
standardized residual
6 2 −2 0
3
SillDust
−6
standardized residual
IndoorAir
2
NAVAJO
0
−6
standardized residual
6 2 −2
−1
150
Observation number
−6
standardized residual
standardized residuals for Urine
100
MOHAVE
−2
MARICOPA
−4
−6
0.15
standardized residual
Hierarchical Model Building, Fitting, and Checking
0.00
Density
28
Figure 11: Standardized residual plots for the direct pathways to Urine in the LEB model + global water + global soil + global air. The plots are described in the caption of Figure 8.
Craigmile, Calder, Li, Paul, and Cressie
0.5
−0.5
−0.5
0.5
3.0 2.0 1.0
LEB LEB+GLE
Air: missing 1.5
Air: below MDL 1.5
Soil: missing
29
LEB LEB+GLE
LEB LEB+GLE
Figure 12: Boxplots of the posterior mean local-environment Soil and Air processes for each subject, broken down by whether or not the corresponding NHEXAS was missing or below for MDL for that subject (as applicable for each media). In each panel, the boxplots compare the posterior means for the LEB model and the LEB+GLE model (LEB + global water + global soil + global air).
4.5
Additional model comparisons
One might argue that the observed improvement in model fit when the GLE components were incorporated into the LEB model is not due to the additional information provided by the global-environmental-media observations, but rather is a result of the “spatial” nature of the GLE models. In other words, by allowing the latent processes to borrow strength from proximate individuals and counties through the GLE models, we can improve the overall model fit. To explore this argument, we fitted an alternative version of the LEB model that allows for spatial dependence in the various media, but does not require additional data. In this alternative model, the prior models for the latent processes (equations 1 and 2) in the LEB model are replaced with spatially dependent county-specific and media-specific intercepts µM j,c(i) , where recall c(i) denotes the county I where NHEXAS individual i resides. For each medium j, {µM j,c(i) : i = 1, . . . , N } are modeled using a CAR model specified in a similar fashion to (5). For these CAR models, we use a neighborhood matrix defined by counties that share a boundary, and we specify prior distributions that are similar to those used in the stream-sediment-process component of the global-soil model. Upon fitting this version of the LEB model with spatially varying intercepts, we found that while the residuals were slightly less dispersed than they were for our original LEB model, our original LEB model with all three GLE components still appears to fit best to the data. In terms of inference on the model parameters, there is no evidence that the spatial-dependence parameters in the CAR models for each media-specific intercept were different from zero. It does appear that the intercepts for the Food, Soil, Sill Dust, and Water media vary by county, although the patterns do not appear to be spatially dependent. On the other hand, the intercepts for the Urine, Beverage, Indoor Air,
GILA GRAHAM GREENLEE MARICOPA MOHAVE NAVAJO PIMA PINAL SANTA CRUZ YAVAPAI YUMA
GILA GRAHAM GREENLEE MARICOPA MOHAVE NAVAJO PIMA PINAL SANTA CRUZ YAVAPAI YUMA
SANTA CRUZ YAVAPAI YUMA
SANTA CRUZ YAVAPAI YUMA
NAVAJO
NAVAJO
PIMA
MOHAVE
MOHAVE
PINAL
MARICOPA
MARICOPA
PINAL
GREENLEE
GREENLEE
PIMA
GILA GRAHAM
GRAHAM
COCONINO
GILA
COCONINO
−1.5
YUMA
YAVAPAI
SANTA CRUZ
PINAL
PIMA
NAVAJO
MOHAVE
MARICOPA
GREENLEE
GRAHAM
GILA
COCONINO
COCHISE
APACHE
−1.5
APACHE
1.0
1.0
COCHISE
0.5
0.5
APACHE
−0.5 0.0
Food to Urine
−0.5 0.0
Soil to Urine
COCHISE
−1.5
COCONINO
COCONINO
−1.5 APACHE
1.0
COCHISE
0.5
APACHE
−0.5 0.0
COCHISE
−1.5
Beverage to Urine 0.5
−0.5 0.0
0.5
SillDust to Urine
−0.5 0.0
IndoorAir to Urine
1.0
1.0
30 Hierarchical Model Building, Fitting, and Checking
M Figure 13: The circles denote the posterior means of slope parameters {βjk } in the direct pathway to Urine, removing the data from each county in turn. The vertical lines through each circle denote the associated 95% credible intervals. The horizontal M } gray line in each panel denotes the posterior mean value of the slope parameters {βjk without removing the data from each county.
Craigmile, Calder, Li, Paul, and Cressie
31
and Outdoor Air media do not appear to vary by county. Under the LEB model with M spatially varying intercepts, the posterior distributions of {βjk } are shifted closer to zero, meaning that we lose significant links under this model. There is greater posterior uncertainty in the slope parameters for pathways leading to Indoor Air and Urine, except for the pathway from Soil to Urine; in the LEB model with spatially varying intercepts, there is stronger evidence of a positive relationship of Urine with Soil. However, when interpreting these findings, it is important to keep in mind the substantial amount of missing and/or censored data for each medium (reported in Table 2). We believe that there is not enough data in each county to benefit from fitting the the LEB model with spatially varying intercepts.
5
Summary of scientific results
We have demonstrated that the structure proposed by Clayton et al. (2002) to explain human As exposure pathways in NHEXAS Region 5 is applicable to the analysis of As exposure pathways in NHEXAS AZ, once the air pathways have been modified, as discussed above. Except for a weakly negative relationship of Urine with Soil and Indoor Air, any declared relationship between media was positive. In particular, Urine showed a positive relationship with Food, Beverage, and Sill Dust. The incorporation of GLE models for global water, global soil, and global air did little to affect these relationships, except (i) to move the negative relationship of Urine with Soil to be closer to zero, (ii) to slightly move the posterior distributions of the parameters of local-environment Soil, and local-environment Air processes for those subjects that contained missing or below MDL values, and (iii) to reduce the variability in the posterior residuals based on the pathway processes that link directly to Urine. Therefore, we conclude that our GLE model did not significantly refine our understanding of the pathways of exposure to As in Arizona, but we did get some increased precision for the Water, Soil, and Outdoor Air media. The incorporation of GLE models still may be of use in assessing spatial variation in exposure across AZ, since the global-water and global-soil data have better spatial coverage than the NHEXAS AZ data. Finally, we note that since pathways of exposure to inorganic As and organic As differ (see Tapio and Grosche 2006), a speciated analysis of As exposure pathways may yield different conclusions, both with regard to the relationship between the local environmental media and the urine biomarker, as well as in terms of the influence of the global environmental media on the results. However, since speciated local-environmental-media measurements and speciated biomarker measurements are not currently available, we were unable to investigate this question.
6
Discussion
The aim of this paper is to start a discussion on strategies for fitting complex Bayesian hierarchical models. If model fitting algorithms are not implemented carefully, inferences will be suspect. Within any application, great care and organization is required.
32
Hierarchical Model Building, Fitting, and Checking
We close with an observation. Following standard ideas of software development, an MCMC algorithm should be coded and tested in “bite-size pieces”. Since problems with mixing and convergence are commonplace, it is not sufficient to fit a large model all at once. Instead, components of large models should be combined in a systematic fashion. If an analysis produces an interesting result, it is necessary to understand which components of the model and of the data are driving the result. In our opinion, fast and reliable implementations of MCMC algorithms with easily extendable and modifiable code are crucial for sensitivity analyses to be performed. Finally, we note that in addition to careful implementation of statistical-model-fitting algorithms, in analyses that involve multiple types and versions of datasets, it is of paramount importance that the data be managed in a documented fashion. That is, any derived data set must be reproducible.
References Banerjee, S., Carlin, B., and Gelfand, A. (2004). Hierarchical Modeling and Analysis for Spatial Data. Boca Raton, FL: Chapman & Hall/CRC. 18 Berliner, L. M. (2003). “Physical-statistical modeling in geophysics.” Journal of Geophysical Research (Atmospheres), 108 (D24): 8776, doi: 10.1029/2002JD002865. 8 Calder, C. A., Craigmile, P. F., and Zhang, J. (2008). “Regional Spatial Modeling of Topsoil Geochemistry.” Biometrics. doi: 10.1111/j.1541-0420.2008.01038.x. 3, 6, 15, 17 Clayton, C. A., Pellizzari, E. D., and Quackenboss, J. J. (2002). “National Human Exposure Assessment Survey: Analysis of exposure pathways and routes for arsenic and lead in EPA Region 5.” Journal of Exposure Analysis and Environmental Epidemiology, 12: 29–43. 3, 9, 31 Committee on Advances in Assessing Human Exposure to Airborne Pollutants, N. R. C. (1991). Human Exposure Assessment for Airborne Pollutants: Advances and Opportunities. The National Academies Press. 22 Cressie, N., Buxton, B. E., Calder, C. A., Craigmile, P. F., Dong, C., McMillan, N. J., Morara, M., Santner, T. J., Wang, K., Young, G., and Zhang, J. (2007). “From Sources to Biomarkers: A Hierarchical Bayesian Approach for Human Exposure Modeling.” Journal of Statistical Planning and Inference, 137: 3361–3379. 3, 8 Cressie, N., Richardson, S., and Jaussent, I. (2004). “Ecological Bias: Use of Maximumentropy Approximations.” Australian and New Zealand Journal of Statistics, 46: 233–255. 11 Gelfand, A. E. and Smith, A. F. M. (1990). “Sampling-based Approaches to Calculating Marginal Densities.” Journal of the American Statistical Association, 85: 398–409. 19
Craigmile, Calder, Li, Paul, and Cressie
33
Gelman, A. (2006). “Comment on “A Comparison of Bayesian and Likehood-based Methods for Fitting Mutilevel Models” by W. J. Browne and D. Draper.” Bayesian Analysis, 1: 515–534. 27 Gelman, A., Carlin, J. B., Stern, H. S., and Rubin, D. B. (2004). Bayesian Data Analysis, 2nd edn. Boca Raton, FL: Chapman & Hall/CRC. 22 Geweke, J. (1991). “Efficient simulation from the multivariate normal and Student-t distributions subject to linear constraints.” In Keramidas, E. M. (ed.), Computing Science and Statistics: Proceedings of the Twenty-Third Symposium on the Interface, 571–568. Fairfax, VA: Interface Foundation of North America. 21 Lauritzen, S. L. (1996). Graphical Models. Oxford, UK: Oxford University Press. 9 Lindley, D. V. and Smith, A. F. M. (1972). “Bayes Estimates for the Linear Model (with Discussion).” Journal of the Royal Statistical Society, Series B, 34: 1–41. 8 McMillan, N. J., Morara, M., and Young, G. S. (2006). “Hierarchical Bayesian Modeling of Human Exposure Pathways and Routes.” 2492–2503. Alexandria, VA: American Statistical Association. 3, 8 NERL and National Center for Environmental Assessment (2000). Strategic Plan For The Analysis Of The National Human Exposure Assessment Survey (NHEXAS) Pilot Study Data. ORD, U.S. EPA. URL http://www.epa.gov/nerl/research/nhexas/strategy.pdf 2 O’Rourke, M. K., Van de Water, P. K., Jin, S., Rogan, S. P., Weiss, A. D., Gordon, S., Moschandreas, D., and Lebowitz, M. (1999). “Evaluations of Primary Metals from NHEXAS Arizona: Distributions and Preliminary Exposures.” Journal of Exposure Analysis and Environmental Epidemiology, 9: 435–445. 2 Pellizzari, E., Lioy, P., Quackenboss, J., Whitmore, R., Clayton, A., Freeman, N., Waldman, J., Thomas, K., Rodes, C., and Wilcosky, T. (1995). “Population-Based Exposure Measurements in EPA Region 5: A Phase I Field Study in Support of the National Human Exposure Assessment Survey.” Journal of Exposure Analysis and Environmental Epidemiology, 5: 327–358. 3 R Development Core Team (2007). R: A Language and Environment for Statistical Computing. R Foundation for Statistical Computing, Vienna, Austria. ISBN 3900051-07-0. URL http://www.R-project.org 19 Robertson, G., Lebowitz, M., O’Rourke, M., Gordon, S., and Moschandreas, D. (1999). “The National Human Exposure Assessment Survey (NHEXAS) Study in Arizona – Introduction and Preliminary Results.” Journal of Exposure Analysis and Environmental Epidemiology, 9: 427–434. 2, 4 Samet, J. and Jaakkola, J. (1999). “The Epidemiologic Approach to Investigating Outdoor Air Pollution.” In Holgate, S., Samet, J., Koren, H., and Maynard, R. (eds.), Air Pollution and Health. London, UK: Academic Press. 22
34
Hierarchical Model Building, Fitting, and Checking
Santner, T. J., Craigmile, P. F., Calder, C. A., and Paul, R. (2008). “Effect and Pathways Modifiers in a Bayesian Pathways Analysis of the National Human Exposure Assessment Survey for Arsenic in EPA Region 5.” Environmental Science and Technology, 42(15): 5607–5614. 4, 11 Seaber, P., Kapinos, F., and Knapp, G. (1987). Hydrologic Unit Maps. U.S. Geological Survey, Denver, CO. 6 Tapio, S. and Grosche, B. (2006). “Arsenic in the aetiology of cancer.” Mutation Research, 612: 215–246. 31 Tierney, L. (1994). “Markov Chains for Exploring Posterior Distributions.” Annals of Statistics, 22: 1701–1728. 19 WHO (1981). Arsenic. Geneva: World Health Organization. Environmental Health Criteria 18. 3
Acknowledgments This research was supported by the American Chemistry Council’s (ACC) Long-Range Research Initiative under an agreement between the ACC and the Ohio State University Research Foundation. The agreement was a result of a submission to the EPA’s FY2003 STAR Grant program, in response to an RFA titled, “Environmental Statistics Research: Novel Analyses of Human Exposure Related Data,” which was jointly funded by the EPA’s National Center for Environmental Research (NCER) and the ACC. The authors would like to thank Wayne Hood, the Supervisory Hydrologist in Data Management and Analysis of Water Quality Division of the Arizona Department of Environmental Quality, for providing the public-water-system datasets. We thank the Editor-in-Chief, Associate Editor and two reviewers for constructive criticism and suggestions to improve this presentation.
Appendix: The independent normal model with possible censoring and missingness (INCM) Let N(µ, σ 2 ) denote a normal distribution with mean µ and variance σ 2 , and CN(µ, σ 2 ; c) denote a left-censored normal distribution with mean µ and variance σ 2 > 0 that is censored at level c. For each observation Yi from the data {Y1 , . . . , Yn }, we let the observation-status variable Zi be 0 if the observed value is below the MDL value of Mi , or 1 if the value is equal to or above the MDL, or 2 if the observation is missing. Now let Y = (Y1 , . . . , Yn )0 , Z = (Z1 , . . . , Zn )0 , and M = (M1 , . . . , Mn )0 . Then the random vector Y has an independent normal distribution with possible censoring and
Craigmile, Calder, Li, Paul, and Cressie
35
missingness (INCM distribution), or Y ∼ IN CM (µ, σ 2 ; Z; M ), if Y £ ¤ £ ¤ Y |X, σ 2 , Z, M = Yi |µi , σ 2 {i : Zi =0 or 1} Y Y ¡ ¢ ¡ ¢ = CN µi , σ 2 ; Mi N µi , σ 2 , {i : Zi =0}
{i : Zi =1}
where E(Y ) = (µ1 , . . . , µn )0 = µ is the mean vector and var(Yi ) = σ 2 > 0 (i = 1, . . . , n) is the variance.
36
Hierarchical Model Building, Fitting, and Checking