Nizar Ben Achhab et. al. / International Journal of Engineering and Technology Vol.2 (5), 2010, 359-364
High performance computing software package for multitemporal Remote-Sensing computations Nizar Ben Achhab 1*, Naoufal Raissouni 2*, Abdelilah Azyat 1*, Asaad Chahboun 1*, Mohammed Lahraoua 1* 1
Faculty of Sciences, Abdelmalek Essaadi University. Mhannech II, B.P 2121 Tetuan, Morocco
[email protected]
2
National Engineering School for Applied Sciences of Tetuan, Abdelmalek Essaadi University. * Remote Sensing & Mobile GIS Unit, Innovation & Telecoms Engineering Research Group. Mhannech II, B.P 2121 Tetuan, Morocco
[email protected]
Abstract— With the huge satellite data actually stored, remote sensing multitemporal study is nowadays one of the most challenging fields of computer science. The multicore hardware support and Multithreading can play an important role in speeding up algorithm computations. In the present paper, a software package (called Multitemporal Software Package for Satellite Remote sensing data (MSPSRS)) has been developed for the multitemporal treatment of satellite remote sensing images in a standard format. Due to portability intend, the interface was developed using the QT application framework and the core was developed integrating C++ classes. MSP.SRS can run under different operating systems (i.e., Linux, Mac OS X, Windows, Embedded Linux, Windows CE, etc.). Final benchmark results, using multiple remote sensing biophysical indices, show a gain up to 6X on a quad core i7 personal computer. Keywords— Huge remote sensing computations, QT, multicore, multitemporal, Speedup.
I. INTRODUCTION Environmental evolution, global change, geology, biophysics, hydrology, vegetation monitoring, agriculture and others similar earth science fields are actually based on satellite imagery and more than 40 biophysical indices (i.e., Land Surface Temperature (LST) [1-4], Thermal Inertia (TI) [5-7], emissivity () [8], Normalized Difference Vegetation Index (NDVI) [9], Leaf Area Index (LAI) [10-15], atmospheric Water vapor (W) [16-19], Global Environmental Monitoring Index (GEMI) [20-22], Weighted Difference Vegetation Index [23-25], Soil Adjusted Vegetation Index (SAVI) [26-28], etc.). Conversely, the huge accumulated quantity of satellite remotely sensed data represents a real challenge for both software and hardware capability treatments [29;30]. The computer hardware industry has provided more computational power with computer systems containing multiple core processors. These last, connected to a single Central Processing Unit (CPU) are called MultiCores (MC). The software developers have reduced the computation time adopting the parallel programming philosophy. Thus, using numerous emergent techniques (i.e., multiprocessing,
ISSN : 0975-4024
MultiTHreading (MTH) [31], OpenMP library [32], MPI library [33], etc.) In this paper, a software package based on a self developed framework has been built. The software package is called Multitemporal Software Package for Satellite Remote sensing data (MSPSRS) and the framework is called Multitemporal Multithreading on Multicore Computations Framework (3MCF). This last, computes Remote Sensing (RS) algorithms using the Simultaneous MultiThreading (SMT) technique. MSPSRS computes automatically whole RS databases in order to: i) avoid the memory overflow, ii) accelerate the execution with full and/or partial parallelization, iii) maximize the speedup, and iv) exploit the full hardware power. The MSPSRS has been developed integrating most commune remote sensing algorithms [34]. The interface has been developed using QT C++ class library offering the possibility to compute automatically statistical parameters (with graph option) with storage capability in selected folders. The output can be a series of representative biophysical index images and/or statistical graphs. In our case, we have used: the Advanced Very High Resolution Radiometer (AVHRR) Global PAL data (20.6 Mb: 5004 columns x 2168 rows) to compute ten of the most commune biophysical indices. II. THE MULTITEMPORAL SOFTWARE PACKAGE FOR SATELLITE REMOTE SENSING DATA (MSPSRS) The present paragraph aims to explain the structure of the multithreaded algorithms and the core framework architecture, which are used in the MSPSRS. The multithreading technique is used to accelerate the algorithm computation time, whereas the interface format is used to facilitate the user interaction independently of the operating system and the hardware used. A. The MSPSRS layered Architecture MSPSRS consists on a modular or packaged application structure. Each module corresponds to a satellite with its possible and different sensors. In this paper, we have used the
359
Nizar Ben Achhab et. al. / International Journal of Engineering and Technology Vol.2 (5), 2010, 359-364 AVHRR module with the Global PAL data to test the operability and performance of the proposed structure. Each package follows the architecture presented in Fig. 1.
Due to portability intend, thread scheduling is given in part to the operating system with a high priority require.
Fig. 2. Core framework architecture diagram.
Fig. 1 Software architecture diagram.
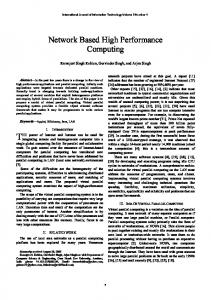
The user interface accomplishes the user preferences and commands based on QT, 3MCF and some C++ classes. In order to be multiplatform, the interface is entirely written in XML language. Due to the C++ and QT [35] combination, the software package can run under different operating systems using different hardware architectures. In our case, we have mainly used: i) the 2D canvas to provide very fast or large scenes visualizations, ii) OpenGL library for building hardware-accelerated graphics and high performance visualization applications, iii) The ECMA standard scripting engine has been fully-integrated, iv) The Driver Layer provides support for ODBC, MySQL, PSQL, SQLite, ibase, Oracle, Sybase, DB2, v) The core provides the inter-object communications mechanism (i.e., File IO, Multi-threading and concurrency, event and object handling, Plugins, settings management, Signals and Slots). Based on a multithreading paradigm, the Graphical User Interface (GUI) monitors all executed jobs and schedules the temporal executions. B. The core Framework: 3MCF Designed for multithreaded implementation, the core framework is basically composed of C++ classes structured following the multiple layers architecture shown in Fig. 2.
ISSN : 0975-4024
The configuration layer permits an automatic computation of RS images. It is also responsible for the accomplishment of user preferences (i.e., maximum number of threads to execute over a CPU, thread priorities, the algorithm to be executed, RS database to compute, memory reservation depending on the number of images to be integrated in the corresponding RS algorithm). In this processing case, the threads are executed on the real time priority basis (e.g., highest possible priority). The core implementation and management layer is in charge of all computations executed over this framework. Default, preferences load RS images from the sensor-images database using the multitemporal raster data layer, and store the computed images (using MTH computation layer) in the biophysical-indices database using multitemporal raster output layer. The structure of sensor-images and biophysical-indices databases has been designed based on separating and storing the data within folders classed by years and months. This data, can be stored under different formats (i.e., Raster, Hierarchical Data Format, GeoTIFF, Erdas Imagine, Oracle Spatial GeoRaster, etc.) using RS image drivers layer. This last, is based on some developed file drivers and the Geospatial Data Abstraction Library (GDAL) [36]. RS algorithm layer regroups the most used algorithms subdivided in two categories: i) 1D algorithm section computes the biophysical indices requiring pixel by pixel computation (i.e., NDVI, GEMI, SAVI, etc.), and ii) 2D algorithm section computes the biophysical indices requiring multiple pixels by multiple pixel computation (i.e, W, LST, etc.). The framework computational approach is built up from a divide-and-conquer approach, by dividing the remote sensing image into regions and the algorithm application into multiples simultaneous threads. Instead of cropping the image into sub images with corresponding reserved memory, the segmentation layer has been structured on the basis of executing multiple threads on
360
Nizar Ben Achhab et. al. / International Journal of Engineering and Technology Vol.2 (5), 2010, 359-364 the original image itself which is already reserved in memory. This is defining high bandwidth parallelism and giving some high level degree of flexibility to RS algorithms needing neighboring pixel information. The segmentation layer has been developed taking in consideration the above mentioned concept with the following procedures. 1) 1D algorithm: symbolizing the principal algorithm format, it is constructed with simple mathematical operations between satellite bands or images. For th=1 to n Begin Sp = (th-1) * [(r*c)/n]; Ep = th * [(r*c)/n]; For k = Sp to Ep Begin Calculate the biophysical index End End with th the number of the executed threads, Sp and Ep are the start and end thread computing positions, n the total number of threads to be executed, r and c are respectively the total number of rows and columns of the image and k represents the physical memory address of the pixel to be used (in the RS algorithm) to compute a biophysical index.
value of n, n(max)=16 corresponding to the double of the number of physical CPU used simultaneously (in our case the quad core Intel i7 with eight logical cores) with the aim of getting at least two periodical cycles. III. PERFORMANCE ANALYSIS To evaluate the performance of the 3MCF remote sensing software a SMT Remote Sensing Benchmarks (SMTRSB) has been developed. The SMTRSB is based on a process of running different RS based tests including RS algorithms and images. In this paper, a total number of 38400 tests of microbenchmarks (e.g., 20 years x 12 months x 16 thread tests x 10 algorithms) have been considered. For accuracy commitment, the execution time counting in SMTRSB has been set on milliseconds and microseconds based on two time referential counters. The different picked time positions are indicated in Fig. 3. tS is indicating the start pick time directly after memory reservation, tE the end pick time directly after file result saving, tSC the start computation pick time indicating the start of running multithreaded RS algorithm and tEC the end pick time computation just after ending of all the algorithms’ parts computation and before file result saving.
2) 2D algorithm: The 2D algorithm segmentation is treated case by case with each own segmentation process. In this paper, we have used LST algorithm that involves W algorithm. This last is a 2D algorithm which segmentation procedure can be given by the following algorithm: For th=1 to n Begin Sp = (th-1)*[(r*c)/n]; Ep = th*[(r*c)/n]; For k = Sp to Ep Begin I=k-i if ( I ≤ r*d ) or ( I ≥ r*(c-d) ) Inexistent value for the biophysical index Else if ( I mod r ≤ d) or ( I mod r ≥ r-d ) Inexistent value for the biophysical index else Calculate the biophysical index End if End End where d the maximum length of neighboring pixel needed in the algorithm and i the physical memory address of the first pixel in the image. The number of SMT, which is equal to n; can be defined by the user, by benchmark test, or by defect to the number of cores. In this paper, n has been set equal to n=(2,3,4,5,6,7,8,9,10,11,12,13,14,15,16) with the maximum
ISSN : 0975-4024
Fig. 3. 3MCF execution diagram and SMTRSB picked time positions. tS, pick time for start image computation, tSC, pick time for start core computation, tEC, pick time for end core computation, tE, pick time for end image computation
A. Benchmarking Algorithms In order to quantify the real time consumed for RS images computation, we have used the 10 commune remote sensing algorithms (see Table I). Subsequently, we have proceeded by
361
Nizar Ben Achhab et. al. / International Journal of Engineering and Technology Vol.2 (5), 2010, 359-364 picking recognized points (i.e., tS, tE, tSC and tEC) into the computation process (see Fig. 3.).
algorithm [37], and are the effective emissivity and difference emissivity respectively [8].
TABLE I Remote sensing Algorithms
IV. PERFORMANCE RESULTS The execution time tC (in seconds, s) for the multithreaded algorithm can be derived from the tSC and tEC pick times (see Fig. 3) using the following equation:
Algorithm
Cp
DVI = NIR - R
1
2
2
1
1.5
0.5
2
1
2
8
2
Emi= = 4 5 2 i = vi Pv + si (1-Pv) + Ci
1D
Clevers 1986
1D
Pinty & Verstraete 1992
(i = 4 or 5)
1D
Qi et al. 1994
1D
Rao and Chen 1999
1D
Raissouni and Sobrino 2000
1D
Raissouni and Sobrino 2000
t(i)C = tEC(i) – tSC(i)
(1)
The average computation time have been carried out by averaging the 240 tC(i) values corresponding to 12 months of 20 years for the remote sensing biophysical index. tC =
∑240 i 1
240
(2)
The results have been reported in Fig. 4 and have shown, that the number of cores in a multi-core chip has no effect when programming serial, on the other hand it is the most important criteria when programming parallel.
( NDVI NDVI min ) 2 ( NDVI max NDVI min ) 2
DEMI = =
4 5
i = vi Pv + si (1-Pv) + Ci (i = 4 or 5) Pv
Rouse et al. 1974
Albedo = NIR + R
Pv
1D
1 0.5
2
1D
0.125
0.25
2
2
Author Pearson and Miller 1972
( NDVI NDVI min ) 2 ( NDVI max NDVI min ) 2
W=0.26-14.253 cosθ lnR54- 11.649 (cosθ lnR54)2 2D R54 = Error!
Raissouni and Sobrino 2000
Fig. 4. MSPSRS and standard programming computation time LST = T4 + (1.4 + 0.32 (T4-T5)) (T4-T5) + 0.83 + (57-5W) (1-) - (161-30W)
2D
Sobrino and Raissouni 2000
where Cp is the algorithm complexity, si and vi are, respectively, the emissivities of bare soil and vegetation for AVHRR Channel i (i = 4 or 5), Pv is the proportion of vegetation, and Ci is a term that depends on the surface characteristics, R and NIR are images representing respectively the red and near infrared satellite channels, W is the total amount of the atmospheric water vapor using SWCVR
ISSN : 0975-4024
The SMPSRS software package chooses automatically the number of SMT to be used for the computation (SMT equals to the number of logical processing cores). The standard programming is an optimized C++ program not including parallelism techniques. With the aim of quantifying the gain in time comparing the serialized and parallelized programs; we have used the ratio of execution times called SpeedUp. It is given by the following equation: tC(1) SpeedUp(n)= t C(n)
(3)
362
Nizar Ben Achhab et. al. / International Journal of Engineering and Technology Vol.2 (5), 2010, 359-364 where n is the number of SMT, tC(1) is the iterative algorithm time or the running time corresponding to a unique thread and tC(n) is the time corresponding to the running time of a number of n simultaneous threads. In order to quantify the potential of the developed 3MCF framework and MSPSRS, a SpeedUp(n) with (n=1 to n=16) corresponding to a total number of 38400 tests of microbenchmarks (applying the algorithms detailed in Table I) has been carried out. The SpeedUp has been obtained by averaging the 240 SpeedUp values corresponding to 12 months of 20 years. The SpeedUp results in function of the number of SMT (from 1 to 16) computed for the PAL data and ten biophysical indices (in Table I) have been reported on Fig.5.
Analyzing the results shown in Fig. 5, we have verified that the best speedup can be rapidly achieved with a number of SMT equivalents to the number of logical cores. For this reason, we have considered this last as the automatic preconfiguration criteria. V. CONCLUSION The potential of the developed Multitemporal Software Package for Satellite Remote Sensing data (MSPSRS) integrating the self developed Multitemporal Multithreading on Multicore Computations Framework (3MCF) applied to Remote Sensing (RS) algorithms computations has been shown (in our case NDVI, RVI, DVI, Albedo, MSAVI, GEMI, , , W, and LST algorithms). The Multithreading on a multicore approach has potentially increases the multitemporal performance computing of the huge quantity of satellite remotely sensed data (in our case PAL data, with about 4 Terabyte). The 3MCF was applied for a total number of 38400 benchmarks. Final results show a gain of 6X for the quad core intel i7 architecture. ACKNOWLEDGMENT This work was supported in part by the Morocco Ministry for Higher Education, Management Training and Scientific Research under CSPT Grants for “Integration and application of GIS and GPS on mobile systems” and “Ad-hoc wireless sensor networks for remote sensing algorithm validation” projects. The authors would also like to thank the Open Source communities maintaining the GDAL library and the NASA’s Goddard Space Flight Center for providing satellite data. Many thanks for anonymous referees. REFERENCES
Fig. 5. MSPSRS achieved speedup
ISSN : 0975-4024
[1] M. K. Raynolds, J. C. Comiso, D. A. Walker, and D. Verbyla, "Relationship between satellite-derived land surface temperatures, arctic vegetation types, and NDVI," Remote Sensing of Environment, vol. 112, no. 4, pp. 1884-1894, Apr.2008. [2] W. Wang, S. Liang, and T. Meyers, "Validating MODIS land surface temperature products using long-term night time ground measurements," Remote Sensing of Environment, vol. 112, no. 3, pp. 623-635, Mar.2008. [3] Z. Wan, "New refinements and validation of the MODIS Land-Surface Temperature/Emissivity products," Remote Sensing of Environment, vol. 112, no. 1, pp. 59-74, Jan.2008. [4] H. Xiao and Q. Weng, "The impact of land use and land cover changes on land surface temperature in a karst area of China," Journal of Environmental Management, vol. 85, no. 1, pp. 245-257, Oct.2007. [5] J. A. Sobrino, M. H. El Kharraz, J. Cuenca, and N. Raissouni, "Thermal inertia mapping from NOAA-AVHRR data," Advances in Space Research, vol. 22, no. 5, pp. 655-667, Oct.1998. [6] W. W. Verstraeten, F. Veroustraete, C. J. van der Sande, I. Grootaers, and J. Feyen, "Soil moisture retrieval using thermal inertia, determined with visible and thermal spaceborne data, validated for European forests," Remote Sensing of Environment, vol. 101, no. 3, pp. 299-314, Apr.2006. [7] A. B. Kahle, J. P. Schieldge, and R. E. Alley, "Sensitivity of thermal inertia calculations to variations in environmental factors," Remote Sensing of Environment, vol. 16, no. 3, pp. 211-232, Dec.1984.
363
Nizar Ben Achhab et. al. / International Journal of Engineering and Technology Vol.2 (5), 2010, 359-364 [8] J. A. Sobrino, N. Raissouni, and Z. L. Li, "A comparative study of land surface emissivity retrieval from NOAA data," Remote Sensing of Environment, vol. 75, no. 2, pp. 256-266, Feb.2001. [9] J. W. Rouse, R. H. Haas, J. A. Schell, and D. W. Deering, "Monitoring vegetation systems in the Great Plains with ERTS," NASA. Goddard Space Flight Center 3d ERTS-1 Symp., vol. 1, pp. 309-317, Jan.1974. [10] T. D. Setiyono, A. Weiss, J. E. Specht, K. G. Cassman, and A. Dobermann, "Leaf area index simulation in soybean grown under nearoptimal conditions," Field Crops Research, vol. 108, no. 1, pp. 82-92, July2008. [11] S. Garrigues, N. V. Shabanov, K. Swanson, J. T. Morisette, F. Baret, and R. B. Myneni, "Intercomparison and sensitivity analysis of Leaf Area Index retrievals from LAI-2000, AccuPAR, and digital hemispherical photography over croplands," Agricultural and Forest Meteorology, vol. 148, no. 8-9, pp. 1193-1209, July2008. [12] C. Wu, Z. Niu, Q. Tang, and W. Huang, "Estimating chlorophyll content from hyperspectral vegetation indices: Modeling and validation," Agricultural and Forest Meteorology, vol. 148, no. 8-9, pp. 1230-1241, July2008. [13] L. M. Gonzales, J. W. Williams, and J. O. Kaplan, "Variations in leaf area index in northern and eastern North America over the past 21,000 years: a data-model comparison," Quaternary Science Reviews, vol. 27, no. 13-14, pp. 1453-1466, July2008. [14] Y. Yi, D. Yang, J. Huang, and D. Chen, "Evaluation of MODIS surface reflectance products for wheat leaf area index (LAI) retrieval," ISPRS Journal of Photogrammetry and Remote Sensing, vol. 63, no. 6, pp. 661-667, Nov.2008. [15] M. C. Gonzblez-Sanpedro, T. Le Toan, J. Moreno, L. Kergoat, and E. Rubio, "Seasonal variations of leaf area index of agricultural fields retrieved from Landsat data," Remote Sensing of Environment, vol. 112, no. 3, pp. 810-824, Mar.2008. [16] N. Raissouni and J. A. Sobrino, "Application of the SWCVR algorithm to Asia PAL data for the retrieval of the atmospheric water vapor," in Information and Communication Technologies International Symposium's 05 Sofitel Hotel, Marina Smir Tetuan, Morocco: 2005, pp. 498-503. [17] P. Ineichen, "Conversion function between the Linke turbidity and the atmospheric water vapor and aerosol content," Solar Energy, vol. 82, no. 11, pp. 1095-1097, Nov.2008. [18] L. Chen, Y. Gao, L. Yang, Q. Liu, X. Gu, and G. Tian, "MODISderived daily PAR simulation from cloud-free images and its validation," Solar Energy, vol. 82, no. 6, pp. 528-534, June2008. [19] A. Scrivani and U. Bardi, "A study of the use of solar concentrating plants for the atmospheric water vapour extraction from ambient air in the Middle East and Northern Africa region," Desalination, vol. 220, no. 1-3, pp. 592-599, Mar.2008. [20] E. Chuvieco, P. Englefield, A. P. Trishchenko, and Y. Luo, "Generation of long time series of burn area maps of the boreal forest from NOAA-AVHRR composite data," Remote Sensing of Environment, vol. 112, no. 5, pp. 2381-2396, May2008. [21] F. Gemmell and A. J. McDonald, "View Zenith Angle Effects on the Forest Information Content of Three Spectral Indices," Remote Sensing of Environment, vol. 72, no. 2, pp. 139-158, May2000. [22] D. Lo Seen, E. Mougin, S. Rambal, A. Gaston, and P. Hiernaux, "A regional Sahelian grassland model to be coupled with multispectral satellite data. II: Toward the control of its simulations by remotely sensed indices," Remote Sensing of Environment, vol. 52, no. 3, pp. 194-206, June1995. [23] D. Casanova, G. F. Epema, and J. Goudriaan, "Monitoring rice reflectance at field level for estimating biomass and LAI," Field Crops Research, vol. 55, no. 1-2, pp. 83-92, Jan.1998. [24] J. G. P. W. Clevers, "Application of a weighted infrared-red vegetation index for estimating leaf Area Index by Correcting for Soil Moisture," Remote Sensing of Environment, vol. 29, no. 1, pp. 25-37, July1989. [25] J. G. P. W. Clevers, "Application of the WDVI in estimating LAI at the generative stage of barley," ISPRS Journal of Photogrammetry and Remote Sensing, vol. 46, no. 1, pp. 37-47, Feb.1991. [26] J. C. Epiphanio and A. R. Huete, "Dependence of NDVI and SAVI on sun/sensor geometry and its effect on fAPAR relationships in Alfalfa," Remote Sensing of Environment, vol. 51, no. 3, pp. 351-360, Mar.1995. [27] A. R. Huete, G. Hua, J. Qi, A. Chehbouni, and W. J. D. van Leeuwen, "Normalization of multidirectional red and NIR reflectances with the
ISSN : 0975-4024
[28] [29]
[30]
[31]
[32] [33] [34]
[35] [36] [37]
SAVI," Remote Sensing of Environment, vol. 41, no. 2-3, pp. 143-154, 1992. A. R. Huete, "A soil-adjusted vegetation index (SAVI)," Remote Sensing of Environment, vol. 25, no. 3, pp. 295-309, Aug.1988. J. Shalf, L. Oliker, M. Lijewski, S. Kamil, J. Carter, and A. Canning, "Performance Characteristics of Potential Petascale Scientific Applications," in Petascale computing algorithms and applications. d. a. Bader, Ed. Taylor & Francis, 2008, pp. 1-28. U. Rajasekar and Q. Weng, "Urban heat island monitoring and analysis using a non-parametric model: A case study of Indianapolis," ISPRS Journal of Photogrammetry and Remote Sensing, vol. 64, pp. 86-96, 2009. R. H. Carver and K. C. Tai, Modern multithreading implementing, testing, and debugging multithreaded Java and C++/Pthreads/Win32 programs. Hoboken, NJ: Wiley, 2006. The OpenMP API specification for parallel programming 2010 [Online]. Available: http://www.openmp.org W. Gropp, E. Lusk, and A. Skjellum, Using MPI: Portable Parallel Programming with the Message-Passing Interface 1994. N. Ben Achhab, N. Raissouni, J. A. Sobrino, A. Azyat, M. Lahraoua, a. Chahboun, and M. Atitar, "Automatic temporal analysis software package for satellite remote sensing ATA-SRS," in Second Recent Advances in Quantitative Remote Sensing 2006, pp. 210-215. QT Framework 2010 [Online]. Available: http://qt.nokia.com/ Geospatial Data Abstraction Library 13-6-2010 [Online]. Available: http://www.gdal.org/ J. A. Sobrino, N. Raissouni, J. Simarro, F. Nerry, and P. François, "Atmospheric water vapor content over land surfaces derived from the AVHRR Data. Application to the Iberian Peninsula," Transactions on Geoscience and Remote Sensing, no. 37, pp. 1425-1434, May1999.
364