did not correspond to a scotoma on conven- tional perimetry underwent high spatial resolu- tion perimetry. Contour plots of the luminance sensitivity were ...
452
British Journal of Ophthalmology 1997;81:452–459
High spatial resolution automated perimetry in glaucoma Mark C Westcott, Andrew I McNaught, David P Crabb, Frederick W Fitzke, Roger A Hitchings
Department of Visual Science, Institute of Ophthalmology, London M C Westcott D P Crabb F W Fitzke Glaucoma Unit, Moorfields Eye Hospital, City Road, London A I McNaught R A Hitchings Correspondence to: F W Fitzke, Department of Visual Science, Institute of Ophthalmology, 11–43 Bath Street, London EC1V 9EL. Accepted for publication 12 February 1997
Abstract Background—Automated perimetry is of fundamental importance in assessing visual function in glaucoma. A technique was evaluated to perform high spatial resolution automated perimetry to allow a more detailed assessment of the luminance sensitivity in selected regions of the visual field than is possible with conventional perimetry. Method—High spatial resolution perimetry was performed using a Humphrey automated perimeter by measuring luminance sensitivity across a 9 by 9 degree custom grid of 100 test locations with a separation between adjacent locations of 1 degree. Quantitative analysis of the raw and Gaussian filtered thresholds was performed to assess the repeatability of the technique in normals, glaucoma suspects, and glaucoma patients. Results—The testing protocol was well tolerated by all subjects. High spatial resolution perimetry in glaucomatous eyes demonstrated fine luminance sensitivity loss not suspected with conventional perimetry. High spatial resolution perimetry also demonstrated reproducible areas of sensitivity loss in some glaucomatous eyes in areas of the visual field which appear normal with conventional programmes. The repeatability of the technique correlated with mean threshold sensitivity and was substantially improved to clinically acceptable levels by Gaussian filtering the thresholds. Conclusion—This technique of high spatial resolution perimetry allows the practical assessment of selected regions of the visual field at higher resolution than conventional perimetry, and may be clinically useful in glaucoma. (Br J Ophthalmol 1997;81:452–459)
Conventional automated perimetry threshold examinations have a relatively low spatial resolution with 6 degrees separating adjacent test locations in the Humphrey 24-2 or 30-2 programs. Perimetry performed at higher resolution may obtain a more detailed picture of the luminance sensitivity in selected areas of the visual field which may be of particular interest to the clinician. We have performed automated threshold perimetry at higher spatial resolution in selected areas of the visual field by using test locations separated by a 1
degree field. This has allowed us to investigate scotomas in much finer detail than is possible with conventional perimetry. Previous investigators have performed perimetry at higher spatial resolution than conventional perimetry, and have identified subtle scotomas beyond the resolution of conventional perimetry.1 2 High spatial resolution perimetry has also been shown to identify scotomas that correspond to retinal nerve fibre layer defects in glaucoma suspects who have normal conventional perimetry.3 4 This suggests that high spatial resolution perimetry may have a number of distinct clinical advantages over conventional perimetry in the detection of the earliest glaucomatous field defects. However, previous techniques of high spatial resolution perimetry have been arduous for patients and have been limited by long testing times.1 3 Another recognised problem of high spatial resolution perimetry has been a high intratest variability, with a corresponding poor repeatability of the threshold measurements.1 We have developed a technique to perform high spatial resolution perimetry using a Humphrey perimeter to generate a fine matrix map (FMM) of a specified region of the visual field within an acceptable test time. This technique of fine matrix mapping has been applied to the study of a number of diseases.5–8 The aim of this study was to investigate the use of fine matrix mapping in glaucoma. We then investigated the use of image processing techniques to improve the repeatability of the high spatial resolution luminance measurements, as these techniques have already been shown to substantially improve the repeatability of conventional perimetry, with no additional cost in test time.8 9 Patients and methods SUBJECTS
The study was approved by the Moorfields Hospital ethics committee. We prospectively recruited patients with an established diagnosis of primary open angle glaucoma, Glaucoma suspects, and suitably age matched normal controls. All subjects were phakic and had uncorrected visual acuity of >6/9 in at least one eye. All glaucoma patients had documented intraocular pressure >21 mm Hg on at least one occasion before treatment, and evidence of asymmetrical glaucomatous field loss relative to the horizontal meridian on the most recent Humphrey 24-2 or 30-2 field. Glaucoma suspects had documented intraocular pressure >21 mm Hg on at least one occasion, and a
453
High spatial resolution automated perimetry in glaucoma
normal visual field. A field was defined as normal if there were no clusters of significantly depressed locations in either hemifield on the pattern deviation plot of the 24-2 or 30-2 programs of the Humphrey field analyser. According to previously established criteria,10 a cluster was defined as being significantly depressed if it contained a minimum of three adjacent depressed test locations on the pattern standard deviation plot, with at least one location having a probability of abnormality of p < 0.01 and two locations of p < 0.05, excluding the peripheral ring of the HFA 30-2. Suitably age matched controls were recruited if they had no significant ocular history, had a normal ocular examination with an IOP less than 21 mm Hg and had normal Humphrey HFA 24-2 fields, according to the above criteria.
EXAMINATION PROTOCOLS
High spatial resolution perimetry of the blind spot We investigated the resolution of our technique by obtaining FMMs of the blind spot of a normal control. Luminance contour plots were superposed to the corresponding fundal landmarks, imaged with a confocal laser scanning ophthalmoscope (CLSO), using argon 488 nm light (Zeiss instruments). High spatial resolution perimetry in patients with retinal nerve fibre layer defects Two glaucoma patients with clinical evidence of focal retinal nerve fibre layer defects which did not correspond to a scotoma on conventional perimetry underwent high spatial resolution perimetry. Contour plots of the luminance sensitivity were superposed to CLSO images of the retinal nerve fibre layer defects.
TECHNIQUE OF FINE MATRIX MAPPING
To perform fine matrix mapping perimetry the coordinates of four interlaced 5 × 5 grids of 25 locations (with a separation between adjacent points of 2 degrees) are entered in the ‘custom grid’ feature of a Humphrey automated perimeter. Each grid is oVset relative to the other grids by 1 degree—in the x, y, or x and y axes. The patient undergoes examination using each of the four grids sequentially, using a target size III on a standard Humphrey bowl illumination of 31.5 apostilbs. Accuracy of fixation is monitored in the same way as conventional perimetry. The data are converted into IBM format files which are merged using custom software to produce a single matrix with a separation between test locations of 1 degree. This FMM of 100 locations subtends a visual angle of 9 degrees by 9 degrees, approximately the area occupied by four locations in the 30-2 program. The numerical matrix is then used to generate a surface or contour plot showing the size and location of luminance sensitivity gradients across the grid. In addition to analysis of the raw data, the FMM thresholds underwent spatial processing using a 3 by 3 Gaussian (normal) filter. This technique has been used to filter conventional Humphrey 30-2 field data and FMMs, and has been described in detail previously.8 9
Clinical evaluation of high spatial resolution perimetry Further evaluation of high spatial resolution perimetry was performed in glaucomatous eyes, glaucoma suspect eyes, and normal controls. Each glaucoma patient underwent Humphrey field examination using the 30-2 program. One eye only was chosen for examination. If both eyes satisfied the above inclusion requirements, the eye showing the greatest contrast in defect depth/sizes across the horizontal midline was chosen. The two sites of fine matrix mapping were chosen as mirror image pairs across the horizontal meridian, and were performed at two eccentricities: the supero and inferotemporal site (Fig 3A), or the superior paracentral (Fig 5A) and inferior paracentral sites. Each subject underwent examination first at one site with each of the four constituent 25 location grids performed successively with a short, standardised rest between each. The patient was then tested at the mirror image retinal location using the same protocol of four successive grids of 25 locations. The patient was then allowed a rest of at least 2 hours and then the whole protocol was repeated at the original retinal locations to assess intertest fluctuation and reproducibility. The time required for each constituent grid varied
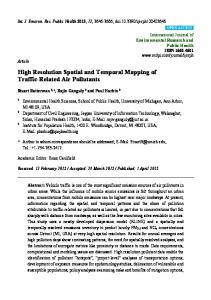
Figure 1 Contour plots of luminance sensitivity obtained from fine matrix maps (FMMs) performed over a blind spot of a normal control, superposed with a fundal scanning laser ophthalmoscope image (inverted) of the subject. Contour lines represent isoluminant points, in 1 dB increments. Note steep sensitivity gradients at the edge of the blind spot as well as more subtle linear defects corresponding in location and extent to the major retinal vascular trunks exiting the optic disc.
454
Westcott, McNaught, Crabb, Fitzke, Hitchings
between each patient depending on the number of questions asked, related to defect size and depth. Excluding the brief rest between grids, the test time required on the Humphrey field analyser to obtain a FMM in the glaucoma patients was clinically acceptable and ranged from 8 to 26 minutes, with a mean of 20 minutes. Glaucoma suspects were tested according to the same protocol using the mirror image pair of FMMs in the supero and inferotemporal site. In the absence of conventional field abnormalities, we chose this site as it has been reported to be one of the locations of early visual field defects in glaucoma suspects. We investigated the repeatability of the FMMs in age matched normal controls, using the same test sites, except that the testing was confined to either the superior or the inferior location of the mirror image pair. Three dimensional surface plots of the FMMs for matched locations in the visual field were compared between groups. Quantitative analysis of the raw and Gaussian filtered
thresholds was performed, and the repeatability of the FMMs was assessed using the technique described by Bland and Altman (see below). STATISTICAL ANALYSIS
The repeatability of the FMMs was investigated using the technique described by Bland and Altman.11 This technique has been applied to investigate the repeatability of a number of measurements of ocular components,12 13 and has also been used to assess the repeatability of visual field measurements.9 14 To assess the repeatability of the first and second FMMs, the numeric diVerence between the first and second threshold sensitivities is calculated for each test location and plotted versus the mean of the sensitivities for that location. This graphical plot illustrates the spread and distribution of the pointwise diVerences. The repeatability of the FMMs is defined as the SD of the pointwise diVerences between the first and second FMM.
Figure 2 (A) Humphrey 24-2 grey scale and STATPAC 2 total deviation plot from glaucoma suspect right eye. Box indicates the site of two adjacent fine matrix maps (FMMs), which reveal an obvious superior arcuate extending from the blind spot, not shown by the Humphrey 24-2. Contour plots (B) have been superposed with a fundal scanning laser ophthalmoscope image (inverted) obtained from the patient. The sensitivity loss corresponds closely with the extent of a retinal nerve fibre layer defect.
455
High spatial resolution automated perimetry in glaucoma
Figure 3 (A) Humphrey 30-2 of glaucomatous eye. Boxes indicate superior and inferior sites of fine matrix map (FMM). (B and D) show pointwise diVerence versus mean plots for first and second FMM in the superior location, for raw (B) and Gaussian filtered (D) thresholds. (C and E) show corresponding plots for raw (C) and filtered (E) thresholds of the FMMs in the inferior location. Broken lines indicate pointwise limits of agreement, represented as 2 SD, between the first and second FMMs.
Results HIGH SPATIAL RESOLUTION PERIMETRY OF THE BLIND SPOT
Figure 1 shows the results of performing high spatial resolution perimetry around the blind spot of a normal subject. A contour map of the luminance sensitivity profile has been superposed to a fundal CFLO image (using argon 488 nm light, Zeiss instruments), obtained from the same eye. Accurate superposition was achieved by aligning anatomical landmarks such as the centre of the disc and fovea with the corresponding perimetric landmarks such as centre of the blind spot and fixation, which are plotted by the Humphrey field analyser. The resulting aligned contour map reveals well defined steep luminance sensitivity gradients at the edge of the blind spot as well as more subtle linear relative defects corresponding in location and extent to the major retinal vascular trunks exiting the optic disc. The diameters of the retinal arterioles at the disc margin are approximately 100 µm,
while those of the retinal veins are about 130 µm15; 100 µm corresponds to a visual angle of approximately 0.3 degrees. This degree of resolution compares well with other reported techniques of high spatial resolution perimetry, which have also identified angioscotoma associated with the major retinal vascular trunks.16 HIGH SPATIAL RESOLUTION PERIMETRY IN PATIENTS WITH RETINAL NERVE FIBRE LAYER DEFECTS
Figure 2 illustrates the results of high spatial resolution perimetry performed in a glaucoma patient in an area of the visual field corresponding to a clinically visible focal retinal nerve fibre layer defect. A three dimensional surface plot of the luminance sensitivity (Fig 2A) reveals an obvious scotoma which is not apparent on the conventional Humphrey 24-2. The scotoma extends into the nasal field, in a region where the threshold sensitivities of the corresponding Humphrey 24-2 test locations
456
Westcott, McNaught, Crabb, Fitzke, Hitchings
SD of sensitivity difference (first second FMM) (dB)
10
A
Glaucoma OHT Controls
8 6 4 2 0
0
10
5
10
15
20
25
30
35
5
10
15
20
25
30
35
B
8 6 4 2 0
0
Average sensitivity of first and second FMM (dB)
Figure 4 Summary plots of SD of pointwise diVerences of first and second fine matrix map (FMM) versus mean sensitivity of first and second FMM, using raw thresholds (A) and Gaussian filtered thresholds (B). The eVect of filtering has been to reduce the magnitude of the SD by a factor of approximately 2, representing an twofold improvement in repeatability. Lines indicates the least squares linear fit of the data, excluding 1 outlier.
are within the 95% population limits, according to STATPAC 2. The aligned contour map shows contour lines (Fig 2B) indicating a region of steep luminance sensitivity loss which corresponds closely with the extent of the retinal nerve fibre layer defect imaged using the scanning laser ophthalmoscope. CLINICAL EVALUATION OF HIGH SPATIAL RESOLUTION PERIMETRY
We tested six eyes of six glaucoma patients (four eyes in mirror image supero and inferotemporal sites, two eyes in mirror image supero and inferoparacentral sites), four eyes of four glaucoma suspects (three eyes in mirror image supero and inferotemporal sites, one eye in inferotemporal only), and six eyes of six normal subjects (four eyes in superotemporal site, one eye in inferotemporal site, one eye in inferoparacentral site). The mean ages by group were 64 (SD 4) years for the glaucoma patients, 58 (7) years for the glaucoma suspects, and 65 (6) years for the controls. These diVerences were not statistically significantly diVerent. Bland–Altman plots of the pointwise diVerences versus the pointwise means between the baseline and the repeat FMM were plotted for each subject at each location tested. The mean of the pointwise diVerences and the SD of the pointwise diVerences were calculated to provide summary statistics of repeatability for each individual. The mean of the pointwise diVerences reflects any systematic diVerence (bias) between the baseline and the subsequent FMM as might be expected if there was a considerable fatigue eVect or learning eVect. The
repeatability of the first and second FMM is defined as the SD of the pointwise diVerences with lower values indicating better repeatability. The mean plus or minus 2 SD indicates the limits of agreement between the first and the second FMM. Figures 3B–E are examples of the Bland– Altman plots of the first and second FMMs performed for one glaucoma patient in two mirror image locations (Fig 3A) of the field. The superotemporal FMM overlaps an area of depressed threshold sensitivity on the Humphrey 30-2, while the inferotemporal FMM overlaps an area of normal Humphrey 30-2 threshold sensitivity. The repeatability between the first and second FMMs is poorest, as indicated by the higher pointwise SD, in the location of depressed threshold sensitivity (Fig 3B) compared with the location of normal threshold sensitivity (Fig 3C). The eVect of Gaussian filtering of the FMMs has been to substantially reduce the SDs (Fig 3D, E) representing an improved repeatability by a factor of 2 between the baseline and the second FMMs. The mean pointwise diVerence remains the same for the raw and Gaussian filtered data, and is close to zero in all the plots. Figure 4A shows the repeatability of the first and second FMMs for all the subjects: the SD of the pointwise diVerences has been plotted against the mean threshold sensitivity of the first and second FMMs for each subject. The SD values are highest for the glaucoma patients, indicating poorer repeatability, compared with the controls. The one outlier was a glaucoma patient who had FMMs performed in a region of absolute sensitivity loss on the Humphrey 30-2. In this patient only one test location had a measurable sensitivity, the remaining test locations had no measurable sensitivity in either baseline or the repeat FMM, with a consequent zero pointwise diVerence between the majority of points. Figure 4A illustrates the negative correlation between the SD and the mean grid sensitivity which was highly significant (p = 0.0001, R2 = 0.91); thus, the repeatability was poorest in the FMMs with greater degrees of luminance sensitivity loss. Figure 4B shows a similar correlation between the pointwise SD and the mean threshold sensitivity for the Gaussian filtered thresholds. Note that the values of the SD have been reduced by a factor of approximately 2. Designated limits of pointwise agreement between the first and the second FMMs can be defined as the mean plus or minus 2 SD, according to Bland and Altman.11 The limits of agreement for all the Gaussian filtered FMM pairs are below 5 dB; thus, for each FMM pair, the diVerence between the first and second (repeat) sensitivity thresholds will be less than 5 dB at 95 out of 100 test locations, which we believe is clinically acceptable. Calculated values for the means of the pointwise diVerences between the first and second FMMs, representing any overall bias between the first and the second grids were smallest for controls (mean −0.09 dB, range −0.58 dB to 0.50 dB). The means of the pointwise
High spatial resolution automated perimetry in glaucoma
457
diVerences for the glaucoma patients were higher (mean 0.37 dB, range −6.70 dB to 3.00 dB), although they still remained small; 11 of 12 repeated FMMs had a mean diVerence of less than 4 dB. In addition, there was no systematic departure from zero in any of the groups, indicating that there is no significant bias between the first and second FMMs which we might have expected if there was a significant learning or fatigue eVect. FMMs obtained from high spatial resolution perimetry in glaucoma patients at sites already known to be abnormal from the 30-2 examination revealed a complex profile of sensitivity loss which was not revealed by the low spatial resolution of the conventional Humphrey 30-2 or 24-2 programs. Figures 5A and B show Humphrey 30-2 grey scale and STATPAC 2 total deviation plots from a glaucoma patient who underwent high spatial resolution perimetry at the site indicated. Figures 5C and D show three dimensional surface plots of the first FMM (Fig 5C) and the second (Fig 5D) FMMs which have undergone filtering. Both surface plots show the complex profile of the scotoma, which reveals a steep sensitivity gradient from severely depressed to normal sensitivity. Much of the detail is reproducible. In two glaucomatous eyes of two patients fine matrix mapping in an area of normal sensitivity on the Humphrey 30-2 revealed an obvious reproducible defect that was not apparent with conventional perimetry. One example is shown by Figures 6A–E. High spatial resolution perimetry identified a localised reproducible scotoma, represented as an elevated area on the first FMM (Fig 6C) and second FMM (Fig 6D). The FMMs were performed in an area of field overlapped by four Humphrey 24-2 test locations which have normal threshold sensitivity (Fig 6A, B). Figure 6E shows a surface plot of a FMM from a normal control for comparison, which shows a uniform luminance profile.
Figure 5 (A, B) show Humphrey 30-2 grey scale and STATPAC 2 total deviation plot from glaucomatous eye, with site of fine matrix map (FMM) indicated by box. (C, D) show three dimensional plots of Gaussian filtered luminance sensitivity thresholds of first and second FMMs. Note reproducible luminance profiles which reveal a steep sensitivity gradient from severely depressed sensitivity, represented as elevated area, to normal sensitivity.
Discussion A number of investigators have used high spatial resolution perimetry to detect scotomas beyond the resolution of conventional perimetry.1 2 Airaksinen et al have used high spatial resolution perimetry to identify scotomas corresponding to retinal nerve fibre layer defects in glaucoma suspects who have normal conventional perimetry.3 In addition, high spatial resolution perimetry has also been shown to be clinically useful in defining residual small central isles of field in advanced glaucoma, which may be too small for conventional perimetry to map.17 18 However, a major disadvantage of some of these studies is that they have been arduous for patients and have required an extremely long test time. We have performed high resolution perimetry in a group of normal, glaucoma, and glaucoma suspect eyes using the technique of fine matrix mapping, performed on a Humphrey automated perimeter. We have identified glaucomatous luminance loss which was not revealed by the lower spatial resolution of the conventional Humphrey 30-2 or 24-2 programs. The testing
458
Westcott, McNaught, Crabb, Fitzke, Hitchings
Figure 6 (A, B) Humphrey 30-2 grey scale and STATPAC2 total deviation plot from glaucomatous eye. Box indicates site of FMM which overlaps four Humphrey 30–2 test locations with normal threshold sensitivity. (C, D) show three dimensional plots of Gaussian filtered luminance sensitivity thresholds of first and second FMMs. Elevated areas indicate repeatable luminance defects, not seen in the FMM of an equivalent area of field from age matched normal controls (E).
protocol was well tolerated and all subjects performed the test within a test time of 30 minutes, which we believe is clinically acceptable. Previous investigations of high spatial resolution perimetry have demonstrated that one of the earliest perimetric disturbances in glaucoma is an elevated intratest variability, in some regions, even though the mean threshold sensitivity at the location may still remain
normal.1 19 A number of studies have shown that the intertest variability of conventional threshold perimetry is higher in glaucoma patients than in normals.20–23 In addition, the degree of intertest variability has been found to correlate with the degree of sensitivity loss.22 Our results confirm that a similar correlation exists between intertest variability and sensitivity loss in high spatial resolution perimetry, as has been suggested by other workers.1 To date, the high intertest variability, and consequently low repeatability, in areas of glaucomatous sensitivity loss has been a significant limitation to the usefulness of high spatial resolution perimetry. Attempts to improve the precision of the threshold measurements by repeating the measurements is unlikely to be practical in high spatial resolution perimetry because of the already lengthy test times. We have investigated an alternative method to improve the repeatability using image processing techniques,8 which have already been shown to improve the repeatability of conventional automated perimetry.9 We have been able to obtain a marked improvement (by a factor of 2) in the repeatability of the technique, by applying a Gaussian filter to the high spatial resolution perimetry threshold data. This improvement in repeatability has been achieved at no extra cost in test time. We have obtained good reproducibility of the luminance profiles using this technique, and this has allowed us to obtain finer details of sensitivity loss which were not apparent on the lower spatial resolution of conventional perimetry. We believe that high spatial resolution perimetry fine matrix mapping may be a useful clinical tool, and may have a diagnostic role in the more detailed evaluation of equivocal areas of visual field of glaucoma patients and suspects. Previous studies have suggested that the test point density of conventional perimetry is not a limiting factor for the identification of the earliest glaucomatous field change. However, these studies used conversion criteria based on the development of field defects measured at conventional resolution.19 It remains to be determined whether the detection of conversion is
High spatial resolution automated perimetry in glaucoma
improved by the use of high spatial resolution perimetry. In addition, high spatial resolution perimetry may have a role in identifying early progression of glaucomatous visual field defects. There is evidence to suggest that the progression of glaucomatous defects, as detected using conventional perimetry, is slow.24 25 Using conventional perimetric programs with a spacing of 6 degrees between adjacent test points, progression of the advancing edge of a scotoma which is increasing in size must exceed 6 degrees of visual angle before a change is registered at a repeat examination. Perimetry performed using test locations separated by 1 degree oVers the theoretical possibility that we may be able to identify advancement at the edge of a scotoma at an earlier stage than is possible with conventional perimetry. In summary, we have described a technique for performing high spatial resolution perimetry which is clinically practical and can be performed on an unmodified Humphrey automated perimeter. We have identified glaucomatous luminance loss which was not revealed by the lower spatial resolution of the conventional Humphrey 30-2 or 24-2 programs, and have obtained a substantial improvement in the repeatability of the technique by using image processing techniques. This work was supported by grants from the Friends of Moorfields, the Medical Research Council, the International Glaucoma Association, and the Royal National Institute for the Blind. 1 Sturmer J. What do glaucomatous visual fields really look like in fine-grid computerized profile perimetry? Dev Ophthalmol 1985;12:1–47. 2 Weber J, Dobek K. What is the most suitable grid for computer perimetry in glaucoma patients? Ophthalmologica 1986;192:88–96. 3 Airaksinen PJ, Heijl A. Visual field and retinal nerve fibre layer in early glaucoma after optic disc haemorrhage. Acta Ophthalmol (Copenh) 1983;61:186–94. 4 Tuulonen A, Lehtola J, Airaksinen PJ. Nerve fiber layer defects with normal visual fields. Do normal optic disc and normal visual field indicate absence of glaucomatous abnormality? Ophthalmology 1993;100:587–97. 5 Chen JC, Fitzke FW, Bird AC. Long-term eVect of acetazolamide in a patient with retinitis pigmentosa. Invest Ophthalmol Vis Sci 1990;31:1914–8.
459
6 Chen JC, Fitzke FW, PauleikhoV D, Bird AC. Functional loss in age-related Bruch’s membrane change with choroidal perfusion defect. Invest Ophthalmol Vis Sci 1992;33: 334–40. 7 Chuang EL, Sharp DM, Fitzke FW, Kemp CM, Holden AL, Bird AC. Retinal dysfunction in central serous retinopathy. Eye 1987;1 (Pt 1):120–5. 8 Fitzke FW, Kemp CM. Probing visual function with psychophysics and photochemistry. Eye 1989;3 (Pt 1): 84–9. 9 Fitzke FW, Crabb DP, McNaught AI, Edgar DF, Hitchings RA. Image processing of computerised visual field data. Br J Ophthalmol 1995;79:207–12. 10 Plitz JR, Drance SM, Douglas GR, Milkelbergh FS. The relationship of peripheral vasospasm, diVuse and localized visual field defects, and intraocular pressure in glaucomatous eyes. In: Mills R, Heijl A, eds. Perimetry update. Amsterdam/New York: Kugler, 1990/1991:465–72. 11 Bland JM, Altman DG. Statistical methods for assessing agreement between two methods of clinical measurement. Lancet 1986;1:307–10. 12 Zadnik K, Mutti DO, Adams AJ. The repeatability of measurement of the ocular components. Invest Ophthalmol Vis Sci 1992;33:2325–33. 13 Rudnicka AR, Steele CF, Crabb DP, Edgar DF. Repeatability, reproducibility and intersession variability of the Allergan Humphrey ultrasonic biometer. Acta Ophthalmol Copenh 1992;70:327–34. 14 Flanagan JG, Wild JM, Trope GE. The visual field indices in primary open-angle glaucoma. Invest Ophthalmol Vis Sci 1993;34:2266–74. 15 Wessing A, Von Noorden GK. Fluorescein angiography of the retina. St Louis: CV Mosby, 1969. 16 Safran AB, Halfon A, Safran E, Mermoud C. Angioscotomata and morphological features of related vessels in automated perimetry. Br J Ophthalmol 1995;79:118–24. 17 McNaught AI, Westcott MC, Viswanathan AC, Fitzke FW, Hitchings RA. Fine matrix mapping of foveal sensitivity loss in glaucoma. Invest Ophthalmol Vis Sci 1995; 36(suppl)(1579). 18 Weber J, Schultze T, Ulrich H. The visual field in advanced glaucoma. Int Ophthalmol 1989;13:47–50. 19 Heijl A. Perimetric point density and detection of glaucomatous visual field loss. Acta Ophthalmol Copenh 1993;71:445–50. 20 Holmin C, Krakau CE. Variability of glaucomatous visual field defects in computerized perimetry. Graefes Arch Klin Exp Ophthalmol 1979;210:235–50. 21 Werner EB, Saheb N, Thomas D. Variability of static visual threshold responses in patients with elevated IOPs. Arch Ophthalmol 1982;100:1627–31. 22 Flammer J, Drance SM, Fankhauser F, Augustiny L. DiVerential light threshold in automated static perimetry. Factors influencing short-term fluctuation. Arch Ophthalmol 1984; 102:876–9. 23 Flammer J, Drance SM, Zulauf M. DiVerential light threshold. Short- and long-term fluctuation in patients with glaucoma, normal controls, and patients with suspected glaucoma. Arch Ophthalmol 1984;102:704–6. 24 Smith SD, Katz J, Quigley HA. Analysis of progressive change in automated visual fields in glaucoma. Invest Ophthalmol Vis Sci 1996;37:1419–28. 25 Migdal C, Gregory W, Hitchings R. Long-term functional outcome after early surgery compared with laser and medicine in open-angle glaucoma. Ophthalmology 1994;101: 1651–6.