Aug 25, 2011 - [52] Nazikian R, Kramer G J and Valeo E 2001 Phys. Plasmas 8 1840. [53] LeBlanc B P, Bell R E, Johnson D W, Hoffman D E, Long D C and ...
IOP PUBLISHING
PLASMA PHYSICS AND CONTROLLED FUSION
Plasma Phys. Control. Fusion 53 (2011) 105001 (18pp)
doi:10.1088/0741-3335/53/10/105001
High spatial sampling global mode structure measurements via multichannel reflectometry in NSTX N A Crocker1 , W A Peebles1 , S Kubota1 , J Zhang1 , R E Bell2 , E D Fredrickson2 , N N Gorelenkov2 , B P LeBlanc2 , J E Menard2 , M Podest`a2 , S A Sabbagh3 , K Tritz4 and H Yuh5 1 Department of Physics and Astronomy, University of California–Los Angeles, Los Angeles, CA 90095-7099, USA 2 Princeton Plasma Physics Laboratory, PO Box 451, Princeton, NJ 08543-0451, USA 3 Department of Applied Physics and Applied Mathematics, Columbia University, New York, NY 10027, USA 4 The Johns Hopkins University, Baltimore, MD 21218, USA 5 Nova Photonics, Princeton, NJ 08540, USA
Received 12 March 2011, in final form 24 June 2011 Published 25 August 2011 Online at stacks.iop.org/PPCF/53/105001 Abstract Global modes—including kinks and tearing modes (f ∼ 400 kHz)—play critical roles in many aspects of plasma performance. Their investigation on NSTX is aided by an array of fixed-frequency quadrature reflectometers used to determine their radial density perturbation structure. The array has been recently upgraded to 16 channels spanning 30–75 GHz (ncutoff = (1.1–6.9) × 1019 m−3 in O-mode), improving spatial sampling and access to the core of H-mode plasmas. The upgrade has yielded significant new results that advance the understanding of global modes in NSTX. The GAE and CAE structures have been measured for the first time in the core of an NSTX high-power (6 MW) beam-heated H-mode plasma. The CAE structure is strongly corelocalized, which has important implications for electron thermal transport. The TAE structure has been measured with greatly improved spatial sampling, and measurements of the TAE phase, the first in NSTX, show strong radial variation near the midplane, indicating radial propagation caused by non-ideal MHD effects. Finally, the tearing mode structure measurements provide unambiguous evidence of coupling to an external kink. (Some figures in this article are in colour only in the electronic version)
0741-3335/11/105001+18$33.00
© 2011 IOP Publishing Ltd
Printed in the UK & the USA
1
Plasma Phys. Control. Fusion 53 (2011) 105001
N A Crocker et al
1. Introduction Toroidal fusion research plasmas exhibit a variety of global coherent perturbations that play critical roles in many aspects of plasma performance. For instance, kinks and tearing modes modify profiles and can cause transport (see [1] and references therein). Plasmas with energetic-ion populations created by neutral beam or radio frequency heating also commonly feature various fast-ion driven modes, including Alfv´en eigenmodes and energetic particle modes (EPMs). Fast-ion modes cause redistribution or loss of the energetic ions, thereby changing the plasma energy and momentum sources, as well as potentially damaging plasmafacing components (see [2, 3], and references therein). High frequency Alfv´en eigenmodes also potentially play a role in electron thermal transport [4]. The National Spherical Torus Experiment (NSTX) [5] features a rich spectrum of global modes. It exhibits tearing modes and kinks at f ∼4 × 10¹⁹ m−3 commonly develop quickly as the plasma enters H-mode, increasing even further to ∼5 × 10¹⁹ m−3 as the density profile evolves from hollow to centrally peaked. Figure 4 shows a typical example (shot 141398). Time histories of key plasma parameters for this example are shown in figure 4(a). The plasma enters H-mode in the early period of 6 MW beam injection. Figure 4(b) shows the evolution of the density profile as measured by MPTS. The increased number of reflectometer channels significantly improves spatial sampling and the resolution of mode structure measurements. Figure 5(a) shows an example of the radial coverage and spatial sampling attainable in high-power beam-heated H-mode plasmas (shot 141398 at t = 582 ms). Notably, twelve of the reflectometers have frequencies in the range 30–62.5 GHz, providing access to plasmas with densities in the range ncutoff = (1.1–4.8) × 1019 m−3 . This represents a significant increase in spatial sampling even within the range of densities accessible prior to the upgrade. Figure 5(b) shows an example of the coverage and spatial sampling attainable in an L-mode plasma (shot 141707 at t = 448 ms) of the type typically created for the study of TAEs in NSTX [37–39]. (Note that the density profiles shown in figure 5 are smoothed, which has a small effect on the determination of the cutoff radii. Also the profiles in figures 5(a) and (b) are scaled by factors of 1.085 and 1.08, respectively, to ensure consistency between the MPTS and reflectometer measurements. The evolution of the peak density measured by MPTS can be used to accurately predict the periods during which the microwaves of each channel reflect from the plasma when scaled by the indicated factors. 6
Plasma Phys. Control. Fusion 53 (2011) 105001
10
1.0
IP 4 Te0 2
100
200
300 400 time (ms)
PNB
500
0.5
141398 565 ms 498 ms
6
432 ms
ne (1019 m-3 )
neL
6
IP (MA), Te0 (keV), PNB (MW/10)
1.5
0
(b)
141398
8
0
8
2.0 (a)
neL (1019 m-2 )
N A Crocker et al
365 ms
4
2
0 0.2
0.0 600
298 ms
0.4
0.6
0.8 1.0 R (m)
1.2
1.4 1.6
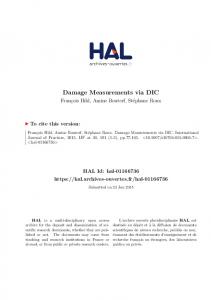
Figure 4. (a) Time history of plasma current (IP ), neutral beam power (PNB ), and central electron temperature (Te0 ) and line average density (neL ) from MPTS; (b) electron density profiles from MPTS for the times indicated by solid circles ( ) in figure 4(a). Crosses indicate measurements with error bars. Lines show smoothed profiles.
•
ne (1019 m-3 )
75 GHz
6 141398 582 ms
4 2 0
1
1.2
72.5 GHz (a) 70 GHz 67.5 GHz 62.5 GHz 60 GHz 57.5 GHz 55 GHz 50 GHz 47.5 GHz 45 GHz 37.5 GHz 42.5 GHz 35 GHz 32.5 GHz 30 GHz
R (m)
1.4
1.6
ne (1019 m-3 )
5 60 GHz (b) 57.5 GHz 55 GHz 50 GHz 47.5 GHz 141707 45 GHz 42.5 GHz 448 ms
4 3 2
37.5 GHz 35 GHz 32.5 GHz 30 GHz
1 0
1
1.2
R (m)
1.4
1.6
Figure 5. NSTX density profiles from (smoothed) MPTS for (a) high-power (4 MW) beam-heated H-mode plasma and (b) high density L-mode plasma. O-mode cutoff locations indicated for frequencies of the upgraded reflectometer array.
When peak plasma density exceeds the critical value for a channel, reflection from the plasma starts and the level of reflected power detected increases sharply and substantially (>∼10 dB in ∼ 500 kHz have strongly core-localized structures like those of the f = 633, 648 and 726 kHz modes in figure 6(d), which are the strongest of the group. In contrast, modes with frequencies f (n/R)2 . In addition to the toroidal mode number, the spectrum of CAEs can be characterized by 9
Plasma Phys. Control. Fusion 53 (2011) 105001
N A Crocker et al
generalized poloidal and radial mode numbers, M and S. CAEs have frequencies given by fCAE ≈ (VA /2π)[n2 /R 2 + δ 2 ]1/2 + (n/R)fROT , where VA , fROT and R are evaluated where the mode is localized, at the maximum of (ω/VA )2 − (n/R)2 , and δ 2 depends on the poloidal and radial structure of the modes. For a given n, the value of δ 2 is determined by M and S. Lower values of M and S correspond, in general, to mode structures with larger poloidal and radial scales. For high values of M and S, it is illustrative to think of δ 2 as δ 2 ≈ kθ2 + kr2 = M 2 /r 2 + S 2 /L2r , where r is the minor radius of mode localization and Lr is the radial scale of the potential well. The expected frequencies for GAEs and CAEs are both sensitive to toroidal rotation and the Alfv´en frequency, but in different ways. In addition, GAEs are sensitive to the plasma safety factor, q, at the magnetic axis. CHERS measurements indicate that the toroidal rotation frequency at the magnetic axis is fROT0 ≈ 23 kHz (in the beam injection direction) from t = 400 ms to t = 550 ms, trending downward afterwards to fROT0 ≈ 15 kHz at t = 700 ms. Equilibrium reconstruction with the LRDFIT code [7, 56, 57]—constrained by edge magnetic measurements and MSE field pitch measurements—is used to determine the safety factor, q. The safety factor at the magnetic axis, which is determined within ±∼0.1, trends downward from q0 ≈ 1.7 at t = 400 ms to q0 ≈ 1.1 at t = 700 ms. Taking into account the ion species, the electron density from MPTS and the magnetic field on axis from LRDFIT, fA0 trends downward from fA0 ≈ 110 kHz at t = 400 ms to fA0 ≈ 82 kHz at t = 700 ms. (Note that the assumption that mass density is given by mD ne0 affects the determination of fA0 . It gives the correct value if significant impurities have the same charge-to-mass ratio as deuterium, which is likely to be the case since the most significant impurity is carbon.) At the time of the mode structure measurements, q0 ≈ 1.3, fROT0 ≈ 22 kHz and fA0 ≈ 89 kHz. Comparison with expectations for GAE and CAE frequencies shows that the f = 633, 648 and 726 kHz modes are CAEs, while the f = 401 kHz mode is a GAE. The large toroidal mode number, n = −8, and low frequency of the f = 401 kHz mode are sufficient to identify it as a GAE. Taking into account the Doppler shift, a CAE with a toroidal mode number of n = −8 would be expected to have a frequency f > 600 kHz. However, the higher frequencies of the f = 633, 648 and 726 kHz modes, and their lower mode numbers, n = −4, −3 and −3, are not consistent with expectations for GAEs in light of the strong downward trend in q0 . In order to fit the dispersion relation for GAEs as well as possible at t = 580 ms, these modes need relatively large poloidal mode numbers of m ≈ 5, 7 and 8, respectively. (This would give mode frequencies of ∼601, 667 and 734 kHz, respectively.) Consequently, the contribution of m/q0 to each of their frequencies would make its evolution very sensitive to the trend in q0 , causing it to evolve inconsistently with observation. The observed frequencies of the f = 633 and 648 kHz modes (figure 6(a)), while evolving slightly differently over time, trend downward from f ≈ 700 kHz to f ≈ 620 kHz between t ≈ 400 ms and t ≈ 700 ms. In contrast, the frequencies of (m, n) = (5, −4) and (7, −3) GAEs would evolve distinctly differently. Initially, they would both decrease by �f >∼ 50 kHz between t = 400 ms and t ∼ 570 ms. Afterward, however, they would both increase until t = 700 ms, by �f >∼ 40 kHz. Similarly, the observed frequency of the f = 726 kHz mode trends downward from f ≈ 740 kHz to f ≈ 700 kHz between t ≈ 530 ms and t ≈ 680 ms. In contrast, the frequency of an (m, n) = (8, −3) GAE would be expected to increase by �f ∼ 50 kHz between t ≈ 530 ms and t ≈ 680 ms. The expectation for increasing frequencies is mostly due to the strong upward trend in m/q0 resulting from the large expected poloidal mode numbers, m, and the strong downward trend in q0 . The decreasing Doppler shift also contributes. The downward trend in fA0 works against these factors, but is not strong enough to overcome them. While not consistent with the expectation for GAEs, the frequency trends of the f = 633, 648 and 726 kHz modes are consistent with the expectation for CAEs, assuming values of δ 10
Plasma Phys. Control. Fusion 53 (2011) 105001
N A Crocker et al
ranging from ∼1/(0.16 m) to ∼1/(0.13 m) that decrease slightly (∼5% of the ∼8 cm width of the flat region in figure 8(c), which is not insignificant. These results indicate that fixed-boundary calculations, which force the edge displacement to be zero, are insufficient for understanding the evolution of coupled kink-tearing modes. 4. Summary In summary, NSTX possesses a broad spectrum of global coherent modes that impact on plasma performance in a variety of ways. The investigation of these modes, including Alfv´en eigenmodes, kink and tearing modes, is routinely facilitated in NSTX by an array of fixedfrequency quadrature reflectometers. The array has recently been significantly upgraded to 16 channels. The upgraded array consists of two eight-channel systems with frequencies— generated with the aid of NTLs—in the ranges 30–50 GHz and 55–75 GHz. This represents a significant improvement in the spatial sampling and achievable resolution of spatial structure measurements, while also allowing access to higher density, higher performance plasmas. The upgrade extends the accessible equilibrium density range to ncutoff = (1.1–6.9) × 1019 m−3 . This affords access to the core of high-power (6 MW) beam-heated H-mode plasmas, where the typical pedestal (i.e. edge) density is ∼5 × 10¹⁹ m−3 . The extended capabilities of the array have been exploited to reveal new physics related to several types of global modes. Structure measurements of CAEs and GAEs have been obtained for the first time in the core of an NSTX high-power beam-heated H-mode plasma. Previously reported correlation of GAEs activity with enhanced electron thermal transport in the core of such plasmas has motivated an investigation of the role of GAEs in the transport. The CAE structures reported here are very strongly core-localized, contrary to expectations, suggesting they may also be a candidate for explaining the enhanced transport for reasons similar to those hypothesized for GAEs. This work motivates theoretical analysis of the CAE to understand their potential contribution to core transport. TAE structure measurements have been obtained with significantly improved spatial sampling. Measurements of TAE phase, the first such in NSTX, show strong radial variation indicating inward propagation caused by non-ideal MHD effects. Tearing mode structure measurements show unambiguous evidence of coupling to an external kink. This highlights the importance of edge structure and boundary conditions in the future investigation of coupled-kink tearing modes, a topic of active investigation in NSTX 16
Plasma Phys. Control. Fusion 53 (2011) 105001
N A Crocker et al
and other tokamaks. All these structure measurements represent significant advances in the investigation and understanding of global modes in NSTX and motivate future experiments and theoretical analysis. Acknowledgment This work was supported by US DOE Grant Nos DE-FG02-99ER54527 and DE-AC02-09CH11466. References [1] [2] [3] [4] [5] [6] [7] [8] [9]
[10] [11] [12] [13] [14] [15] [16] [17] [18] [19] [20] [21] [22] [23] [24] [25] [26] [27] [28] [29] [30] [31] [32] [33] [34] [35] [36] [37] [38]
Hender T C et al 2007 Nucl. Fusion 47 S128 Fasoli A et al 2007 Nucl. Fusion 47 S264 Heidbrink W W 2008 Phys. Plasmas 15 055501 Stutman D, Delgado-Aparicio L, Gorelenkov N, Finkenthal M, Fredrickson E, Kaye S, Mazzucato E and Tritz K 2009 Phys. Rev. Lett. 102 115002 Ono M et al 2000 Nucl. Fusion 40 557 Menard J E et al 2005 Nucl. Fusion 45 539 Menard J E et al 2006 Phys. Rev. Lett. 97 095002 Gerhardt S P et al 2009 Nucl. Fusion 49 032003 Breslau J, Chance M S, Chen J, Fu G, Gerhardt S, Gorelenkov N, Jardin S C and Manickam J 2011 Proc. 23rd IAEA Fusion Energy Conf. (Daejon, Republic Of Korea, 11–16 October 2010) THS/P2-03 http://www-pub. iaea.org/mtcd/meetings/PDFplus/2010/cn180/cn180 papers/ths p2-03.pdf Gerhardt S P et al 2011 Nucl. Fusion 51 033004 Fredrickson E D, Gorelenkov N, Cheng C Z, Bell R, Darrow D, Johnson D, Kaye S, LeBlanc B and Menard J 2001 Phys. Rev. Lett. 87 145001 Gorelenkov N N, Fredrickson E, Belova E, Cheng C Z, Gates D, Kaye S and White R 2003 Nucl. Fusion 43 228 Fredrickson E D, Chen L and White R 2003 Nucl. Fusion 43 1258 Fredrickson E D et al 2006 Phys. Plasmas 13 056109 Fredrickson E D et al 2007 Phys. Plasmas 14 102510 Gorelenkov N N, Berk H L, Fredrickson E, Sharapov S E and JET EFDA Contributors 2007 Phys. Lett. A 370 70 Gorelenkov N N et al 2009 Phys. Plasmas 16 056107 Eremin D Yu and K¨onies A 2010 Phys. Plasmas 17 012108 McGuire K M et al 1983 Phys. Rev. Lett. 50 891 White R B, Goldston R J, McGuire K, Allen Boozer H, Monticello D A and Park W 1983 Phys. Fluids 26 2958 Chen L, White R B and Rosenbluth M N 1984 Phys. Rev. Lett. 52 1122 Berk H L, Borba D N, Breizman B N, Pinches S D and Sharapov S E 2001 Phys. Rev. Lett. 87 185002 Breizman B N, Berk H L, Pekker M S, Pinches S D and Sharapov S E 2003 Phys. Plasmas 10 3649 Cheng C Z and Chance M S 1986 Phys. Fluids 29 3695 Wong K L et al 1991 Phys. Rev. Lett. 66 1874 Heidbrink W W, Strait E J, Doyle E, Sager G and Snider R T 1991 Nucl. Fusion 31 1635 Appert K, Gruber R, Troyon F and Vaclavik J 1982 Plasma. Phys. 24 1147 Weller A, Spong D A, Jaenicke R, Lazaros A, Penningsfeld F P and Sattler S 1994 Phys. Rev. Lett. 72 1220 Mahajan S M and Ross D W 1983 Phys. Fluids 26 2561 Coppi B, Cowley S, Kulsrud R, Detragiache P and Pegoraro F 1986 Phys. Fluids 29 4060 Gorelenkov N N and Cheng C Z 1995 Nucl. Fusion 35 1743 McClements K G, Gryaznevich M P, Sharapov S E, Akers R J, Appel L C, Counsell G F, Roach C M and Majeski R 1999 Plasma Phys. Control. Fusion 41 661 Bell R E and Feder R 2010 Rev. Sci. Instrum. 81 10D724 Fredrickson E D, Gorelenkov N N, Bell R E, Menard J E, Roquemore A L, Kubota S, Crocker N A and Peebles W 2006 Nucl. Fusion 46 S926 Gorelenkov N N, Fredrickson E D, Heidbrink W W, Crocker N A, Kubota S and Peebles W A 2006 Nucl. Fusion 46 S933 Crocker N A et al 2008 Phys. Plasmas 15 102502 Podest`a M et al 2009 Phys. Plasmas 16 056104 Fredrickson E D et al 2009 Phys. Plasmas 16 122505 17
Plasma Phys. Control. Fusion 53 (2011) 105001
N A Crocker et al
[39] Podest`a M, Bell R E, Fredrickson E D, Gorelenkov N N, LeBlanc B P, Heidbrink W W, Crocker N A, Kubota S and Yuh H 2010 Phys. Plasmas 17 122501 [40] Fredrickson E D et al 2011 Proc. 23rd IAEA Fusion Energy Conf. (Daejon, Republic of Korea„ 11–16 October 2010) EXW/P7-06 http://www-pub.iaea.org/MTCD/Meetings/PDFplus/2010/cn180/cn180 papers/exw P7-06.pdf [41] Peebles W A, Rhodes T L, Hillesheim J C, Zeng L and Wannberg C 2010 Rev. Sci. Instrum. 81 10D902 [42] Kolesnichenko Y I, Yakovenko Y V and Lutsenko V V 2010 Phys. Rev. Lett. 104 075001 [43] Gorelenkov N N, Stutman D, Tritz K, Boozer A, Delgado-Aparicio L, Fredrickson E, Kaye S and White R 2010 Nucl. Fusion 50 084012 [44] Tritz K Bull. Am. Phys. Soc. 55 BAPS.2010.DPP.PI2.2 http://Meetings.aps.org/link/BAPS.2010.DPP.PI2.2 Tritz K et al 2011 Phys. Plasmas in preparation [45] Classen I G J et al 2010 Rev. Sci. Instrum. 81 10D929 [46] Greenfield C M 2011 Proc. 23rd IAEA Fusion Energy Conf. (Daejon, Republic Of Korea, 11–16 October 2010 OV/1-4 http://www-pub.iaea.org/MTCD/Meetings/PDFplus/2010/cn180/cn180 papers/ov 1-4.pdf [47] Tobias B J, Classen I G J, Domier C W, Heidbrink W W, Luhmann N C Jr, Nazikian R, Park H K, Spong D A and Van Zeeland M A 2011 Phys. Rev. Lett. 106 075003 [48] Gude A, G¨unter S, Sesnic S and the ASDEX Upgrade Team 1999 Nucl. Fusion 39 127 [49] Fredrickson E D 2002 Phys. Plasmas 9 548 [50] Nave M F F, Lazzaro E, Coelho R, Belo P, Borba D, Buttery R J, Nowak S, Serra F and EFDA-JET Contributors 2003 Nucl. Fusion 43 179 [51] Brennan D J, Turnbull A D, Chu M S, LaHaye R J, Lao L L, Osborne T H and Galkin S A 2007 Phys. Plasmas 14 056108 [52] Nazikian R, Kramer G J and Valeo E 2001 Phys. Plasmas 8 1840 [53] LeBlanc B P, Bell R E, Johnson D W, Hoffman D E, Long D C and Palladino R W 2003 Rev. Sci. Instrum. 74 1659 [54] Levinton F M and Yuh H 2008 Rev. Sci. Instrum. 79 10F522 [55] Lee K C, Domier C W, Johnson M, Luhmann N C and Park H 2004 Rev. Sci. Instrum. 75 3433 [56] Levinton F M et al 2007 Phys. Plasmas 14 056119 [57] http://w3.pppl.gov/∼jmenard/software/lrdfit/lrdfit-index.htm [58] Sabbagh S A et al 2001 Nucl. Fusion 41 1601 [59] Lao L L, St. John H, Stambaugh R D, Kellman A G and Pfeiffer W 1985 Nucl. Fusion 25 1611 [60] Van Zeeland M A , Austin M E, Gorelenkov N N, Heidbrink W W, Kramer G J, Makowski M A, Mckee G R, Nazikian R, Ruskov E and Turnbull A D 2007 Phys. Plasmas 14 056102 [61] Cheng C Z 1991 Phys. Fluids B 3 2463 [62] Fu G Y, Cheng C Z, Budny R, Chang Z, Darrow D S, Fredrickson E, Mazzucato E, Nazikian R, Wong K L and Zweben S 1996 Phys. Plasmas 3 4036
18