To appear in the Proceedings of the Hawai’i International Conference On System Sciences, January 5-8, 1999, IEEE Press
History-Based Tools for Navigation Alan Wexelblat MIT Media Lab, Software Agents Group 20 Ames St. Cambridge, MA 02139
[email protected] Abstract I present a research framework and some tools developed as part of an ongoing effort into defining and using interaction history as part of a user interface for social navigation, which is the process of using traces left by past users to help current users find and understand information.
1. Introduction Digital information lacks history. It lacks the texture and depth and richness that comes from being used by many hands over much time. Where the physical world is rich with cues and montages that we take advantage of constantly, our data remains sterile. When we open a word processing document or visit a web site it is as though we were the first and only people ever to handle this data. None of the work done, none of the problems solved, none of the people involved are visible. Contrast this with a borrowed book or a lived-in house: both are rich with the markers of previous use and these markers — the dog-eared pages, the padded arch of a low doorway — serve as pointers and help us make better use of the information and the space. I am investigating how interaction history can be used in digital information. The project has two components: an attempt to define the space of the field of interaction history, and a series of prototypes built under the umbrella name Footprints [26] that is oriented toward two specific navigation-related problems: getting to information — that is, the processes of exploration and wayfinding — and comprehending what has been found — that is, making sense of what you are looking at in the context of your goals and what you have seen so far. Our solution to these problems falls into the category of social navigation [2]; that is, using cues and information from others to information and potentially to more fully understand what it is that you have found. In our situation, the information from other people is presented in the form of interaction histo-
ries, a field which is defined in the next two sections of the paper. As this is an ongoing research project, we do not present any numerical or statistical conclusions. Instead, this paper shows a number of interesting examples, which I believe are indicative of the potential of this technology.
2. Interaction History Interaction history is the accumulated record of the interactions of people with objects. Interaction history encompasses three categories of representations: 1. Sequences of actions, relationships of elements on which people have acted, and the resulting structures. Sequences are time-related actions which form a purposeful variation. History modifies an object’s state, producing a visible accretion, but not just any accumulation of state modifications are interesting history, as illustrated in Figure 1 [1].
Figure 1. History versus accumulation
In the digital world, companies find themselves overwhelmed with mountains of raw data, such as web-
server click streams or customer purchase records. Most of this data is never examined. It lacks the kind of relationship structure to make useful history; at most one can find isolated statistical correlations in it. 2. Temporal collage. Multiple states, or the processes that produced them. are shown directly. We can create tools or technologies to allow users to infer the process involved in going from one state to another. This is particularly useful when the change is too fast or too slow to be perceived. Temporal collage is often useful when there is a desire to separate the “original” or created object from its current incarnation or when responsibility for sets of changes must be assigned. For example, a document produced by a writer might be shown simultaneously with several modified forms, each showing changes made by one of the editors. 3. Recurrent opposed states. History can be inferred from the contrast of the present state both with the remembered past state(s) and with the expected future state. For example, when I edit a source-code controlled file in Emacs, it displays the legend “CVS:1.6” as part of the edit mode line. This bit of history reminds me that the source file is “checked out” from the version control system, and raises the expectation that I will check it back in at some point. Interaction history affects not just the object but our perceptions of, and uses for, the object. For example, near the end of 1997 news stories began appearing indicating that certain artworks appearing prominently in public American museum collections had been plundered by the Nazis [25]. This bit of history did not change the objects themselves in any way. Instead it changed our perceptions of them. What had been done in the past changed our ideas on how to treat the objects in the present. We use interaction history information daily in the physical world. Physical objects often change in response to use: brass shows a patina where human sweat and friction have been applied, stone stair treads show curvatures worn by thousands of shoes passing over them, etc. We make use of these traces to guide our actions, to suggestion possibilities, and to perceive solutions. This is often done without conscious thought, as when we let a book fall open to a particular page because it has been opened to this page often in the past. We are trying to make interaction history as easily and naturally available in the digital world as it is in the physical world. This effort is inspired by original work done by Hill and Hollan in the early 90s [6][8].
3. Interaction History Framework The first task in this project is to characterize the problem space. This section presents a framework which can be used to talk about interaction history, and which can be used to describe the space of all possible interaction history systems. We use six major properties, to describe this area.
3.1. Property 1 — Proxemic versus Dystemic Urban planning and social anthropology use the words “proxemic” and “distemic” to describe the closeness relationship of people and spaces. The original description of proxemic space was by Edward Hall [5], who introduced the idea that there were four levels of proximity in communicative space. Hall’s levels are intimate, personal, social and public. Intimate space is where touch happens; personal space is used for conversations. Social distances are set up by groups of people and usually are less than ten feet. Public spaces go beyond this. In our project we consider proximity to be a function of the actual distance and the cognitive distance between the person and the space. A proxemic space is one which is felt by users to be transparent, in that the signs and structures can be easily understood. People feel close to, or part of, the space. Conversely, distemic spaces are opaque to users. Signals go unseen, usually because the people in the space lack the required background or knowledge to translate or comprehend what they experience. We feel “close” to our bedroom even when far away from it and experience a certain “distance” when we sleep in someone else’s guest bedroom. Interaction history systems may be more or less proxemic based on how well they relate to their users and how well they take advantage of users’ past experiences and knowledge. For example, the Emacs mode-line history noted above (CVS:1.6) would be completely distemic to anyone who did not know that cvs is a concurrent versioncontrol system which uses numerical markers to distinguish successive versions of a source file.
3.2. Property 2 — Active versus Passive Most interaction history is passive; it is recorded and made available without conscious effort, usually as a byproduct of everyday use of objects. Conversely, when we stop to think about leaving a record, we are creating an active history element. As with property 1, the active/passive distinction is concerned with the user’s mental state and her relationship to the history-rich objects. When we prop open a cookbook so that we can read the recipe while our hands are busy, we do not think of our-
selves as recording a list of our favorite recipes. But that is, passively, what we are doing. We could actively record the same information, but this takes additional thought and effort. People often take the time to record history because they feel it is important. For example, we may make many editing changes to a document (passive history) before committing a new version to a repository (active history) where it can be seen by other people. The challenge for history-rich computer systems is to find ways to allow interaction history to be passively collected so that users are not constantly thrown out of the cognitive state necessary to getting their tasks done.
3.3. Property 3 — Rate/Form of Change History moves forward, building as more interactions take place. This “accretion” process is how history builds up. However, interaction history does not only accrete, it also fades out. One of the challenges for history-rich interfaces is deciding how to deal with this accretion. Just as a complete video playback of a meeting is usually not as useful as a summary, the total accumulation of history must be summarized so that it can be observed and used quickly. A good real-world example of this are ship navigation charts which show the effects of thousands of depth readings. These are transformed into a field of numbers oriented toward both expected courses of travel by ships in the charted area and toward highlighting potential danger areas, into which a ship might stray. In the digital realm, Hill and Hollan’s “Editwear” tool used a modified scrollbar to show areas within a source file which had been more or less heavily modified. Dozens or hundreds of accesses were summarized by an unobtrusive thickening of the “thumb” component of the scrollbar. The fade function has three independent components: obscuring, losing and disconnecting. • obscuring is the process by which new history blocks the perception of old. A new coat of paint obscures the wear on the previous layer. History is often layered and while this layering gives a richness to historical objects, it also covers up things which may be valuable. • losing is the process by which interaction history is removed. Old objects may be replaced by new parts or, more seriously for organizational memory, people move on taking experience and knowledge with them. Historyrich objects may also wear out and be outright discarded. • disconnecting reflects the situation in which the interaction history is still available, but the connection between the history and its present interpretation has been lost. Engestrom et al [15] document this in Scandinavian hospital situations, in which doctors’ evaluation of patients’ conditions does not match up with the notes written in patients’ charts. The evidence (history) is still present,
but its connection to the present has been lost. Both the accretion and fade functions will vary in any history-rich interface. A key benefit of modeling interaction history explicitly in digital systems will be to help users distinguish obscuring from loss, and to help prevent disconnection.
3.4. Property 4 — Degree of Permeation Permeation is the degree to which interaction history is a part of the history-rich objects. History may be inseparable from the object, as in a flight of worn stairs, or it may be completely separate, as in the stolen art. In a historyrich interface, we must decide how closely to link the objects of interaction and the history information. Digital data will only retain that history information which we choose to keep; therefore, any record of this information must be captured and displayed by tools which we create explicitly for that purpose, or by display systems built into existing tools; for example, the mode-line modification to Emacs described above. The tools we have built to display interaction history information are described in the second half of this paper. We would like to achieve a close integration between the data and the history; however, by making history permeate digital data, we risk destroying the very thing we are trying to enhance, because digital affordances are much less related to peoples’ physical skills. In most cases, the history information must be kept peripheral, as it should be an enhancement to the user’s task environment. If interacting with the history information becomes a central focus, we have probably changed the task too much. On the other end of the spectrum, though, we cannot remove the history information too far from the user’s environment or she will not be able to take advantage of the accumulated work and expertise represented by the interaction history. Separate data risks becoming just another distraction on an already-cluttered display.
3.5. Property 5 — Personal versus Social History can be intimate to a person — what have I done? Or it can be social — what has been done here? Many tools focus on personal histories; for example, bookmarks in Web browsers that allow users to revisit sites they have noted. Group histories are more rare but, we believe, more valuable because most problem-solving tasks are collaborative in nature. One of the primary benefits of interaction history is to give newcomers the benefit of work done in the past. In fact, the slogan for our project is: “We all benefit from experience;
preferably someone else’s” The other value of social history is that it promotes organizational learning. While it is true that organizations cannot learn unless individuals within the organization learn, it is also true that if the learning is confined to individuals then it cannot benefit the group as a whole. This is not to say that personal interaction histories are insignificant. On the contrary, an ability to see and review a record of what we have personally done in the past (and perhaps why we did it) can be invaluable. Anyone who has had to go back and review or enhance his own source code after months or years of not working on it can attest to this fact!
3.6. Property 6 — Kind of Information There are an infinite variety of kinds of interaction history information that can be captured. What kinds of information are important are, to a large degree, dependent on the task that the observer is trying to accomplish. In the digital realm, most code repositories only record what can be found. If I am looking for a particular algorithm, this information is useful. However, if I am trying to decide which of several implementations of similar algorithms is better, I need very different information — for example, ratings of the code by past users. Norman [17] has promoted the importance of the study of affordances within the human-computer interaction community. Affordances are the ways in which objects present themselves to humans for use. A handle, for example, presents a very different affordance for opening a door than does a button. The kinds of affordances available with objects controls how people will use them. Interaction history in digital systems will be the result of people manipulating whatever affordances are created. Since we cannot possibly characterize all the kinds of information available, we focus on the uses to which interaction history might be put. We categorize the kind of information available loosely into what, who, why, and how. Knowing what was done can be useful if users are searching for value, particularly among clutter. The underlying assumption is that users will converge on solutions which satisfice; that is, which are good enough given the constraints of time and resources. Interaction history provides precisely the kind of rough guidelines that are valuable in satisficing. Knowing what was done can also provide reassurance. If I want to be reassured about the reasonableness of what I am doing, records showing that others have done it before can reassure me that I am not alone. This is particularly helpful for novices who lack the kind of “reasonableness” guidelines that come with practice.
Knowing what was done can also give guidance; that is, the process of directing someone in a task or journey. Written directions can be guidance, and a record of what people have done before is also a form of guidance. Knowing what was done provides structure and allows us to make sense of a mass of possibilities, thereby reducing clutter. History can perform an organizing function. I will argue below (in section 5) that history provides an externalization of peoples’ mental models and while any given user’s model may not precisely match with any others, it is still an organizing framework to which one can react or relate. Knowing who has done something, or who is involved in the interaction history, can be important as well. Companionability refers to our natural desire to do things with our friends (companions). If I know what my friends have done I may be more likely to do it; conversely, I may avoid doing what my enemies have done. This is related to sociability, our tendency to do things in groups and to identify with groups even if no specific members of the group are present or known. For example, a Jew such as myself might have a greater interest in doing things knowing that they have been done by other Jews, even without knowing the specific Jews involved. This is similar to re-creation, the desire to do again what someone famous has done in the past. People in the Boston area often follow the path of Paul Revere’s Ride because they are seeking to recreate a famous historical event. Knowing who has done something is also important for establishing authority and possibly authenticity. A margin note written in the author’s own handwriting may be considered more relevant or authoritative than one written by an unknown reader. Knowing why something was done can be important for three reasons. The first and most common one is similarity of purpose. That is, I may care a great deal about something that was done by people with a goal similar to mine. Knowing that the pages in a reference book were dog-eared by someone writing a paper similar to my current writing would be potentially important. A related reason for knowing why interaction history occurred is goal discovery, a form of serendipity. Goal discovery is the process of starting off on one task and realizing that it relates to, or can be co-accomplished with, another task. For example, one could start off to build a system of software agents and realize along the way that this is similar to, and that the tools can be used for, an artificial life system. Goal discovery is important to organizational learning. As Suchman [22] documents, things in office environments almost never happen according to the written procedures. Instead, people find themselves accomplishing tasks by ad hoc and creative responses to changing situations. Know-
ing that these responses can achieve organizational as well as personal goals is an important part of adaptive behavior. An interaction history system which methodically recorded and made available these discoveries could significantly aid organizational learning. Finally, knowing why something happened is crucial for explanation and learning. For example, I may be in the process of making an addition to my house and knowing that the previous owner built up the flooring to avoid rot from poor drainage could be very important. Likewise, software engineers often find themselves concerned with design rationale as they attempt to maintain software systems. Having the code, the comments, and the documentation is often not enough since some questions can only be answered by knowing why a particular approach was chosen, and why other alternatives were rejected, if they were even considered at all. Finally, knowing how some bit of interaction history was done can be important for issues of naturalness. Objects afford certain ways of interaction; that is, they make some interactions easier and some harder. As noted above, much documentation concentrates on how things get done. This can be particularly helpful for novice users who may find themselves in need of simple assistance to accomplish a goal. The most common place to see this is in software installation systems. These systems give users step-by-step instructions on how to unpack, install, and often customize new software. It is also seen in some online help systems; for example, Microsoft Office’s assistant has a “show me” mode in which it will show the user how to select the correct options from menus, how to fill in dialog boxes, and so forth.
4. Problem Domain In order to investigate the possible forms of interaction history, we have chosen to focus on the domain of information navigation. That is, the process of finding one’s way in an information space. Our use of interaction history to help with this task places us in the domain of social navigation [2], a process which is common in the real world. For example, when you want to find a mechanic for your car, it is easier to ask a friend what mechanic he uses than it is to try and pick one from the Yellow Pages. Likewise, it is easier to find useful pages on the Web by looking in human-compiled reference documents such as newsgroup FAQs (Frequently Answered Questions) than by looking at machine-generated search results. Probably the most common form of social navigation is information recommendation, sometimes referred to as social filtering [20]. Information, usually in the form of ratings, from other users is applied to help the current user.
This is done either by selecting one or a few items from a large database of potentially recommendable items, or by ordering, rating or filtering information items based on past ratings data. Systems which fall into this category include the Bellcore video recommender [7], the MIT Media Lab’s HOMR music-recommendation system [19], the Do-I-Care Agent (DICA) for Web pages [21], and the Usenet news rating system GroupLens [16]. Hill and Terveen’s PHOAKS (People Helping One Another Know Stuff) system [9] uses FAQs and other postings to select URLs for recommendation. Although this sort of recommendation is “navigation” in a sense, we are more interested in the literal problems of finding one’s way around. We believe this task is an appropriate one because it is an increasing problem in large information spaces such as the World Wide Web and because it is a task which normally makes use of traces and history information. Hutchins’ book Cognition in the Wild [11] gives an elaborate description both of the artifacts used in modern ship navigation and the particularly social nature of the task. To help in our Web-based social navigation task, we were inspired by three artifacts common to many forms of navigation in the real world: maps, trails (or paths), and signposts. We are investigating how these tools can be made history-rich or used in a history-rich interface.
5. Tools Built As part of this project we have been developing prototypes associated with helping us understand the issues around interaction history. We have built several tools to use history in the display of navigation information. Each of the tools represents a point in the multidimensional framework described above. The project, called Footprints by analogy with the footprints we leave in the physical world, involves deploying and testing these tools in both controlled situations and users’ normal browsing environments [26]. Footprints uses information from web server logs to see where users have gone, then processes that information into various displays, illustrated below. The information gathered is a series of A->B transition pairs, where A and B are Web documents and the transition is any navigation technique used to get from document A to document B. This is often clicking on a link embedded in the HTML of page A which takes them to page B, but can also be typing in a URL or selecting a bookmark. The system combines these simple transition pairs into more complex structures, such as:
A C B
D E
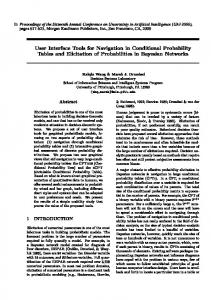
That is, the document B and all documents used to reach it as well as all documents reached from B. The system also assembles linear sequences of transitions into trails, as described below. The first version of the system [23] used maps, as shown in Figure 2. These maps take the information about which pages at a Web site the user has visited and construct a directed graph representation: nodes are pages, and edges are traversals used to get from one web page to another. The map in Footprints is displayed using a hyperbolic geometry, in the style of Lamping et al’s work at Xerox PARC [13]. This representation was chosen because it deals well with the highly nonplanar and highly disconnected graphs produced by our interaction histories. That is, they are likely to have a large number of edge crossings no matter what layout method is used and users will probably want to look at different parts of the map separately. Users can drag and rotate the objects in the map to improve their view of any given part of it. Links are colorcoded to show the relative flow of traffic. The most heavily-used links are in red, the least heavily used are in blue and intermediate levels of use are in shades of purple. Not all pages at a site are represented in a Footprints map; only those actually visited by users. Edges, as noted above, may be created by users clicking on URLs within the page, or by any other means, such as the user selecting a bookmark or typing in a new URL. In some ways, these “other” links are more interesting, in that they show transitions between pages which do not exist in the HTML but which users feel are appropriate for one reason or another. This is an insight into users’ cognitive models of how information should be related. Usage maps provide an interesting complement to the conventional quantitative (hit-count) based methods of looking at Web traffic. These maps show sequence, obviously, but at a higher level they can be seen to expose the kinds of experiences which users can get from a web site. This information is useful for two classes of users: • new users, who want to be able to see quickly and clearly what experiences an information space has to offer, and • information designers, who want to be able to see how the experience users are having with their information space matches their model(s) of how the space would be experienced. Figure 3 shows two different kinds of experience within the same interaction history map. This map is taken from
three weeks’ use of the Software Agents Group web site. The circled sets of nodes show the experiences. We name these experiences reference, but have not developed an ontology or taxonomy of possible experiences. The first experience (upper right) is called “Narrative” because it takes the form of a traditional story: tell me something, tell me something else, then tell me another thing, with only minor diversions off the main thread. This sort of experience works well for users who want a slowerpaced introduction to material. A user who preferred to dive right in might look instead for a “Storefront” experience, such as the one in the lower left of Figure 3. In this experience, as in the aisles of a store, there is a rich interconnection of items, with no obvious natural sequence among them. We are not attempting to say that one sort of experience is better than another. The point is that this sort of information is different from, and complementary to, the standard quantitative hit-count based approaches. History shows us the experience, which is valuable both for users who want to know what kind of experience they can expect from an information space, and for information designers. Designers can both look at an ongoing experience and can compare experiences based on changes they make to the information presentation. Users will be very inventive in trying to do things they think ought to be do-able, no matter how hostile the interface may be to their doing it. When such connections show up across many users, the wise information designer will work to accommodate them. From the point of view of our framework for describing interaction history systems (section 3) the map tool is moderately proxemic — users quickly identify the document icons and traversals. The color coding and hyperbolic geometry manipulations take a bit more learning.
in the form of losing, since documents which are removed by authors from the Web also disappear from the Footprints map. The representation does not permeate the data — it is in separate windows. The history is social, since Footprints maintains no notion of user identity. All users’ data are merged into the one representation. Finally, the information collected is of “what” documents were visited, in what order, and what transitions between them were taken.
5.1. Version 2 — Trails and Annotations
Figure 2. Use map of agents web site
Of course, experiences in Web browsing are rarely confined to one site. Therefore, our latest version allows users to be followed across multiple web sites as they browse. The result is a set of trails of pages which are connected both directly (by links on the pages) and indirectly (by other actions the user takes). These trails are then compared to show relative levels of use. The levels are also color-coded for ease of recognition with shades from blue (lightly used) to red (heavily used). Color-coded words are also placed next to the end-nodes of trails based on their level of use. Nodes are again Web documents, and links are transitions between them. Users can single-click on nodes to see their titles (thus the stair-step representation, which leaves room for text display). Double-clicking on a node brings it up in the corresponding browser window. However, the trails representation does not stay static as the map does. When the user moves to a new page, either by clicking on a node in the trails view, clicking on a URL in the Web page, or typing in a URL, the trails view adjusts. It always shows all and only the trails relevant to a given page. For example, in Figure 4, the user is on the page listing the publications of the Software Agents group; this node is highlighted in black. Footprints displays all it knows about all the paths; however, to minimize visual clutter and help give a sense of decisions, the system combines trails which have a common starting point so that similar paths are shown merged. For example, imagine that the following sets of paths are in the database. A->B->C->D A->B->C->E A->B->D->F
Figure 3. Narrative and storefront experiences
In our alpha (quantitative) testing, information designers and expert users understood the representations much faster than novice users. The tools are passive, since the user does her normal browsing and then system silently records. Since data are checked for current viability before including into the maps, the rate of change of the system is the same as the evolutionary life of the Web. Fading comes
Then if the user was looking at page B, the representation would be:
A B C E D D F The two representations of ‘D’ are not collapsed since they represent different paths through the space. The multiple representations of A and B are collapsed, however, since their positions in the path space are identical. If the user selects page C, the representation changes to: A
there has been no attempt before now to capture different ways that Web-based presentations are actually being read. History gives us a way to see these models and possibly manipulate them. The next example, Figure 6, shows an interesting dichotomy in how people make and use Web pages. It shows two paths which include the home page of Pattie Maes, who heads the Software Agents group. In the more often used path (the bottom of Figure 6) people start offsite at the “PowerGrid Journal” page.
B C E D The A->B->D->F path is removed because it is no longer relevant. Other paths containing page C (which do not also contain page B) would be shown if they were in the database. If we think of the map representation as the highest level in the sense that it overviews a set of history information from a great virtual altitude point of view, then the trails representation is slightly lower level. The same interaction history information as was shown on a map can also be shown in the trails; however, the trails separate out the sequences. In this sense, maps are a merged set of trails. Annotations, presented below, are a level below trails. Figure 5 shows three different trails which exist in our database relating to a paper [3] written by Leonard Foner about an agent called Julia. The Web version of the paper is broken up into different segments which can be navigated to in different ways. In Figure 5, the user is looking at the “Why Julia wins” section of the paper and can see that there are three ways people have used to get to this point. In the least-used trail (bottom of Figure 5), users have started with the Agents group publication page, and skimmed the article, stopping after reading “Why Julia Wins.” More users (topmost trail) start elsewhere, presumably are less familiar with the concept of agents, and come to the “Why Julia wins” page only after visiting the page on “Crucial notions.” These users then go on to other pages. The highest percentage of users who visit this page come in from offsite, read several sections of the paper then stop, or go elsewhere. This example is interesting because it illustrates how three different models of how to read this paper can co-exist. We all “know” that writing papers on the Web is not like writing them in text, but as far as I know
Figure 4. Paths showing degrees of use
Figure 5. Three ways of looking at a paper
This journal has reprinted Maes’ article [14]; in the Web version, each page is given its own page. People who make it through the article are curious, and follow a link from there to Maes’ home page. Since their interest is in software agents, they then go on to read about the Software Agents Group by visiting our group home page.
Figure 6. Who is Pattie Maes?
A different group of people start off searching for sites about software agents and for some reason find themselves interested in the people who make such agents. They then follow a link to a page on our Web server which describes the people in our group, including Maes. These people,
once they have gotten to her page, continue to be interested in her personally and visit her page of family pictures. One of the hardest problems in classical information retrieval [18] is the question of deciding what a document is “about.” Keywords, abstracts, and automatic summaries have been tried, each with varying degrees of success. The more homogeneous a document is, the better these methods succeed. Home pages on the Web are an uniquely bad data set for this kind of technique, because they are so diverse. Finding a single thing which a home page (or even most Web pages) are “about” is a recipe for failure. Interaction history allows multiple senses of “about” to co-exist. For example, Maes’ home page is in some sense about Maes-the-researcher and in some sense about Maesthe-family-person. This multiplicity is natural in our lives where we all play multiple roles, sometimes simultaneously. Objects may have multiple uses: books can be doorstops or window props or even hammers in the right situations. These multiple senses can aid our understanding. Earlier I argued that interaction history was valuable in part because it helped to provide context for information to which users can navigate. Figure 6 provides an example of this: we understand much better who Maes is if we can see her not only as the leader of the Software Agents Group, but also as a person.
5.2. On-board information: annotated pages The tools discussed so far all use windows separate from the user’s browser window. We are also experimenting with on-board information, in the form of annotations placed within the Web pages themselves. Figure 7 shows a Web page with annotations, which appear in the form of percentages next to each link which can be detected in the HTML of the page. They represent the percentage of people visiting this page who followed each of the links off the page. This is, essentially, the same information as is present in the trails discussed above, but shown from a still “lower” point of view, in comparison to the view given by maps and by trails. There are, however, some important differences. First, the annotations are numerical rather than categorical as in trails. Second, the annotations do not represent all the data that is available. Any links which exist but are not represented in the HTML of the document (for example in imagemaps or cgi-bin generated links) cannot be annotated. In addition, the Web presents a number of difficulties for displaying permeated interaction history information. The display parameters which one might manipulate in a traditional user interface, such as color, font type and size, and location of the displayed information, are all under the con-
trol of the page designer. An interaction history system using any of these parameters for history display would risk obscuring or even destroying the very information which it was trying to augment. This augmentation is key; we must remember that interaction history is not the point of the user doing the browsing and may in many cases not even be relevant to her accomplishing her task. If dealing with history information becomes the task, then we have done something wrong, much as someone who cuts pages out of a book makes impossible the later use of that book for its original purpose. Even with these limitations, however, annotations may yet prove to be useful. They show very directly which options are of most interest to users; for example, in Figure 7 most people who visit the page are clearly interested in learning in about Programming by Example. Far fewer are repeat visitors (who likely clicked on “What’s new here?”). In addition, the sum total of all the links followed is about one third of all the visitors. That is, two thirds of people who visited this page went somewhere other than to a page linked to this one. That indicates that either many people came to this page in error (which may be a problem with pages that link to this one), that this page answered their question or satisfied their curiosity, or that this page is simply not enticing enough. Separating out these reasons requires a different sort of history information. With respect to our framework for interaction history systems, trails and maps are very similar. They differ in how they represent the same history, and each representation offers different insights. While maps show experiences better, trails show user decision points better. Annotations are an attempt to show history information which permeates the objects (Web pages). Otherwise, its properties and description in the framework are the same as the other tools.
Figure 7. Annotated page
5.3. Behind the Scenes The first version of the Footprints tools used a Java applet to create and control the maps. However, we wanted more flexibility and the ability to work with more browsers, so we changed our design for the current version. The present design is represented in Figure 8. In this design we use a proxy server, which is a Java program. This server handles communication with Web servers out on the net, but also includes a communication path to get data from the Footprints database. The proxy handles displaying the map and trail windows as well as inserting annotations into the Web pages, if the user requests them. The use of a central database is an obvious drawback. In an ideal world, interaction history information would be present and kept with every digital object. However, until we reach that sort of world, we are using a central database for convenience and simplicity, even though this slows down the interaction by approximately a factor of two. This architecture is primarily useful because it frees us from depending on the browser manufacturers to support the latest versions of Java, which we may need. In most ways our proxy server is like any other, but it allows us to modularly control the HTTP stream into and out of the browser. This is convenient for us, as we wish to continue adding and testing different interaction history tools.
Map
Trails
Browser proxy server
Footprints Database
Web Servers
Figure 8. Footprints architecture
The proxy also has a simple control panel which allows users to individually turn on and off the various history tools. In addition, if users do not want to use the system, it is a simple button press to turn off the proxy in their browser’s preferences. There is also a Footprints Web site (footprints. media.mit.edu) which allows users to download the latest versions of the software and to search the database for trails of interest, based on simple keyword matching.
6. Status and Future Work The Footprints tools are presently being given to betatest users. In addition, we are beginning a series of experiments to determine the effectiveness of interaction history information for a social navigation task. One of the key unanswered questions in this project is exactly what history information should be shown in each of the tools. As noted in the discussion of maps, we are in fact showing very few of the possible bits of information that could be displayed. To some extent, this is based on advice and early experience [10] and a concern that showing too much history information would distract people from their primary tasks. We are also considering ways in which various factors could be systematically applied as filters against the basic history information. So, for example, users might want to filter which paths they see based on how recently the paths
have been used, or based on some measure of how “hot” the information is. As noted above, the tools we have built so far concentrate on the passive side of the design space. Version 3 of Footprints, which will be deployed in June 1998, will contain tools to allow users to input more active forms of history. We will have tools to accept comments on pages and trails that the user has seen or followed, and a mechanism to allow users to specify why they have visited a particular page. Once these active-history tools have been designed they will also be tested. Similarity of purpose may turn out to be a useful filter, as noted above. However, we want to make sure that this project does not simply become another “guides” project in which people are encouraged to follow paths laid down by some authority [4] [24]. Footprints is much more concerned with the ability of communities of users to allow their own uses of the objects to be seen.
7. Conclusion It is early in the project to draw any grand conclusions. At this point, our efforts are primarily aimed at demonstrating that the idea of interaction history is a valid one and that we can indeed transfer from the physical world useful notions of navigation which can be appropriately applied to social navigation in an information space. The examples in this paper are intended to show that not only is this possible, but that even simple tools can be extremely effective in helping users accomplish tasks which are difficult or impossible without interaction history information. We believe we have demonstrated usefulness in four areas so far: - discerning what kind(s) of experiences an information space might offer; - expressing different ways of looking at a hypertext (Web) document; - understanding different, orthogonal senses of a complex document; - increasing understanding by providing multiple ways to reach the same information. More tools need to be created, and more testing needs to be done, but I believe that the examples shown here hold promise for convincing others that interaction history can have useful and even surprisingly good effects on the problem of social navigation.
Thanks The original suggestion for, and continuing impetus in pursuing, interaction history is due to Pattie Maes. Tom Erickson provided extensive review of an earlier draft of
this paper. Alex Lian, Felix Klock, and Jim Matysczak wrote much of the Footprints software.
8. References [1]
Brand, Stuart. How Buildings Learn: What happens after they’re built, Penguin Books, 1994.
[2]
Dourish, Paul & Matthew Chalmers. “Running Out of Space: Models of Information Navigation,” available from http://www.best.com/~jpd/papers.html, presented at HCI’94, Glasgow, 1994.
[3]
Foner, Leonard. “Entertaining Agents: a sociological case study,” Proceedings of the First International Conference on Autonomous Agents, ACM Press, 1997.
[4]
Furuta et al. “Hypertext Paths and the World Wide Web: Experiences with Walden’s Paths,” Proceedings of Hypertext’97, ACM Press, 1997.
[5]
Hall, Edward T. The Silent Language, Anchor, 1973.
[6]
Hill, Hollan, Wroblewski & McCandles. “Edit Wear and Read Wear,” Proceedings of CHI’92 Conference on Human Factors in Computing Systems, ACM Press, 1992.
[7]
Hill, Stead, Rosenstein & Furnas. “Recommending and Evaluating Choices in a Virtual Community of Use,” Proceedings of CHI’95 Conference on Human Factors in Computing Systems, ACM Press, 1995.
[8]
Hill, Will & Jim Hollan. “History-Enriched Digital Objects,” Proceedings of Computers, Freedom, and Privacy (CFP’93), available from http:// www.cpsr.org/dox/conferences/cfp93/hill-hollan.html
[9]
Hill, Will & Loren Terveen. “Using Frequency-ofMention in Public Conversations for Social Filtering,” Proceedings of CSCW’96 Conference on Computer-Supported Cooperative Work, ACM Press, 1996.
[10] Hill, Will. personal communication with the author. [11] Hutchins, Edwin. Cognition in the Wild, MIT Press, 1995. [12] Krier, Leonard. “Houses, Palaces, Cities,” A. D. Profile 54, London, Architectural Design, 1984. [13] Lamping, Rao & Pirolli. “A Focus+Context Technique Based on Hyperbolic Geometry for Visualizing Large Hierarchies,” Proceedings of CHI’95 Conference on Human Factors in Computing Systems, ACM
Press, 1995. [14] Maes, Pattie. “Agents that Reduce Work and Information Overload,” Communications of the ACM, Vol 37#7, ACM Press, 1994. [15] Engestrom, Brown, Engestrom & Koistinen. “Organizational Forgetting: an Activity-Theoretical Perspective” in Collective Remembering, Middleton & Edwards (eds.), Sage Publications, 1990. [16] Miller, Riedl, & Konstan. “Experiences with GroupLens: Making Usenet useful again,” Proceedings of the 1997 Usenix Winter Technical Conference, Jan 1997. [17] Norman, Donald A. The Psychology of Everyday Things, Basic Books, 1988. [18] Salton, Gerard. The SMART System — Experiments in Automatic Document Processing, Prentice Hall, 1971. [19] Shardanand, Upendra. Social Information Filtering for Music Recommendation, S.M. Thesis, Program in Media Arts and Sciences, Massachusetts Institute of Technology, 1994. [20] Shardanand, Upendra & Pattie Maes. “Social Information Filtering: Algorithms for Automating `Word of Mouth’,” Proceedings of CHI’95 Conference on Human Factors in Computing Systems, ACM Press, 1995. [21] Starr, Ackerman & Pazzani. “Do-I-Care: A Collaborative Web Agent,” Proceedings of CHI’96 Conference on Human Factors in Computing Systems, ACM Press, 1996. [22] Suchman, Lucy A. Plans and Situated Actions, Cambridge University Press, 1987. [23] Wexelblat, Alan & Pattie Maes. “Visualizing Histories for Web Browsing,” RIAO’97: Computer-Assisted Information Retrieval on the Internet, Montreal, 1997. [24] Zellweger, Polly. “Scripted Documents: A hypertext path mechanism,” Proceedings of Hypertext’89, ACM Press, 1997. [25] see http://cnn.com/US/9712/25/lost.museum/ [26] The latest publicly released version of the Footprints software can be found at http://footprints.media.mit.edu