The original publication is available at www.springerlink.com
Machine Vision and Applications (2008) 19:329–343 DOI 10.1007/s00138-007-0077-z
SPECIAL ISSUE PAPER
How close are we to solving the problem of automated visual surveillance? A review of real-world surveillance, scientific progress and evaluative mechanisms Hannah M. Dee · Sergio A. Velastin
Received: 15 April 2006 / Accepted: 18 March 2007 / Published online: 5 May 2007 © Springer-Verlag 2007
Abstract The problem of automated visual surveillance has spawned a lively research area, with 2005 seeing three conferences or workshops and special issues of two major journals devoted to the topic. These alone are responsible for somewhere in the region of 240 papers and posters on automated visual surveillance before we begin to count those presented in more general fora. Many of these systems and algorithms perform one small sub-part of the surveillance task, such as motion detection. But even with low level image processing tasks it is often difficult to compare systems on the basis of published results alone. This review paper aims to answer the difficult question “How close are we to developing surveillance related systems which are really useful?” The first section of this paper considers the question of surveillance in the real world: installations, systems and practises. The main body of the paper then considers existing computer vision techniques with an emphasis on higher level processes such as behaviour modelling and event detection. We conclude with a review of the evaluative mechanisms that have grown from within the computer vision community in an attempt to provide some form of robust evaluation and cross-system comparability.
1 Introduction The technical problems surrounding automated visual surveillance are central to much research within the computer H. M. Dee (B) School of Computing, University of Leeds, Leeds LS2 9JT, UK e-mail:
[email protected] S. A. Velastin Digital Imaging Research Centre, Kingston University, Kingston-upon-Thames KT1 2EE, UK
vision community. The practical and social aspects of this domain have received a good deal of attention within sociology, criminology and also government, but there is a lack of integration between technical practitioners and those who study real-world surveillance installations. By working on algorithms which address specific issues linked to surveillance, researchers have developed a number of sub-systems and partial solutions which go some way towards solving elements of what we shall call the problem of surveillance. Much progress has been made, but in a piecemeal fashion, and often without reference to the situations in which such systems might actually be used. The aim of this paper is to provide a review of surveillance-related work within the context of real-world surveillance problems. One central issue here is the problem of robustness. Robustness is defined by the IEEE [30] as “the degree to which a system or component can function correctly in the presence of invalid inputs or stressful environment conditions”, and this property is clearly vital for automated visual surveillance. Within computer vision, the term robustness is often used in the related, statistical sense: robustness in statistics is the ability for a test to handle data which deviate from its assumptions (e.g. the ability for a Gaussian-based model to handle non-Gaussian noise) [22]. This distinction is a subtle one, and perhaps a result of an emphasis on mathematical and scientific progress rather than upon systems engineering within the computer vision community. Peter Meer in [49] points out that the aim of computer vision is to mimic human visual perception, and thus in the broadest sense the robustness of a computer vision algorithm should be judged against human performance at the specific task. However, automated visual surveillance is a task that can be described (and performed) at many different levels of abstraction or explanation—we can talk at the level of detecting interesting events or we can talk at the level of classifying
123
330
a particular pixel as foreground or background. Success at one level of analysis may or may not be predicated upon success at lower levels. Whether we should follow Meer’s advice and measure robustness against human performance at the level of the surveillance system, or at the level of any one of the individual components of such a system, is still an open question. Whilst humans are very good at certain tasks (e.g. the detection of unusual motion), they are quite poor performers in other areas (e.g, the detection of abandoned packages in crowded areas). There is no a priori reason for assuming that a computerised surveillance system could not outperform a human doing the same task—as we shall show in the next section, human performance in this field is often far from optimal. This paper will begin in Sect. 2 with an overview of the way in which CCTV installations really work, highlighting the areas in which technology could be used to improve their functioning. Section 3 covers the computer vision community’s efforts to address the problem of automated visual surveillance, both at the level of individual algorithms and at the level of complete systems, discussing their applicability to the real-world problems identified earlier. Section 4 looks at the problem of evaluating such systems: this is a particularly problematic area as traditionally vision scientists have each tested their algorithms on different datasets, making crosssystem comparisons difficult if not impossible. We conclude in Sect. 5 with suggestions for future research directions.
2 Surveillance in the real world A useful source of information and guidance is often overlooked by academics creating automated surveillance systems, and that is the experience of real-world closed circuit television (CCTV) installations and operatives. This section attempts to go some way towards correcting this imbalance by describing the ways in which CCTV installations actually work, the ways in which these real-world systems can help inform technological development, and the ways in which technology could be used to improve their working. Norris et al. [53] provide an overview of the introduction of CCTV cameras internationally, and show that the UK is a clear leader. Whilst the precise number of UK cameras is unknown, the human rights group Liberty put it at 4 million in 2005 [40] which is approximately one for every 17 people. Other countries may be catching up with rapid take-up of CCTV technology in the USA, the Netherlands, France, the Republic of Ireland, and Italy. Increases in the use of CCTV are also described in the Middle East, South Africa, Australasia, India, Russia and Eastern Europe. The general trend appears to be for the retail sector and other private concerns to adopt CCTV first, and for the surveillance of public space to follow.
123
H. Dee, S. A. Velastin
In the majority of large CCTV installations, with some hundreds of cameras, only a small fraction are ever watched. One survey [39] reported camera to screen ratios (in a public transport setting) of between 1:4 and 1:78. In our informal survey of four local authority installations within the UK, we found the ratio of screens to cameras lies between 1:4 and 1:30, and the ratio of operatives to screens can be as high as 1:16. So whilst in theory all cameras are monitored in some way (and in some installations every camera is watched at least once a day as part of a camera-test procedure), only a small fraction are monitored in real-time. The rest are only watched following an incident – monitored only in recorded time.1 Practically, it is acknowledged that each operative can only really monitor 1–4 screens at a time [87], so in a typical installation with 100 cameras and 3 operatives, as few as 3% of screens are likely to be actively monitored by a human at any one time. There is also the issue of “breaks” away from the screen (a recommendation of 5–10 min each hour [87]) for health and safety reasons. In local authority installations in the UK, camera choice is sometimes made with guidance from external agencies (for example, many installations are linked into police radios and/or maintain a police presence in the control room). However, current CCTV systems often leave the decisions about which cameras to watch to the operatives themselves. This can leave the system open to abuse (such as the targetting of minority groups) and has attracted the attention of human rights and anti-surveillance groups. A problem highlighted by sociological studies [46,74] is that CCTV operatives frequently decide which cameras to monitor based upon the appearance rather than the behaviour of the people on the screen. CCTV operators suffer from the obvious problem of boredom: in the vast majority of surveillance situations, nothing happens. Playing “hide and seek” with security officers on the ground, reading newspapers, and frequent tea or coffee breaks all help to alleviate the boredom. One operative admitted to targetting a specific camera on his own car all evening [74]. Finally, not all CCTV operators are trustworthy, as the story of Sefton Council operators charged with voyeurism shows [5]. Norris and Armstrong have carried out an in-depth study of custom, rules and practise in surveillance installations including long-term monitoring of both a city centre and a small town CCTV system in the UK. In [52], drawing on the work of Sacks [62], they codify the 7 working rules of surveillance installations. The first three of these are direct descendants of Sacks’s work with police officers, but the 1
Figures from Ms H Mallinder, Tower Hamlets Antisocial Behaviour Control Unit, Mr L Walters, Liverpool CityWatch, Mr D Walsh, Manchester CCTV, and Mr R Greaves of Wandsworth Community Safety. Personal communications, 2005–2006.
How close are we to solving the problem of automated visual surveillance?
remaining four are surveillance-specific. Rules four to six concern spatio-temporal patterns of behaviour, and the targetting of people considered to be out of place or out of time, such as the targetting of homeless people in the city centre [52, p. 141]. Rule 7 is the only rule to refer directly to the surveillance cameras, and states that “Operators learn to see those who treat the presence of the cameras as other than normal as other than normal themselves” ([52], p. 119). In a series of interviews we have held with CCTV operatives and managers, similar patterns have emerged, in particular the targetting of cameras at those thought to be out of place or out of time. Interestingly, it was reported that instances of the people under surveillance actually noticing the cameras were very rare.The interviewees were also keen to emphasise and identify particular behaviour patterns, which are of particular interest to surveillance researchers, such as the following: – “Trouble happens when groups of lads stop”. – A pattern of approach, retreat, strike—for example, with car theft, the perpetrator will often go up and circle the vehicle, then retreat before making a move. – Loitering in certain areas (ATM machines, for example) is seen as worthy of surveillance, but other areas (such as bus-stops) are fine. – Even those areas in which “loitering” is considered acceptable have limits, such as waiting on a train platform whilst several trains pass through. How such information can be incorporated into automated CCTV monitoring systems is an open research question, but modelling the spatial or geographical characteristics of the behaviour patterns—such as inactivity zones [47]—would seem to be vital. One significant question which needs to be addressed in any consideration of practical CCTV operation is whether the cameras are effective in reducing crime. The massive expansion in CCTV coverage in the UK has happened without much systematic evaluation into whether the systems actually work. In [45] and [3] surveys of evaluative studies are presented and the only conclusion that can be drawn from these is that nobody really knows. Some evaluations suggest CCTV works, and some do not. Tilley, in [82] determines nine possible confounding variables many of which are echoed in other studies of CCTV evaluation [3,15,73]. These include problems associated with changes other than the introduction of CCTV, such as background fluctuations in crime rate and changes to the area under surveillance. They also include the frequently cited and strangely contradictory problems of diffusion, where areas near to CCTV installations but outof-view also experience a drop in crime rate, and displacement, where crime is simply displaced to neighbouring areas
331
without surveillance. CCTV seems to have different effects on different types of crime—and these effects do not seem to be consistent across different CCTV installations. We can conclude from this brief review of the surveillance literature from within criminology and sociology that there are several outstanding problems with CCTV as a crime prevention tool. External guidance of CCTV cameras in city centre installations is common (with, for example, police radio links into the control room), but even in situations where such a link exists the majority of camera targetting is carried out by the operatives themselves. Studies into the impact of CCTV are inconclusive on the question of whether an unwatched CCTV camera has a deterrent effect. If it were feasible for unmonitored cameras to be “watched” by intelligent CCTV systems which were then capable of alerting any operatives, this situation might change. It is surely worth noting, too, that existing CCTV installations consist largely of pan-tilt-zoom (PTZ) cameras, which are unlikely to be cutting edge technology (and indeed more likely to be several years old). Algorithms which only work at high resolution in good light with a static camera are not likely to be widely adopted in the real world. Anecdotally, those real world CCTV installations with static cameras suffer from different problems, such as spider webs obscuring the view, or cleaning staff moving the camera. This means that even those algorithms designed to work on static cameras require an element of robustness, in that they need to be able to behave appropriately when their assumptions (clear view, static camera) are violated.
3 Computer vision systems and algorithms applicable to the problem of surveillance This section provides an overview of those computer vision technologies that are applicable to the problem of surveillance. Some of these systems and algorithms are designed to solve just one problem (for example, abandoned package detection) and others are designed to be complete surveillance systems, from pixels through to the modelling of behaviour. Often, the organisation of computer vision systems is hierarchical and the organisation of this section reflects this: we start with tracking and occlusion reasoning, then scene modelling, then behaviour analysis, and conclude with event detection systems. The majority of computer vision systems for surveillance are organised in this way, with low-level image processing techniques feeding into tracking algorithms which in turn feed into higher level scene analysis and/or behaviour analysis modules. The flow of processing is nearly always unidirectional. We do not consider the “lowest level” of processing here (motion detection and background subtraction algorithms) due to space constraints.
123
332
3.1 Tracking and occlusion reasoning In tracking, a process to estimate a model of dynamics such as a Kalman filter [38] or particle filter (sometimes called CONDENSATION) [32] is used to identify foreground pixels over time as belonging to a particular moving or occasionally stationary object. Appearance-based approaches to tracking using contours [4] and pattern matching [66,85] have shown success, as have Bayesian [33] approaches. One tracking problem which has received increasing levels of attention recently is that of occlusion handling. Occlusions are related to obstacles, and often researchers attempt to model both at the same time. We make the distinction that occlusions are defined with respect to the camera and occur when something falls between the lens of the camera and the object of interest. In contrast, obstacles are physical objects that exist in specific ground plane locations, and may or may not occlude the camera, but do affect the paths of the objects moving within the scene. Whilst the handling of occlusions is a tracking problem, the modelling of obstacles is a problem for scene and behaviour analysis and is considered in Sect. 3.2. In [57] vehicular occlusions are handled by maintaining a ground plane representation and an estimate of vehicle size. Senior, in [66] handles static foreground occlusions by maintaining three models: pixels are classified as either foreground occluding pixels, background pixels or moving object pixels. In [65] a method for learning a model of scene occlusions from the tracks of moving agents using minimum description length is described, which creates successively more detailed depth models by dividing the scene into “layers”. In [20] Greenhill and others develop this approach, and create a depth map based upon the location in the image plane of the top of each moving person’s head. These depths are then regularised using a Hopfield neural network and the resultant occlusion images deal well with difficult scenes such as an underground station with a stepped row of ticket machines. Xu and Ellis [90] have also carried out research into occlusion analysis; however, they deal with tracking through occlusions and rely upon a hand-crafted model of actual occlusion location. Their classification of occlusions into “long term” (occlusions from which agents are not expected to reappear, such as doors to buildings), “short term” (small occlusions like trees) and “border” occlusions (things which abut the edge of the scene) is a useful one for many tracking applications. Stauffer and Grimson in [21,79] describe a multi-camera system which automatically calibrates to a world-coordinate system and produces ground plane coordinates, and it is this which enables the mapping of what they call obstacles (although in our terminology these are more like occlusions). Using an estimate of height to compute the distance from the lens to a pedestrian within the scene, it is obvious that the portion of the field of view
123
H. Dee, S. A. Velastin
between the camera and the person is unoccluded. Likewise, when a person goes behind an object, it can be assumed that there is an obstacle or occlusion at that point.
3.2 Scene modelling Understanding scene characteristics can improve a surveillance application in a number of ways. Knowledge of entrance and exit points can assist in tracker initialisation and knowledge of the paths agents typically take through a scene can be fed back into a tracker to help disambiguate difficult cases. For higher level applications, performing behaviour modelling or cognitive analysis of a scene, a rich scene model can assist greatly (entrances and exits can form goals, as in [13] for example). Occlusion reasoning and scene modelling are related in that they can both help to disambiguate meaning in these situations—indeed they can be handled together (such as in Stauffer [77]). The most common technique for modelling entrances and exits is to fit a Gaussian mixture model (GMM) to the start and end points of trajectories using the Expectation Maximisation (EM) algorithm, as in McKenna and Nait-Charif [47], Stauffer [77], Makris and Ellis [43]. As mentioned in Sect. 2, the real-world targetting of surveillance cameras is often dependent upon spatial characteristics, as behaviour patterns such as loitering are only worthy of interest if they occur in relation to particular areas. Hence the modelling of scene characteristics could be an important feature of any real-world system. McKenna and Nait-Charif’s [47] work is in a constrained environment: a single room inside a home. Inactivity zones are learned by fitting a GMM to points in the scene where the agent’s velocity falls below a certain threshold. The application they describe uses this scene model to summarise activity for privacy reasons (“Enter through the hall door, sit on the sofa and then exit through the rear door” becomes HSR) and to detect unusual inactivity, such as a fall, by detecting inactivity outside of the learned inactivity zones. In [77] Stauffer couples the problem of determining entrances and exits – he uses the terms tracking sources and sinks—with the problem of fixing broken tracking sequences. This work is a development of ideas presented by Russell et al. in [28,56], who were concerned with the determination of correspondences between tracked objects across different scenes with very few entry and exit points (a freeway). Stauffer has used a similar technique in lessconstrained single camera scenes using a conservative2 tracker, where tracking output can consist of numerous 2 A conservative tracker is one which only identifies an object or agent as present if there is a high probability of this being the case: very few false positives are returned, but the chance of temporarily losing an object is high.
How close are we to solving the problem of automated visual surveillance?
“tracklets”, or partial tracks. Stauffer’s insight is to couple the problem of stitching together these broken tracklets (the object correspondence problem dealt with in [28,56]) with the estimation of scene entrances and exits. If a tracklet ends near an exit, it is more likely to have ended because the tracked object left the scene than because the tracker has failed. By stitching together the most likely pair of tracklets at each iteration and updating the track stitching correspondences alongside the exit estimation, both problems can be solved simultaneously. Determining the model order for GMM-based exit representations is a problem solved in slightly different ways in each implementation. McKenna and Nait-Charif [47] use maximum penalised likelihood (MAP) estimation, which they claim results in Gaussian components that correspond to meaningful semantic regions. Stauffer [77] uses a variant on minimum description length (MDL), and others [13,43] fit a large number of Gaussians and delete those with low probability. Makris and Ellis [43,44] have developed a scenemodelling technique learned from the tracks of moving agents. The central feature of this technique is the creation of “routes”, “junctions” and “paths”. The approach starts with the detection of routes, which are built up over time from a number of trajectories. Each route is represented as a spline and a set of vectors normal to the spline direction defining the extent to which trajectories deviate from the route spline. Routes are learned by grouping geometrically adjacent trajectories. Each new trajectory is compared to existing routes, and the closest route is updated with the new trajectory data unless the distance is over some threshold, in which case the trajectory is used to start a new route. Paths and junctions emerge from a second level of processing in which route sections that are similar are merged, and a junction placed at each end. The modelling of areas of inactivity (called stop zones) is also performed by fitting a GMM to areas of the scene where an agent’s velocity falls below a certain threshold (as in [47]) with the additional sophistication that typical stop durations are also captured and modelled as an exponential function. In [61], Rowe proposes a system based upon multiple pressure sensors rather than computer vision, in which a particular conception of suspicious behaviour is measured. Suspicious behaviour is defined as that which involves deception or concealment: behaviour with multiple inconsistent goals. The outwardly detectable signs of such behaviour include attempts to hide from other agents, and changes in direction or acceleration. The model Rowe proposes involves first quantizing the scene by dividing it into a number of squares, and then scoring areas of the scene as obstacles. Predicted occupancy and visibility are calculated based upon the ideal paths through the scene and obstacle location. The system is only demonstrated in simulation.
333
3.3 Behaviour analysis and the detection of unusual behaviour Within computer vision for surveillance, behaviour is a word used in its most general sense: the observable actions of agents (humans, animals, cars, etc.). A large “toolkit” of techniques exists for behaviour classification and summarisation. Once the behaviour in question has been tracked and modelled and transformed into some numerical representation, a whole armoury of statistical methods can be used in the classification of these representations—the partitioning of the resultant behaviour space. Examination of the members of each class or partition then enables the authors to semantically label the behaviours: people walking to the left, for example, or cars reversing up a slip road. Hidden Markov Models (HMMs) and Bayesian Networks (BNs) (both examples of graphical models) are the most popular approaches used in the literature. Indeed, a recent review [11] describes the field almost entirely in terms of these techniques. However, other statistical methods are also brought into play. Due to the recent publication of several review papers on this topic, this section will provide a superficial overview and we direct the reader to the aforementioned Buxton paper [11] for a review of behaviour modelling techniques and [27] for a more surveillance specific overview. A huge variety of different variants on the first-order HMM have been proposed. One such model is the CHMM— Coupled Hidden Markov Model—of Brand et al., introduced in [9]. In this model two (or more) HMMs are coupled, with the state of each at time t affecting the state at time t+1. Oliver et al. [54,55] go on to demonstrate this model’s usefulness in modelling pedestrian activity for surveillance, analysing actions which occur between two pedestrians. The CHMM is particularly suited to the analysis of situations where there are two behaviour patterns which may or may not be linked. Brand and Kettnaker [8] use entropy minimisation to determine the structure of an HMM for the detection of events in video: typically, HMM transition topology is either handcrafted, learned by clustering, or discovered through some form of heuristic search. Instead, by minimising the entropy over the model, the data relative to the model, and the cost of encoding aspects of the data not captured by the model, they learn an HMM structure that reflects the structure in the training data. They demonstrate that these models can be used to detect unusual behaviour by noting times at which the HMM assigns a very low likelihood to the data. Variable Length Markov Models (VLMMs) have been used [17,63] for the modelling of behaviours in a number of settings. Cyclic HMMs [42] can be used for the modelling of recurrent or cyclic behaviour. Parallel HMMs (PaHMMs) have been shown to be successful in the recognition of related behaviours, such as the movement of both hands when using sign language [86].
123
334
In addition to this broad family of related HMM models, researchers have coupled HMM systems to other techniques, statistical and otherwise–such as VLMMs and vector quantization [17]. Ivanov and Bobick in [34] separate the problem of recognising primitives from the problem of recognising structure. They use HMMs for detecting primitive events (e.g. car-stop) and a stochastic context free grammar to recognise higher level events. The grammar is hand-crafted for each scenario. A similar approach is described by Wu and others in [89], in which paired HMMs are used to represent behaviours and support vector machines are subsequently used to partition the behaviour space. Robertson and Reid [60] use a database of previously seen actions for recognition, with HMMs used for smoothing sequences and determining the likelihood that a particular HMM explains the current action sequence. Bayesian Networks (BNs) are another type of graphical model, representing factorisation of a joint distribution over all variables. These probabilities can be learned from experience by training, which uses iterative schemes to find a maximum likelihood for the parameters, implemented as localised message passing operations. Remagnino, Tan and Baker in [59] develop a model for the classification and annotation of multi-agent actions, using BNs on two levels. Behaviour agent BNs have input nodes associated with characteristics such as speed, acceleration and heading, which feed up to hidden nodes that in turn feed up into the final behaviour nodes which provide the most probable interpretation of the agent’s behaviour. The second level upon which they operate involves BNs called situation agents, which are activated when the Euclidean separation between two behaviour agents falls below a specified threshold. These encode information about the interaction between two behaviour agents (such as the pedestrian is passing by car three). In [58] the issue of interactions involving more than one agent is raised, and the authors suggest that a third level of BN would be required to handle such complicated interactions (a scene agent). A similar approach to event detection is exemplified by Intille and Bobick in [31]. They use multi-layered BNs to model various aspects of a particular subset of structured multi-agent behaviour. The behaviour they model is that of American Football set “plays”, which are structured, highly choreographed actions. The approach adopted is to use expert information—they use a coach—to encode the actions of each player during a specific play, and to build up a multilayered model of what is actually going on in the scene based upon the visibly determinable goals of the individual agents involved and the temporal and spatial relations between those agents. The relationships between these atomic representations are used to determine the type of multi-agent action being performed. BNs are used at two stages in this process— to integrate the uncertain data from the visual trajectory
123
H. Dee, S. A. Velastin
information, and to perform the multiagent behaviour analysis. The authors do not detect “None of the Above”, so are unable to determine patterns which do not fit one of their plays. Buxton and Gong, in [12] describe a BN-based system for monitoring activity in certain types of surveillance situation: specifically, traffic motion at a junction. Their architecture features a pre-attentive system operating on low-level behaviours, such as velocity and orientation, and a central attentional system which evaluates higher level behaviour patterns such as “overtaking”. This was further developed by Buxton and Howarth [26] who enhanced the attentional use of Bayesian interaction agents to provide conceptual descriptions of behaviour. The attentional component of the system consists of a “tasknet” for a higher level behaviour, and once a tasknet is activated it begins gathering evidence for that particular task. Similarly, Hongeng and others in [25] (expanded upon in [48]) describe a system based upon BNs which can recognise and categorise single agent (single “thread”) events. A finite state machine operates on the output nodes of the BNs, recognising temporally extended multi thread events. The events are hand-coded into the BN. Johnson and Hogg [36,37] have developed a method for behaviour modelling which enables prediction of future behaviour, trajectory classification and the detection of unusual or atypical behaviour patterns. This is achieved through a multi-layered approach in which sub-sampled trajectories are subjected to a version of Vector Quantization (Altruistic Vector Quantization, or AVQ) producing a codebook of representative prototype vectors. These prototypes are then used to train an artificial neural network which contains a layer of leaky neurons which are responsible for encoding the temporal nature of trajectories: each leaky neuron takes just one input and produces just one output, but the output depends upon the neuron’s history. A second neural network with its output nodes is attached to the output of these leaky neurons and performs AVQ on an agent’s whole trajectory. This produces a set of trajectory prototypes (which form a behaviour space), and unseen trajectories can be compared to these prototypes for classification and event detection. Sumpter and Bulpitt [80] present a related technique using neural networks to quantize over trajectories for behaviour modelling and prediction. The network they describe consists of two competitive learning networks, linked by a layer of leaky neurons. In this way, their approach differs from Johnson and Hogg’s, who require an extra learning stage for modelling the whole trajectory. Both of these approaches are capable of prediction and extrapolation, as partial trajectories or configurations can be matched to the closest trajectory prototype in behaviour space and extended. Gong and colleagues [18,19,29,68,69] also attempt to automatically summarise or categorise activities within video. Whilst their systems sometimes incorporate Bayesian
How close are we to solving the problem of automated visual surveillance?
Networks or Hidden Markov Models, this work is characterised by a combination of many different statistical methods. Much does not explicitly model or track events at the object level at all. Instead pixel-wise change is computed, which provides a crude measure of motion within the scene, and a layer of filters are placed on top of this (typically wavelet based filters). In [68,69] the output of these filters is analysed using GMMs to detect events, and then these are clustered (using K-means) to detect higher level events. In [19] the filters are used to create a histogram which provides a continuous scene descriptor, and then subjected to PCA, retaining just the top three eigenvectors to reduce noise. Both approaches can be used to identify events in video sequences which correspond to specific activities—in [68,69] the system detects events within a shop scenario such as “picking up a can”, and in [19] events such as a car reversing are detected. Hung and Gong in [29] present a technique based upon correlating salient motion. Saliency is defined as a measure of the entropy of the data over a spatio-temporal neighbourhood. By correlating salient events, interactions can be determined. The least frequent interactions are found to be unusual or interesting events (cars going the wrong way at an intersection, for example). In [21], Grimson et al. describe the Forest of Sensors project at MIT. This uses the tracker outlined in [79] over a distributed array of sensors, which between them cover a large area of campus. They hypothesise that simply through tracking motion, a range of different computations about the nature and typicality of activity on a site can then be made, and also that certain aspects of scene geography can be mapped out. The authors also analyse the behaviour of the agents within the scene using various clustering approaches. They propose two families of approach, one involving Wallace’s Numerical Hierarchical Cluster (NIHC) [88] and one using a GMM-based approach combined with K-means. The NIHC approach assigns data randomly to clusters in a binary tree, and then iteratively reduces the entropy of this tree. Finally, a Minimum Description Length cut is made which finds a level of clusters that best describe the data. Given these clusters, particular patterns of behaviours emerge such as “people in a queue”. The second approach they describe involves overfitting a large number of Gaussians, each representing a small portion of the 6 dimensional state space (x, y, dx, dy, size, aspect-ratio). This is then clustered using K-means, and the resultant graph is partitioned using a Hopfield network. The first graph cut divides the behaviours into leftbound and rightbound traffic, and the subsequent child nodes represent faster and slower vehicles, pedestrians and the like. In [76] another classification system is described (also part of the “Forest of Sensors” project). This system has similarities to that of Johnson and Hogg [36,37] in that they use Vector Quantization to produce a number of prototypes. These prototypes form a codebook which is then used in place of
335
the original data. From these a co-occurrence matrix is produced and then this new space is split iteratively into two sets, producing a hierarchical tree structure of behaviour patterns. The lower branches of this tree represent semantic categories within the data, such as “pedestrians on a lawn”, or “activity near a loading dock”. The approaches discussed thus far have centered around the idea of building a model of what could be considered “normal” behaviour, and detecting unusual events by determining the degree of fit with the model. Zhong et al. [92] use video prototype co-occurrence to detect unusual activity, by first creating a spatial histogram for each frame and then clustering these using Vector Quantization. Pairwise similarity measures are then produced for each short video segment (a 4 second clip in the described implementation) and these are then embedded in a co-occurrence space, which can be thought of as clustering prototypes and video segments which frequently occur together. Event detection is then performed by finding spatially isolated clusters. Boiman and Irani [7] also deviate from the model-based approach considerably, treating the detection of unusual or interesting behaviour as a form of database search problem. The method they describe depends upon a compositional approach, constructing elements of a new stimulus (either image or video) from a database of previously seen material. Given a database of “normal” video material, the system can detect irregularities by attempting to match moving parts of the new video with the old. This works well at detecting certain types of irregularity – for example, given a database of walking and running activity, any movement that differs from this (crouching, jumping, etc.) is highlighted as unusual. The system cannot detect unusual activity over large timescales, however, or events in which the local motion is normal but the global pattern is unusual (such as circling a car). 3.4 The detection of specific alarm events In the preceding section we reviewed some of the core methods that have been proposed to make algorithms that can derive scene descriptors from a set of data that has been presented to them (normally assumed to represent normal conditions unless specifically noted otherwise). Then, the occurrence of a pattern of data that does not (statistically) conform to the norm can give rise to the issuing of an alarm. In operational conditions, such an alarm could be assessed by a human operator to either result on intervention (if the alarm is true) or feedback to correct future system’s assessment. How the latter can be achieved is still an open question as we do not yet understand how error traceability can be effected in computer vision systems with a multitude of processing levels. It should also be noted that, like most researchers in this field, we have assumed that a decision on whether an event that merits (re)action has occurred is taken purely on
123
336
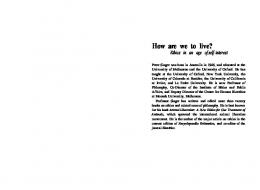
the basis of visual data from one or more cameras, whereas there is evidence that this is certainly not the case in manual systems (for example [81]). In such systems dynamic environmental information such as time of day, weather, traffic conditions, play an important part. How such context can be fused with visual data is an exciting area of research, but its consideration falls outside the scope of this paper. Given the high demands to overcome the practical problem of the lack of human resources to monitor the ever increasing number of CCTV cameras, a number of systems designed to detect specific pre-defined (as opposed to inferred from representative data) alarm events have been proposed. These exploit the well-known approach in machine vision of restricting environmental constraints and operational expectations (as shown by one of the major recent successes of computer vision applications: automatic number plate recognition). Usually linked to government initiatives, early research concentrated on the monitoring of highways [2,23] where typical events included speeding, stopping and congestion. From the mid 1990s a number of projects (e.g. CROMATICA, PRISMATICA and ADVISOR; funded by the European Union) have addressed the monitoring of people in public transport facilities such as metropolitan railways [70,84]. Here, the environments are constrained to interior areas (less prone to changes in ambient lighting), but with the significant challenge that these places are subject to high crowding levels, conditions in which people tracking (as discussed in Sect. 3.1) is well beyond the current state of the art. In the example shown in Fig. 1, the system has successfully detected the displacement of the trash can even in the presence of a large number of people. In this case the system had been programmed to detect semi-permanent changes in the environment (this would include abandoned objects and graffiti). Interestingly, when this video sequence was shown to an audience of fifty experienced CCTV managers, only one noticed this event. The emphasis in this class of systems tends to be on trying to achieve robust pixel-level processing (e.g. background modelling, foreground extraction and optical flow) and the measurement of medium level features such as blobs (centroids, motion vectors, stationary counts, tracks, etc.). Then event detection is largely a matter of applying a set of predetermined spatio-temporal rules that have been found to correlate to what humans would interpret as situations of interest. For example, “blob of size > Sa that has remained stationary for more than T in area A” might trigger the event “abandoned package” while rule “blob of size > Si present in area A p and no blob of size > St in area At ” might trigger the event “person too near the edge of the platform (when the train is not in the station)” (see Fig. 2). As discussed in Sect. 3.3, how these rules can be arrived at automatically (as the pre-programming or configuration of a large number of cameras is unreasonable especially as configurations will
123
H. Dee, S. A. Velastin
Fig. 1 A typical crowded scene in a metro station (courtesy of ATAC (Rome) and Ipsotek Ltd)
need to change frequently over the lifespan of a system) is an issue for which there is still no satisfactory solution. Progress has been made towards formalising this approach for example [10] through a hierarchical classification of primitive events (such as the presence of an object in an area given some a priori meaning) and scenarios (a spatio-temporal combination of events). This gives rise to a structure that represents knowledge in the particular domain in the form of an ontology (see for example [16]) to which it is possible to associate an inference engine to detect events. This type of explicit representation still needs to be arrived at manually and only tends to support simple deterministic rules.
4 Evaluating surveillance related vision systems Surveillance-related vision applications, algorithms and systems have historically been evaluated in an unsystematic way. In some cases, algorithms have been reported as
How close are we to solving the problem of automated visual surveillance?
337
– The False negative rate is the proportion of positive cases incorrectly rejected. – The True negative rate (also known as the specificity) is the proportion of negatives correctly identified as such.
Fig. 2 Detection of presence in a forbidden area (courtesy of ATAC/ Ipsotek Ltd.)
outperforming their rivals, and the evidence presented tends to be somewhat anecdotal, such as simple screen shots. These screen shots may clearly show that algorithm “A” results in (for example) fewer noise pixels than algorithm “B” on a particular frame from a particular dataset, but for a robust system we need to be able to quantify exactly how much better this performance is over a range of data representative of operational conditions. In order to properly evaluate how well an automated system performs a task (be it designating a particular pixel as foreground, or identifying a specific agent’s behaviour as worthy of further investigation) two things are needed: first, an indication of what the right answer is (a ground truth); and second, a distance metric to determine some degree of fit with this ground truth. These factors are not as simple as they might first appear. The collection of ground truth is not unproblematic, and the choice of distance metric will be in part governed by the task. When comparing classification or detection systems the main tools available to aid in the visualisation of results are ROC (Receiver Operating Characteristic) curves and confusion matrices. Confusion matrices are used to visualise the output of classifiers in which each row represents one of the real categories (the “ground truth”) and each column represents one of the classifier outputs. The values in the matrix are the number of items from each real category classified as each classifier output. So if column one represents classified as background and row one represents background according to ground truth, a good classifier would have a high number in that particular table cell. From confusion matrices a number of useful summary statistics can easily be generated: – The False positive rate is the proportion of negative cases that were incorrectly identified as positive. – The True positive rate (also known as sensitivity) is the proportion of positive cases that were correctly identified.
If a threshold is set very high there will be no cases identified correctly (true positives), but also no cases identified incorrectly (false positives) as there will be no positives at all. The converse holds if the threshold is set very low. An ROC curve is a plot of true positive rate against false positive rate, and is a means of visualising the interactions between these characteristics as thresholds are changed. They can help in the robust determination of a threshold, as choosing a threshold which defines a point towards the top left of the curve has the effect of maximising true positives whilst minimising false positives. There have been various significant attempts in recent years to devise benchmarking processes to assess and compare those algorithms or systems addressing the surveillance task. The following sub-sections detail various workshops and challenges developed to improve the quality of evaluative techniques in computer vision systems for surveillance. 4.1 PETS The PETS (Performance Evaluation of Tracking and Surveillance) series of workshops began in 2000 in conjunction with the IEEE Face and Gesture recognition conference. The aim of these workshops is to further the systematic evaluation of surveillance and tracking systems, by providing “standard” datasets alongside ground truth information. The PETS dataset series began in 2000 with a car-park scene, involving cars and pedestrians. Five datasets were released in 2001, four of which cover a similar car-park scene to 2000, from two cameras and for a longer time. The car-park datasets from 2001 are probably the most popular of the PETS series in automated surveillance circles: they contain a range of natural, fairly typical behaviours performed in good natural light, each viewed from more than one camera (dataset 4 even includes footage from a catadioptric camera). The subject matter of other PETS datasets includes footage from a moving car (PETS2001 dataset 5), indoor scenes of people (the particularly challenging 2002 dataset is taken through a reflective plate glass window into a shopping centre, and 2004 is in a foyer), and various non-surveillance related datasets such as smart meeting rooms and hand tracking. PETS-Metrics [91] is a new addition to the PETS series providing an on-line means of evaluating segmentation algorithms. This website (found at http://www.petsmetrics.net) allows researchers to upload their results on a standard dataset in a standard format. The format chosen for this is XML, and a Document Type Definition and code for generating valid
123
338
XML are available from the website. Once a researcher has a valid XML file they can upload this to the website, and various comparisons are performed between their results and the ground-truth data.
4.2 CREDS A recent step towards more systematic evaluation has been made in [93]. In the “Challenge for real time event detection solutions” or CREDS, researchers were invited to try their software on a specific scene from the Paris metro. Systems were tested on their ability to issue warnings when certain pre-defined events such as walking on rails or dropping objects on tracks were detected. A number of camera configurations (both visible and infra-red) and scenarios (such as walking on rails) were released for researchers to use as training data and to fine-tune their algorithms. The submitted software was tested for its ability to produce alarms corresponding to the hand-crafted ground truth. The systems demonstrated as part of the CREDS challenge [6,64,67,75] detected some activities with ease – often simply by defining areas of scene which were forbidden unless the moving object happened to be a train. Some of the systems submitted for the challenge were fully-fledged surveillance systems which were capable of detecting events not specified in the challenge (such as [6], which could detect graffiti and abandoned packages). As a challenge, in which surveillance systems were evaluated against each other and against ground truth, the results are interesting and a move towards more objective evaluation. However, the sequences all appear to be performed by actors, and there was no separate test dataset meaning that the systems were evaluated against the example training data.
4.3 i-LIDS The Home Office Scientific Development Branch (HOSDB) in the UK has recently announced the project i-LIDS (Imagery Library for Intelligent Detection Systems) [24]. This is made up of three datasets: one public training dataset, available to all; one public test set; and one evaluation set which will be retained by the HOSDB for the systematic evaluation of intelligent surveillance systems. The scenarios included within i-LIDS are parked vehicle detection in no-parking or no-waiting areas, abandoned baggage detection in public transport areas, sterile zone monitoring detecting intruders in the perimeter boundaries of secure sites and doorway surveillance. Each dataset contains examples of both alarm and non-alarm sequences, determined by the operational requirements of the scenario. These datasets were made available alongside simple XML ground truth data in late 2006.
123
H. Dee, S. A. Velastin
4.4 ETISEO Project ETISEO3 [72] is a French Government funded project into the evaluation of surveillance applications. There are two aspects to the ETISEO project: one of which is to produce datasets for evaluation (in a similar way to the UK Home Office’s i-LIDS project) but also to develop metrics to measure performance on these (and other) datasets. Allied to these practical outputs, the project also aims to develop conceptual understanding of the domain through defining ontologies for surveillance: one associated with the video processing and interpretation (e.g., blob, trajectory); and one associated with the application domain (e.g., abandoned package). As with i-LIDS, the ETISEO video sequence database will be tripartite with training data (called work data by the ETISEO project), test data and evaluation data. The plan is to include a variety of application domains in their video sequence datasets, including airport apron, vehicular/ pedestrian traffic, interior corridor, small car-park, metro station…Many of these scenes are to be presented as multicamera datasets, some with more than one imaging modality (e.g. visible/infra-red).
4.5 Metrics for surveillance systems When determining the effectiveness of systems such as trackers, background models, and event detectors, different metrics are required. It is possible to convert tracker output into true/false (e.g. x% of bounding box overlap between “ground-truth” and “tracker” = true, otherwise false as in [41]), and even easier to convert the output of background subtraction routines to simple true/false output using perpixel measurements. However, more sophisticated measures are available, and we shall concentrate on these here. In 2003, Needham and Boyle [51] discuss the evaluation of positional trackers, suggesting trajectory comparison metrics such as mean-distance and area-between-trajectories and ways in which systematic error (such as time-shifting by a few frames, or slight camera miscalibration) can be corrected. Somewhat surprisingly, this is also the first paper we have found that touches upon the nature and reliability of ground truth for tracker evaluation: in Sect. 3.1 of the paper two hand marked up trajectories are compared and discovered to differ noticeably. The generation of accurate ground truth is considered in more detail by List et al. [41] in which three human annotators mark up the same sequence. Their performance is compared on positional criteria such as bounding box location, but also on semantic criteria as the ground truthing involved the labelling of behaviours as e.g. 3
Evaluation du Traitement et de l’Interpretation de Séquences vidEO.
How close are we to solving the problem of automated visual surveillance?
running or walking. Rather than calculate some continuous statistic to determine degree of agreement, the authors of [41] calculate the percentage of agreement between labellers for various degrees of concordance, such as the bounding boxes overlap by x% in y% of cases. What is clear from both of these papers is that agreement between humans is not guaranteed, even when considering such simple things as agent’s position. Whilst it is useful to consider and define metrics which provide some quantification of how well an agent has been tracked through a scene, it is also worth bearing in mind that we may not require a great deal of precision in a tracking application. If it turns out we can expect 95% concordance between human observers, it seems unreasonable to demand greater accuracy from computerised systems (especially if this accuracy is being measured against human-generated ground truth). This is, of course, not a valid argument against accurate measurement, and should instead be construed as an argument for accurate measurement with clearly defined tolerances. The metrics proposed by the ETISEO project are arranged hierarchically, and centre around the ideas used in confusion matrices and ROC curves – nearly all of the metrics are calculated from the number of true positives, false positives and false negatives. There are subtly different metrics defined for each of the different tasks (object detection, object classification, object tracking and event detection), with slightly different terminology. For example, with object detection the various categories are called Good Detections (true positives), False Detections (false positives), and Miss Detections (false negatives). Metrics proposed include the precision and sensitivity, using both object shape and bounding box size and location. With object classification, similar metrics are proposed, some allowing for the fact that an object may be misclassified at one level of description (e.g. a motorbike is not a car) but correctly classified at another (e.g. a motorbike is a vehicle). Metrics proposed for the evaluation of tracking systems take into account not just the overlap of bounding boxes (location in space) but also the problems of linking objects over frames to handle the well-documented tracking problems of splitting and merging. For event detection, the metrics are defined simply in terms of precision, sensitivity and specificity with qualifications and refinements to do with event timing and onset. Further details on these metrics, including definitions, are available from the ETISEO homepage (see [72]). The PETS metrics site [91] provides automatic evaluation of motion detection algorithms using metrics from the AVITRACK project, detailed in [1]. Four metrics have been implemented in the PETS metrics online evaluation site: – The Negative Rate metric is calculated as 1 2 (False negative rate + False positive rate);
339
– The Misclassification Penalty metric penalises misclassified pixels based upon their distance to the object boundary in the ground truth – The Rate of Misclassifications metric is very similar to the Misclassification Penalty metric, in that it relies upon distance from misclassified pixel to object boundary, however this metric is normalised by the number of misclassified pixels. – The Weighted Quality Measure metric is a measure of the spatial discrepancy between the ground truth and the motion segmentation, with pre-determined weights affecting the influence of false positive and false negative pixels. The weights used favour segmentation algorithms which result in larger foreground objects. With systems and algorithms presented as “interesting event” detectors, the problem of systematic evaluation is exacerbated. This is acknowledged by the authors of [78], who stated they were working on methods of evaluating the unusual event detection aspect of their work. There is great difficulty in obtaining footage of genuinely interesting events; muggings, robberies and the like are highly unlikely to occur in the university car parks and streets often used as training and test data at the exact time a vision researcher chooses to capture their hour or two of footage. Obtaining any volume of footage of such events is arguably impossible without a great deal of cooperation from real-world CCTV operations, and any datasets so obtained would have serious data protection and privacy implications. Hence evaluative techniques for such systems have, at their simplest, involved investigating the problematic cases by hand. This involves looking at the outliers and saying “Yes, that’s unusual” [37,78]. One such model, trained on pedestrians, had a major outlier which turned out to be a cyclist. The evidence this type of evaluation provides can only be anecdotal. It is also somewhat circular—if you look at the examples which do not fit the model, and find they are odd in some way, then of course they are interesting to you—they don’t fit your model of what is going on. The opposite situation, in which the dataset is examined and unusual events identified by the authors of the research alone (as in, for example [29]) suffers from analogous problems. Another means of evaluating such systems is through the use of “actors”. These people behave strangely in front of video cameras, and the system in question is evaluated on its ability to single out the sequences featuring these actors [37, 50]. For example, in [35] interesting behaviour was defined as rapid head movements and video produced specifically featuring just that behaviour and in [89] the interesting behaviour detected was people driving in circles or zig-zags in a car-park. If the decision of what constitutes unusual behaviour is left up to the actors, questions about their links to the software designers become paramount. The alternative case,
123
340
in which the actors are instructed by the system designer on the behaviour to exhibit would result in even worse science. In [14] a means of generating a form of ground truth for surveillance systems is described, relying upon a result from the psychological literature [83] showing that when trying to predict future behaviour from CCTV footage naïve observers perform as well as trained security guards. The authors then make the assumption that benchmarking against a number of humans is an improvement over relying on the author, actors, or serendipity to provide some measure of the interestingness or otherwise of the data set. The evaluative system involves showing the footage to a number of volunteers and asking them to rank the behaviour of each agent in the scene in question on the basis of how interesting a hypothetical security guard would find that particular behaviour pattern. The mean score from the human rankers is then assumed to provide a simple measure of “interestingness” for each agent’s trajectory, which can then be compared directly to the output of any machine-generated indication of typicality, and if a binary decision (interesting, or not) is required ROC curves can assist in the determination of a threshold. For a general measure of how well a computer-generated interestingness statistic performs, non-parametric correlation statistics such as Kendall’s Tau or Spearman’s Rho [71] can be used.
5 Conclusions This paper has presented an overview of behaviour analysis and event detection systems within computer vision for surveillance, with an emphasis upon the ways in which we can determine the robustness of the systems and upon the the interface between real-world surveillance installations and cutting-edge research. Given the large and expanding nature of this research area, we could not have reviewed everything in a single paper but we hope to have given an accurate picture of current state of the art in vision systems for surveillance. Significant progress has been achieved over the last decade in this field, particularly associated with the recognition that it is essential to have experimental methodologies demonstrating the characteristics and limitations of a given proposed solution. In this sense, the field is maturing quickly and catching up with conventional engineering and other scientific disciplines. This is something that cannot be ignored given the immediate applicability of this area, and we argue that the accurate characterisation of performance will assist greatly in this aim. If we as a research community can produce algorithms that are able to determine when they are “out of their depth”, we will have got a step closer to producing systems that are robust in a variety of input conditions. Progress can be measured by seeing that some of the solutions proposed by researchers find applicability and
123
H. Dee, S. A. Velastin
indeed become almost transparent in the real world. There have been some major successes, mainly at the level of signal processing. Automated number plate recognition (ANPR) and vehicular traffic monitoring are perhaps the main two success stories, in which mature technologies have been implemented in real-world settings. On the other hand, much remains to be done in the area of behaviour analysis and modelling, building systems that could make sense of human behaviour especially in unstructured or changing environments such as public places. We are beginning to see possible applications in systems that can detect pre-programmed events such as overcrowding, intrusion, and abandoned packages. These systems do not require a deep understanding of behaviour and successfully exploit constraints (provided, for example, by structured environments and fixed cameras). Further progress is required in providing understanding at a more cognitive level of processing, perhaps even emulating the processes carried out by human surveillance operatives. We should accept that there is a case for developing systems that acquire knowledge over a long period of time and also accept that a certain amount of bootstrapping, or at least supervised learning (as humans do) may be required. To expect otherwise seems unnecessarily unrealistic. We need to be able to represent and process visual information in a manner that recognises the stochastic nature of data: reasoning with uncertainty is likely to be a central feature of any successful higher level behaviour analysis system. It could also prove necessary to produce easily comprehensible output, as any system designed to integrate within an existing CCTV control room environment will need to be accepted and understood by the operatives. As a human computer interaction problem, this has not received a great deal of attention to date; but the problem is not just one of interface design but also of information design. Any system performing (for example) behaviour summarisation will need to be able to produce results in a form that makes sense to those unfamiliar with computer vision. To this end, recent developments aiming to define ontologies for computer vision [16, for example] are a move to be encouraged. Acknowledgments This work was carried out under funding from The EPSRC REASON Project.
References 1. Aguilera, J., Wildenauer, H., Kampel, M., Borg, M., Thirde, D., Ferryman, J.: Evaluation of motion segmentation quality for aircraft activity surveillance. In: Joint IEEE International Workshop on Visual Surveillance and Performance Evaluation of Tracking and Surveillance (VS-PETS 2005), pp. 293–300. Beijing, China (2005) 2. Aoki, M.: Imaging and analysis of traffic scene. In: IEEE International Conference on Image Processing, vol.4, pp. 1–5. Kobe, Japan (1999)
How close are we to solving the problem of automated visual surveillance? 3. Armitage, R.: To CCTV or not to CCTV? A review of current research in the effectiveness of CCTV systems in reducing crime. NACRO, London (2002) 4. Baumberg, A., Hogg, D.C.: Learning spatiotemporal models from examples. Image Vis. Comput. 14(8), 525–532 (1996) 5. BBC news online. CCTV voyeurism story. 2005. http://www.news. bbc.co.uk/1/hi/england/merseyside/4521342.stm 6. Black, J., Velastin, S., Boghossian, B.: A real-time surveillance system for metropolitan railways. In: Proceedings of. International Conference on Advanced Video and Signal Based Surveillance (AVSS), pp. 189–194. Como, Italy (2005) 7. Boiman, O., Irani, M.: Detecting irregularities in images and in video. In: Proceedings of International Conference on Computer Vision (ICCV). Beijing, China (2005) 8. Brand, M., Kettnaker, V.: Discovery and segmentation of activities in video. IEEE Trans. Pattern Anal. Mach. Intell. (PAMI) 22(8), 747–757 (2000) 9. Brand, M., Oliver, N., Pentland, A.: Coupled hidden markov models for complex action recognition. In: Proceedings of Computer Vision and Pattern Recognition (CVPR), pp. 994–999 (1997) 10. Brémond, F., Thonnat, M., Zuniga, M.: Video understanding framework for automatic behavior recognition. Behav. Res. Meth. (in print) (2006) 11. Buxton, H.: Learning and understanding dynamic scene activity: a review. Image Vis. Comput. 21(1), 125–136 (2003) 12. Buxton, H., Gong, S.: Visual surveillance in a dynamic and uncertain world. Artif. Intell. 78(1–2), 431–459 (1995) 13. Dee, H.M., Hogg, D.C.: Detecting inexplicable behaviour. In: Proceedings of British Machine Vision Conference (BMVC). Kingston-on-Thames, UK (2004) 14. Dee, H.M., Hogg, D.C.: Is it interesting? comparing human and machine judgements on the PETS dataset. In: ECCV-PETS: the Performance Evaluation of Tracking and Surveillance workshop at the European Conference on Computer Vision. Prague, Czech Republic (2004) 15. Ditton, J., Short, E.: Evaluating Scotland’s first town centre CCTV scheme. In: Norris, C., Moran, J., Armstrong, G. (eds.) Surveillance, closed circuit television and social control, pp. 155–173. Ashgate, Aldershot (1998) 16. François, A.R.J., Nevatia, R., Hobbs, J., Bolles, R.C.: VERL: an ontology for representing and annotating video events. IEEE Multimed. Mag. 12(4), 76–86 (2005) 17. Galata, A., Cohn, A.G., Magee, D.R., Hogg, D.C.: Modeling interaction using learnt qualitative spatio-temporal relations and variable length Markov models. In: Proceedings of European Conference on Artificial Intelligence (ECAI), pp. 741–745. Lyon, France (2002) 18. Gong, S., Xiang, T.: Recognition of group activities using dynamic probablistic networks. In: Proceedings of International Conference on Computer Vision (ICCV), pp. 742–749. Nice, France (2003) 19. Graves, A., Gong, S.: Wavelet based holistic sequence descriptor for generating video summaries. In: Proceeedings of British Machine Vision Conference (BMVC), pp. 167–176. Kingston, UK (2004) 20. Greenhill, D., Renno, J., Orwell, J., Jones, G.A.: Occlusion analysis: learning and utilising depth maps in object tracking. In: Proceedings of British Machine Vision Conference (BMVC), pp. 467–476. Kingston, UK (2004) 21. Grimson, W.E.L., Stauffer, C., Romano, R., Lee, L.: Using adaptive tracking to classify and monitor activities in a site. In: Proceedings of Computer Vision and Pattern Recognition (CVPR), pp. 246– 252. Santa Barbara, CA (1998) 22. Hampel, F.: Robust statistics: a brief introduction and overview. In: Seminar für Statistik, Eidgenössische Technische Hochschule. Zürich, Switzerland (2001)
341 23. Hockaday, S.: Evaluation of image processing technology for applications in highway operations. Technical Report Final Report TR91-2, Transportation Research Group, California Polytechnic State University, San Luis Obispo, California (1991) 24. Home Office Scientific Development Branch. Evaluating ‘intelligent’ CCTV—i-LIDS: imagery library for intelligent detection systems 2005. http://www.scienceandresearch.homeoffice.gov.uk/ hosdb/news-events/270405 25. Hongeng, S., Nevatia, R.: Multi-agent event recognition. In: Proceedings of International Conference on Computer Vision (ICCV), pp. 84–91. Vancouver, Canada (2001) 26. Howarth, R.J., Buxton, H.: Conceptual descriptions from monitoring and watching image sequences. Image Vis. Comput. 18, 105–135 (2000) 27. Hu, W., Tan, T., Wang, L., Maybank, S.: A survey on visual surveillance of object motion and behaviours. IEEE Tran. Syst. Man and Cybern. 34(3), 334–352 (2004) 28. Huang, T., Russell, S.: Object identification in a Bayesian context. In: Proceedings of International Joint Conference on Artificial Intelligence(IJCAI), pp. 1276–1283. Nagoya, Japan (1997) 29. Hung, H., Gong, S.: Detecting and quantifying unusual interactions by correlating salient action. In: Proceedings of International Conference on Advanced Video and Signal Based Surveillance (AVSS), pp. 46–51. Como, Italy (2005) 30. Institute of Electrical and Electronics Engineers: IEEE standard computer dictionary: a compilation of IEEE standard computer glossaries. IEEE, New York (1990) 31. Intille, S.S., Bobick, A.F.: Recognising planned, multiperson action. Comput. Vis. Image Underst. (CVIU) 81, 414–445 (2001) 32. Isard, M., Blake, A.: A mixed-state CONDENSATION tracker with automatic model-switching. In: Proceedings of International Conference on Computer Vision (ICCV), pp. 107–112. Bombay, India (1998) 33. Isard, M., MacCormick, J.: BraMBLe: a Bayesian multiple-blob tracker. In: Proceedings of International Conference on Computer Vision (ICCV), pp. 34–41. Vancouver, Canada (2001) 34. Ivanov, Y.A., Bobick, A.F.: Recognition of visual activities and interactions by stochastic parsing. IEEE Trans. Pattern Anal. Mach. Intell. (PAMI) 22(8), 852–872 (2000) 35. Jan, T., Piccardi, M., Hintz, T.: Detection of suspicious pedestrian behavior using modified probabilistic neural network. In: Proceedings of Image and Vision Computing, pp. 237–241. Auckland, New Zealand, 2002 36. Johnson, N., Galata, A., Hogg, D.C.: The acquisition and use of interaction behaviour models. In: Proceedings of Computer Vision and Pattern Recognition (CVPR), pp. 866–871. Santa Barbara, CA (1998) 37. Johnson, N., Hogg, D.C.: Learning the distribution of object tractories for event recognition. Image Vis. Comput. 14(8), 609–615 (1996) 38. Kalman, R.: A new approach to linear filtering and prediction problems. Trans. ASME J. Basic Eng. 82, 35–45 (1960) 39. Kingston University, Mott MacDonald and Ipsotek Limited: Maximising benefits from CCTV on the railway—existing systems. Technical report, Rail Safety and Standards Board (2003) 40. Liberty CCTV, 2005. http://www.liberty-human-rights.org.uk/ privacy/cctv.shtml 41. List, T., Bins, J., Vazquez, J., Fisher, R.B.: Performance evaluating the evaluator. In: Joint IEEE International Workshop on Visual Surveillance and Performance Evaluation of Tracking and Surveillance (VS-PETS 2005). Beijing, China (2005) 42. Magee, D.R., Boyle, R.D.: Detecting lameness using ‘re-sampling condensation’ and ‘multi-stream cyclic Hidden Markov models’. Image Vis. Comput. 20(8), 581–594 (2002)
123
342 43. Makris, D., Ellis, T.: Learning semantic scene models from observing activity in visual surveillance. IEEE Trans. Syst. Man Cybern. 35(3), 397–408 (2005) 44. Makris, D., Ellis, T.J.: Path detection in video surveillance. Image Vis Comput 20(12), 895–903 (2002) 45. McCahill, M., Norris, C.: CCTV in Britain. In: On the threshold to Urban Panopticon?: Analysing the Employment of CCTV in European Cities and Assessing its Social and Political Impacts. Technical University Berlin (2003) 46. McCahill, M., Norris, C.: CCTV systems in London: their structures and practices. In: On the threshold to Urban Panopticon?: Analysing the Employment of CCTV in European Cities and Assessing its Social and Political Impacts. Technical University Berlin (2003) 47. McKenna, S.J., Nait Charif, H.: Summarising contextual activity and detecting unusual inactivity in a supportive home environment. Pattern Anal. Appl. 7(4), 386–401 (2004) 48. Medioni, G., Cohen, I., Brémond, F., Hongeng, S., Nevatia, R.: Event detection and analysis from video streams. IEEE Trans. Pattern Anal. Mach. Intell. (PAMI) 23(8), 873–889 (2001) 49. Meer, P.: Robust techniques for computer vision. In: Medioni, G., Kang, S.B. (ed.) Emerging topics in computer vision pp. 107–190. Prentice Hall, Englewood cliffs (2004) 50. Morris, R.J., Hogg, D.C.: Statistical models of object interaction. Int. J. Comput. Vis. 37(2), 209–215 (2000) 51. Needham, C.J., Boyle, R.D.: Performance evaluation metrics and statistics for postitional tracker evaluation. In: Proceedings of International Conference on Computer Vision Systems, pp. 278–289. Austria (2003) 52. Norris, C., Armstrong, C.: The Maximum Surveillance Society. Berg, Oxford (1999) 53. Norris, C., McCahill, M., Wood, D.: Editorial: the growth of CCTV: a global perspective on the international diffusion of video surveillance in publicly accessible space. Surveill. Soc. 2(2/3), 110–135 (2004) 54. Oliver, N., Rosario, B., Pentland, A.: Statistical modeling of human interactions. In: Proceedings of IEEE CVPR Workshop on the Interpretation of Visual Motion, pp. 39–46. Santa Barbara, CA (1998) 55. Oliver, N.M., Rosario, B., Pentland, A.P.: A Bayesian computer system for modeling human interactions. IEEE Trans. Pattern Anal. Mach. Intell. (PAMI) 22(8), 831–843 (2000) 56. Pasula, H., Russell, S., Ostland, M., Ritov, Y.: Tracking many objects with many sensors. In: Proceedings of International Joint Conference on Artificial Intelligence(IJCAI), pp. 1160–1171. Stockholm, Sweden (1999) 57. Remagnino, P., Baumberg, A., Grove, T., Hogg, D.C., Tan, T., Worrall, A., Baker, K.: An integrated traffic and pedestrian modelbased vision system. In: Proceedings of British Machine Vision Conference (BMVC), pp. 380–389. Essex, UK (1997) 58. Remagnino, P., Tan, T., Baker, K.: Agent orientated annotation in model based visual surveillance. In: Proceedings of International Conference on Computer Vision (ICCV), pp. 857–862. Bombay, India (1998) 59. Remagnino, P., Tan, T., Baker, K.: Multi-agent visual surveillance of dynamic scenes. Image Vis. Comput. 16, 529–532 (1998) 60. Robertson, N., Reid, I.: Behaviour understanding in video: a combined method. In: Proceedings of International Conference on Computer Vision (ICCV). Beijing, China (2005) 61. Rowe, N.C.: Detecting suspicious behaviour from positional information. In: Modelling Others from Observations Workshop at IJCAI. Edinburgh, Scotland (2005) 62. Sacks, H.: Notes on police assessment of moral character. In: Sudnow, D. (ed.) Studies in social interaction, pp. 280–293. Free Press, New York (1972)
123
H. Dee, S. A. Velastin 63. Sage, K.H., Buxton, H.: Joint spatial and temporal structure learning for task based control. In: Proceedings of International Conference on Pattern Recognition (ICPR), pp. 48–51. Cambridge, UK (2004) 64. Schwerdt, K., Maman, D., Bernas, P., Paul, E.: Target segmentation and event detection at video-rate: the eagle project. In: Proceedings of International Conference on Advanced Video and Signal Based Surveillance (AVSS), pp. 183–188. Como, Italy (2005) 65. Scödl, A., Essa, I.: Depth layers from occlusions. In: Proceedings of Computer Vision and Pattern Recognition (CVPR), pp. 339– 644. Kawai, Hawaii (2001) 66. Senior, A.: Tracking people with probabilistic appearance models. In: IEEE workshop on Performance Evaluation of Tracking and Surveillance, pp. 48–55. Copenhagen, Denmark (2002) 67. Seyve, C.: Metro railway security algorithms with real world experience adapted to the RATP dataset. In: Proceedings of International Conference on Advanced Video and Signal Based Surveillance (AVSS), pp. 177–182. Como, Italy (2005) 68. Sherrah, J., Gong, S.: Automated detection of localised visual events over varying temporal scales. In: Proceedings of European Workshop on Advanced Video-based Surveillance Systems, pp. 215–227. Kingston, UK (2001) 69. Sherrah, J., Gong, S.: Continuous global evidence-based Bayesian modality fusion for simultaneous tracking of multiple objects. In: Proceedings of International Conference on Computer Vision (ICCV), pp. 42–49. Vancouver, Canada (2001) 70. Siebel, N.T., Maybank, S.: The advisor visual surveillance system. In: Proceedings of the ECCV 2004 workshop Applications of Computer Vision (ACV’04), pp. 103–111. Prague, Czech Republic (2004) 71. Siegal, S., Castellan, N.J.: Nonparametric statistics for the behavioral sciences, 2nd edn. McGraw Hill, Singapore (1988) 72. Silogic: Evaluation du traitement et de l’interpretation de séquences video (ETISEO: Evaluation for video understanding). Introduction to evaluation and metrics, 2005. Available from http://www.silogic.fr/etiseo/bibliothequeDocuments00010058. html 73. Skinns, D.: Crime reduction, diffusion and displacement: evaluating the effectiveness of CCTV. In: Norris, C., Moran, J., Armstrong, G. (eds.) Surveillance, closed circuit television and social control, pp. 175–188. Ashgate, Aldershot (1988) 74. Smith, G.J.D.: Behind the screens: examining constructions of deviance and informal practices among CCTV control room operators in the UK. Surveil Soc. 2(2/3), 376–395 (2004) 75. Spirito, M., Regazzoni, C.S., Marcenaro, L.: Automatic detection of dangerous events for underground surveillance. In: Proceedings of International Conference on Advanced Video and Signal Based Surveillance (AVSS), pp. 195–200. Como, Italy (2005) 76. Stauffer, C.: Automatic hierarchical classification using time-based co-occurrences. In: Proceedings of. Computer Vision and Pattern Recognition (CVPR), pp. 333–339. Ft. Collins, CO (1999) 77. Stauffer, C.: Estimating tracking sources and sinks. In: Proceedings of 2nd IEEE workshop on event mining, pp. 259–266. Madison, WI (2003) 78. Stauffer, C., Grimson, E.: Learning patterns of activity using real-time tracking. IEEE Trans. Pattern Anal. Mach. Intell. (PAMI) 22(8), 747–757 (2000) 79. Stauffer, C., Grimson, W.: Adaptive background mixture models for real-time tracking. In: Proceedings of Computer Vision and Pattern Recognition (CVPR), pp. 246–252. Fort Collins, CO (1999) 80. Sumpter, N., Bulpitt, A.: Learning spatio-temporal patterns for predicting object behaviour. Image Vis. Comput. 18(9), 697– 704 (1999) 81. Svensson, M.S., Heath, C., Luff, P.: Monitoring practice: event detection and system design. In: Velastin, S.A., Remagnino, P.
How close are we to solving the problem of automated visual surveillance?
82.
83.
84.
85.
86.
87.
88. 89.
90.
91.
92.
93.
(eds.) Intelligent Distributed Surveillance Systems. The Institution of Electrical Engineers (IEE) (2005) Tilley, N.: Evaluating the effectiveness of CCTV schemes. In: Norris, C., Moran, J., Armstrong, G. (eds.), Surveillance, closed circuit television and social control, pp. 139–153. Ashgate, Aldershot (1998) Troscianko, T., Holmes, A., Stillman, J., Mirmehdi, M., Wright, D., Wilson, A.: What happens next? the predictability of natural behaviour viewed through CCTV cameras. Perception 33(1), 87–101 (2004) Velastin, S.A., Boghossian, B.A., Lo, B.P.L., Sun, J., Vicencio-Silva, M.A.: PRISMATICA: toward ambient intelligence in public transport environments. IEEE Trans. Syst. Man Cybern. Part A 35(1), 164–182 (2005) Viola, P., Jones, M.J., Snow, D.: Detecting pedestrians using patterns of motion and appearance. In: Proceedings of International Conference on Computer Vision (ICCV), pp. 734–741. Nice, France (2003) Vogler, C., Metaxas, D.: A framework for recognising the simultaneous aspects of american sign language. Comput. Vis. Image Underst. (CVIU) 81, 358–384 (2001) Wallace, E., Diffley, C.: CCTV control room ergonomics. Technical Report 14/98, Police Scientific Development Branch (PSDB), UK Home Office (1988) Wallace, R.: Finding natural clusters through entropy minimization. Ph.D. Thesis, CMU (1989) Wu, G., Wu, Y., Jiao, L., Wang, Y., Chang, E.: Multicamera spatiotemporal fusion and biased sequence-data learning for security surveillance. In: Proceedings. of ACM International Conference on Multimedia, November 2003., pp. 528–538. Berkeley, CA (2003) Xu, M., Ellis, T.: Partial observation vs. blind tracking through occlusion. In: Proceedings of British Machine Vision Conference (BMVC), pp. 777–786. Cardiff, UK (2002) Young, D.P., Ferryman, J.M.: PETS metrics on-line performance evaluation service. In: Joint IEEE International Workshop on Visual Surveillance and Performance Evaluation of Tracking and Surveillance (VS-PETS 2005). Beijing, China (2005) Zhong, H., Shi, J., Visontai, M.: Detecting unusual activity in video. In: Proceedings of Computer Vision and Pattern Recognition (CVPR), p. 819826. Washington, DC (2004) Zilani, F., Velastin, S., Porikli, F., Marcenaro, L., Kelliher, T., Cavallaro, A., Bruneaut, P.: Performance evaluation of event detection solutions: the CREDS experience. In: Proceedings of International Conference on Advanced Video and Signal Based Surveillance (AVSS), pp. 201–206. Como, Italy (2005)
343
Author biographies Hannah M. Dee is a Research Fellow at the University of Leeds on the UK EPSRC funded project LAVID, investigating cognitive computer vision systems. She received her Ph.D. in Computing in 2005, her MA in Philosophy in 1998 and her BSc in Cognitive Science in 1996, all from the University of Leeds. Her interests include cognitive systems, issues concerning levels of organisation and representation, visual surveillance, and machine learning. Hannah is a member of the British Machine Vision Association and the British Computer Society.
Sergio A. Velastin received the B.Sc. degree in Electronics, M.Sc. (Research) degree in Digital Image Processing and the Ph.D. from the University of Manchester Institute of Science and Technology (UMIST) in the UK, in 1978, 1979 and 1982 respectively. Currently he is a Reader (Associate Professor) at the Digital Imaging Research Centre, Faculty of Computing, Information Systems and Mathematics, Kingston University, UK. He has participated in a number of visual surveillance projects both nationally and within the European Union. His current research interests include computer vision for pedestrian monitoring and personal security as well as real-time distributed visual surveillance systems. Dr Velastin is a member of the IEEE and the British Machine Vision Association (BMVA).
123