This also helps the firm attract and retain customers. ... into understanding knowledge management system requirements. .... base of clients, a best-practices database, a catalog of Web ..... encing Agent for Desk Support,â Bringing. Knowledge ...
K n o w l e d g e
M a n a g e m e n t
How Knowledge Reuse Informs Effective System Design and Implementation Daniel E. O’Leary, University of Southern California
T
he “Big 5” professional service firms include Arthur Andersen, Deloitte & Touche, Ernst & Young, KPMG Peat Marwick, and PriceWaterhouseCoopers. Knowl-
edge management is important to such a firm’s success. Allen Frank, former chief technology officer at KPMG, noted, “We’re basically a giant brain. For us the knowledge
The author analyzes knowledge reuse in a Big 5 professional service firm. He investigates how reuse affects design, provides a methodology for evaluating systems to increase reuse, and discusses the impact of differential costs and benefits on the organization.
44
management system is the core system to achieve competitive advantage.”1 Similarly, Ellen Knapp, former vice chairman of Coopers & Lybrand, commented, “All of our assets are knowledge assets.”1 For a professional service firm, maximizing access to knowledge across the organization can increase productivity and profitability. It can also help attract and retain top talent. Decreasing the strain on valuable employees and ramping new employees up to speed quickly builds more knowledge and increases capability. This also helps the firm attract and retain customers. For these reasons and more, Big 5 professional service firms have spent substantial effort trying to package, use, and reuse knowledge.2 Using data from a Big 5 professional service firm, this article investigates the extent to which people reuse knowledge to solve decision problems. This research shows that the extent of knowledge reuse within a period and over time can provide insight into understanding knowledge management system requirements. Analysis of knowledge use from different service areas provides insight into differences in requirements and in predicting resource needs from one practice area to another. For organizations such as professional service firms, this can mean that knowledge management systems will vary along major service lines, resulting in differential resource costs and benefits. Since costs are typically shared among partners (the “owner-managers” of professional service firms), knowledge management systems can cause controversy within the organization as well. 1094-7167/01/$10.00 © 2001 IEEE
Knowledge management and reuse Knowledge management facilitates the capture, deployment, access, and reuse of information and knowledge—typically using contemporary technology. As Roger Siboni noted in a presentation at Dataquest in 1997, knowledge management in professional service firms provides access to knowledge in knowledge bases (ranging from different magazines and newspapers to specific knowledge bases with employee information such as continuing education activity). These bases store and disseminate knowledge in a number of ways but typically use World Wide Web technologies. Knowledge management systems require a broad range of resources. For example, resources include people to support the system, knowledge resources (for instance, knowledge bases), hardware requirements, and networking requirements. Therefore, an important issue of knowledge management is having sufficient resources available to meet the requirements placed upon the system. Professional services firms, like most other firms, focus on building knowledge management systems to provide explicit knowledge. According to David Snowden, explicit knowledge “is reusable in a consistent and repeatable manner. It may be stored … in a computer system. The documented procedure of a lessons-learnt workshop, the write-up comments of an economist examining a set of financial data … all of these are explicit knowledge that we use to support or make decisions and exercise judgment.”3 Explicit knowledge is in contrast to tacit knowledge. IEEE INTELLIGENT SYSTEMS
Frequent vs. infrequent reuse A system designed to facilitate frequent knowledge reuse will likely differ substantially from one designed to facilitate infrequent knowledge reuse, both in its design and use. A knowledge management system that facilitates frequent reuse will likely integrate tightly with business processes. For example, Andreas Abecker and his colleagues used invoices (transaction-based document information), organizational-hierarchy information, and other resources to develop a system to support a virtual office and the corresponding large number of transactions that would take place.4 Ulrich Reimer and his colleagues built a system that supports office work and is integrated with business processes at a large insurance company.5 HansPeter Schnurr and Steffen Staab built a system that uses intelligent agents to facilitate frequent project management tasks such as finding competent, available, and interested personnel for a project.6 For effective knowledge reuse, requirements must be isolated and integrated into the process. Specifically identifying needs enables the acquisition of appropriate knowledge and its integration with existing knowledge. Furthermore, embedding specific links with other knowledge into the knowledge management system ensures that people access the requisite knowledge effectively and efficiently. As a result, when a knowledge management system is built for frequent knowledge reuse (as compared to single or few uses), predicting what knowledge resources are needed and what new knowledge resources must be acquired is easier. When knowledge is reused frequently, knowledge management is facilitated because other knowledge management system needs (for example, hardware and bandwidth requirements) also can JANUARY/FEBRUARY 2001
become more predictable. This approach enables a clear understanding of the specific knowledge bases used, the number of people using them, and the frequency and extent of use. Alternatively, a system designed for infrequent use of knowledge sources will likely be relatively independent of any specific business processes. Instead, the design will facilitate browsing. Because knowledge sources will be only infrequently used, understanding and predicting what knowledge resources to include will be much more difficult. Therefore, such a system will likely have a broader range of resources available so that people can find previously unspecified knowledge that could be helpful. Also,
Embedding specific links with other knowledge into the knowledge management system ensures that people access the requisite knowledge effectively and efficiently. predefining links between resources when reuse is infrequent is more difficult. Frequent reuse generally guides the development of those links. If reuse is limited, then there is no a priori structure to guide the choice of links built into the system. As a result, with little or no knowledge reuse, predicting other overall knowledge management system requirements (such as hardware and bandwidth) is more difficult. A framework for analyzing use and reuse Knowledge reuse occurs on either an intraperiod or interperiod basis. For intraperiod reuse—on a given day, week or month—we might employ specific knowledge multiple times to solve a problem. For example, in a Web environment, Web links that have been used typically change color for a period. Similarly, for interperiod use, we might use the same knowledge repeatedly across multiple time periods. Figure 1 summarizes this intraperiod and interperiod structure. computer.org/intelligent
Intraperiod knowledge reuse Low High
Snowden defines tacit knowledge “as something we simply know, possibly without the ability to explain. … Human beings are the storage medium of tacit knowledge.”3 Generally, tacit knowledge transfer is limited to educational programs and the apprenticeship structure of most projects, where participants learn from each other. So inevitably, from a systems perspective, the knowledge management system’s focus is on explicit, rather than tacit, knowledge. Accordingly, this article focuses on explicit knowledge and the extent of its reuse.
Much reuse
Little reuse
Low High Interperiod knowledge reuse Figure 1. Knowledge reuse properties. Measures from each axis provide insight regarding knowledge reuse in professional service firms.
Knowledge management system data I base the analysis of knowledge reuse on data from a monthly usage statistics report prepared by the Big 5 professional service firm. The report contains information about the current month (January unique accesses and total accesses), the previous month (December total accesses), and the previous quarter (1 October through 31 December unique accesses and total accesses). Although the data is limited, it is real and allows analysis of knowledge management database use in the Big 5. Because the Big 5 firms are considered homogeneous, the results generalize within the professional service industry. Within the data, total number of accesses refers to the number of times users have gone to a knowledge resource. This measure drives the computing and bandwidth resource needs. Unique accesses eliminate duplicate accesses by the same users. So, unique accesses are always fewer than or equal to the total number of accesses. This knowledge management system incorporates usage statistics for a number of different databases, including these: • Lotus Notes includes a range of applications constructed before the Web-based applications. The Lotus Notes applications include a Goldman Sachs database, a database of clients, a best-practices database, a catalog of Web resources, a database entitled “technology tips,” and other databases. • Outside databases include resources such as Barron’s, Fortune, the Gartner Group, the Harvard Business Review, Internet Week, PC Week, and Wall Street Journal–Dow Jones. • Practice-specific (audit, consulting, and tax) databases include custom-built 45
K n o w l e d g e
M a n a g e m e n t
The Big 5 and Knowledge Reuse across Service Lines
Sections of the usage report are defined by service line: assurance (audit), tax, or consulting (see the sidebar, “The Big 5 and Knowledge Reuse across Service Lines”). So, when discussing the data, I refer to these product lines. However, the usage report provides no analysis as to what the access numbers mean or imply. As a result, the analysis and implications in this article are solely my work.
Measures used in this study This research employs two measures to analyze the data. First, I use the (auto) correlation coefficient to study the interperiod time relationships. This statistical measure is well known. (It illustrates the linearity of the relationship between two variables x and y. The value ranges from +1 to –1. A +1 value indicates a perfect linear relationship between the two variables, with y increasing as x increases. A –1 value also indicates a perfect linear relationship, but y decreases as x increases. I computed the correlation coefficients using Correlation in Excel.) In this research, the correlation coefficient relates database accesses in January to December and January to the previous quarter (October–December). The correlation measures association, relating the use of knowledge between periods. Statistically, the closer the correlation’s absolute value is to 46
one, the more useful it is to consider the earlier time period data when establishing an expected value of the later time period. Second, I use the ratio of total accesses to unique accesses to study intraperiod time relationships. It measures the relative uniqueness of a set of inquiries during a period. As this ratio decreases toward one, • the information being accessed is used with little repetition, • each inquiry approaches becoming unique, and • information use is close to a “one-off.” A ratio close to one can indicate that the use is primarily for solving single-use problems and that the information is not for repetitive production purposes. It also likely indicates Intraperiod knowledge reuse (Ratio of total time to unique accesses) Low High
qualification databases, tool kits, and document repositories. For example, the tax practice databases pertain more to tax developments, such as court petitions and complaints, state tax notes, and tax notes.
Consulting varies from engagement to engagement. Similarities across consulting assignments include activities such as the development and implementation of systems for knowledge management, enterprise resource planning, and electronic commerce. Although some tasks couched as consulting are more repetitive than others, consulting generally has substantially less repetition than audit or tax, based on the number of clients that employ each service. Also, although a firm might perform the same service for multiple organizations, multiple differences among and within client organizations typically make consulting engagements different in each. Knowledge management for consulting requires a broad range of materials—and some will receive only occasional use. For organizations such as professional service firms, this means that knowledge management systems will vary along major service lines. This can cause stress for these firms (see the other sidebar).
(a)
Low
High
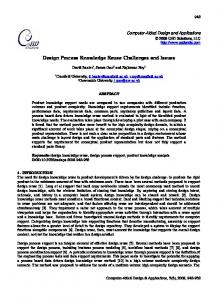
that the information source is only lightly, if at all, embedded into work processes. As the ratio increases away from one, • the information being accessed is receiving increasing, repetitive use, • the inquiry’s uniqueness decreases, and • information use is not a one-off; instead, it is “intensive.” A large ratio can indicate multiple use, where the information or knowledge source is integrated into particular work processes. The two measures provide a basis for understanding knowledge reuse. The correlation coefficient measures reuse between the data over different time periods. The ratio of total to unique accesses measures data reuse in a single period. Figure 2a illustrates these relationships. Intraperiod knowledge reuse (Ratio of total time to unique accesses) Low High
The Big 5 professional service firms constantly strive to develop new service lines but primarily are active in three: audit (assurance), tax, and consulting. The use of knowledge resources across these service lines varies. Audit concerns the objective review and analysis of financial statements for external consumption (for example, annual reports) and results in a published opinion regarding those statements. Virtually the same audit approach applies to all clients. Substantial knowledge resources support audits, including checklists (designed both to ensure that a complete approach is taken and to focus attention on critical issues) and authoritative pronouncements (to guide auditors). Tax deals with planning (planning decision making designed to minimize taxes) and compliance (filing tax forms). Much tax work requires reviewing tax law and forms, and then rereviewing the same tax law in future periods. Knowledge management for tax work generally means making a wide range of tax law materials and forms readily available for use and reuse.
Interperiod knowledge reuse (Correlation of knowledge use over time) (b)
Tax
Audit Consulting
Low
High
Interperiod knowledge reuse (Correlation of knowledge use over time)
Figure 2. Knowledge reuse properties: (a) operationalization; (b) empirical findings. Each service line has a different “empirical footprint.” computer.org/intelligent
IEEE INTELLIGENT SYSTEMS
Table 1. Autocorrelations of unique and total accesses over time. The numbers in parentheses are the level of significance in a test of difference of correlation from 0. Practice databases
Findings For the tax service line, findings indicate substantial interperiod and intraperiod reuse. Audit’s interperiod reuse is similar to that for tax but has less intraperiod reuse. Consulting has little intraperiod knowledge reuse and less interperiod reuse than either audit or tax. So, knowledge management requirements for audit and tax are much more predictable than those for consulting, where knowledge reuse might be infrequent. Systems for audit and tax must focus on frequent reuse, while those for consulting need to facilitate single or infrequent knowledge use. Figure 2b roughly summarizes the findings. Measured by correlation across time periods and the ratio of general to unique accesses, audit, consulting, and tax knowledge uses each have different profiles or “empirical footprints” illustrating system use. Interperiod reuse Table 1 gives the correlation between the current month (Jan.) and previous month (Dec.), and Jan. and the previous quarter (Oct.–Dec.), for total and unique accesses. The unique accesses are highly correlated for January and October–December, with a correlation of .898 or higher in two of three categories and greater than .700 in all three categories. Each correlation is significantly different from zero. The total access data is highly correlated for January and December, and January and October–December. Each correlation is significantly different from zero. In particular, total accesses, which drive equipment and bandwidth needs, had correlation coefficients of .91 or better in two of three databases. Unfortunately, neither the Lotus Notes databases nor the outside databases contain detailed practice (audit, tax, and consulting) information. However, in the practice databases, the correlation for each consulting access (.703, .577, and .484) is lower than that for the audit accesses (.913, .989, and .917) or tax accesses (.898, .998, and .977). In particular, • for January and October–December unique accesses, the correlations for both audit and tax are statistically significantly different from the correlation for consulting, at the .05 level; • for January and December total accesses, the correlations for both audit and tax are statistically significantly different from the correlation for consulting, at the .0001 level; and JANUARY/FEBRUARY 2001
Audit Consulting Tax
Unique accesses Jan. and Oct.–Dec. .913 (.0001) .703 (.01) .898 (.0001)
Total accesses Jan. and Dec. .989 (.0001) .577 (.05) .998 (.0001)
Total accesses Knowledge Jan. and Oct.–Dec. sources .917 (.0001) .484 (.10) .977 (.0001)
11 10 11
Table 2. The ratio of total to unique accesses in a single period. Practice databases
Jan.
Oct.–Dec.
Knowledge sources
Audit Consulting Tax
3.00 2.17 5.90
7.03 3.65 18.92
11 10 11
• for January and October–December total accesses, the correlations for both audit and tax are statistically significantly different from the correlation for consulting, at the .0001 level.
Location on the grid
This suggests that consulting accesses are different from auditing or tax accesses, and knowledge management’s role in work processes varies. This is consistent with our a priori knowledge of audit, consulting, and tax, because audit and tax are stable over time but consulting changes to meet a constantly changing set of client needs.
What causes a grid location? Why does one service line appear in one portion of the grid, while another appears in a different part of the grid? What causes the location? At least three views exist:
Intraperiod reuse Table 2 summarizes the ratio of total accesses to unique accesses. In the practice databases, consulting (2.17, 3.65), audit (3.00, 7.03), and tax (5.90, 18.92) differ significantly. Because consulting projects will likely involve single or infrequent use, consulting has a lower ratio than audit or tax. So, we conducted a test of difference of means, with known variance, assuming a normal distribution. In particular • for January, the mean ratio of accesses to unique accesses for tax was statistically significantly different from that for both audit (.025) and consulting (.0001); and • for October–December, the mean ratio of access to unique accesses for tax was statistically significantly different from that for both audit (.01) and consulting (.0001). Also, audit was statistically significantly different from consulting (.10). These differences suggest that some work processes are more standard (audit and tax) than others (consulting). These results also suggest that knowledge management for tax is different from that for audit. The different product lines have different reuse patterns. These results are consistent with our a priori expectations based on the notion that tax and audit generally are more routine. computer.org/intelligent
So far, the location of the practice areas on the grid in Figure 2b just exist and are not managed. A snapshot of certain knowledge base usage statistics determines the location.
• Grid location just “is.” Certain knowledge is more stable and can be well structured. So, certain decisions just have more reuse. As audit and tax problems show, checklists, pronouncements, and law can be built into their knowledge management systems. • Grid location might be a function of a decision life cycle. That life cycle initially has little reuse, but gradually, as a decision becomes better understood, knowledge reuse (intraperiod and interperiod) increases. Consulting solutions change because requirements for consulting change. As many in an industry adopt a best practice, firms seek new best practices and solutions. However, audit and tax solutions generally are constrained by law and pronouncement, so they change more slowly. • Grid location is managed. Knowledge and processes are more tightly managed and integrated. Managing the location In particular, when a service area appears in the lower-left corner with few uses, a knowledge management goal would be to push it to the upper right. At the extreme under this view, the grid provides a tool that can be used to “evaluate” how well knowledge is being managed: the more efficient the system, the closer it would be to the upper-right corner. Grid movement facilitators. Several factors might facilitate movement to the upper right. First, processes might not frequently use 47
K n o w l e d g e
M a n a g e m e n t
knowledge sources because a company has not fully examined, integrated, or analyzed the problem that it faces. So, the company might not have fully integrated knowledge management into the processes. For example, previously ignored call centers are opportunities to integrate knowledge management with call center processes. Second, in some cases the knowledge management system simply might not have the right resources. For example, a company might have ignored a particularly important set of resources. Third, the way the system is deployed might inhibit its use. For example, a system for supporting salespeople might require, but lack, mobile capabilities. Adding such capabilities might shift reuse from little to frequent. Other factors exist, but in general, to move a process to the upper right requires analyzing the process and the users to understand how the process could be changed, what knowledge should be reused, and how the process and the knowledge management system could be integrated. Integrating domain and knowledge management, and structuring problems appropriately, facilitates knowledge reuse.
As my discussion of the audit, tax, and consulting service lines showed, differences in problem domains might make the push to the upper right infeasible. For example, in general, audit and tax are much more routine processes than consulting is. Furthermore, consulting is more likely to change over time, making a shift to the upper right more difficult or costly. Finally, pushing a process to the upper-right corner might make it less effective, adaptive, or creative. Also, individual firm factors can inhibit the push. Perhaps the most critical firm factor is culture. For example, firm culture might inhibit sharing of how to integrate certain activities into the knowledge management system. For instance, Wanda Orlikowski noted in her discussion of a professional service firm, code-named “Alpha,” that
Grid movement inhibitors. Unfortunately, some factors might inhibit the push to the upper right, thus limiting the grid’s use as an evaluation tool.
A lack of sharing knowledge about consulting processes would inhibit the ability to determine what knowledge resources to reuse and how to change the process to facilitate reuse.
Alpha shares with many other consulting firms a relatively competitive culture.… The pyramidal structure and the hierarchical “up or out” career path promote and reinforce an individualistic culture among the consultants.… In such a competitive culture, there are few norms around cooperating or sharing knowledge with peers.… Power in this firm is your client base and technical ability.… Now if you put all this information in a (knowledge base) ... you lose power.7
Contributions This research provides • an analysis of real knowledge management database data, drawn from a large professional service firm; • an approach to analyze knowledge management usage data to investigate differences required for different domains; • findings that indicate usage data is highly correlated over time; as a result, usage data can predict future usage and corresponding knowledge management system requirements; • analysis revealing that different practices in a consulting firm have different empirical footprints—that is, different correlations and usage ratios suggesting that different practices have different knowledge management requirements; • a grid methodology to help manage reuse: if a firm pushes knowledge areas from the grid’s lower left to its upper right, reuse might increase; and • a way to facilitate knowledge management system design and improve the data usage report (expanded below). Knowledge management system design This research’s results have substantial implications for the design of knowledge management systems, particularly for con-
Organizational Impact: Why Knowledge Management Systems Can Cause Controversy Professional service firms typically are partnerships, where the partners own and manage the firm and its engagements. As a result, potential users and managers of the knowledge management system are also those who pay for the systems. So, it is probably not surprising that in some cases the knowledge management system has been a source of concern and controversy. Knowledge management systems in professional service firms typically have originated in consulting and then been deployed to audit and tax1,2 (for more on these three service lines, see the other sidebar). Consider the KPMG 1997 Annual Report.3 In a discussion about consulting, the report states, “Knowledge management is, indeed, the key to our approach to delivering effective consulting solutions. We will continue to build our information base to increase our shared knowledge and help provide timely, cost effective solutions that consistently meet our clients’ needs.” However, in an adjacent discussion of auditing, the report states: “Going forward our professionals will … access our knowledge base.” The discussion on tax did not mention knowledge management, per se. Unfortunately, because knowledge management systems originate in one product line and can provide different costs
48
and benefits to service lines, they can serve as disruptive forces in organizations. A case study about KPMG’s first knowledge management system design, Shadow Partner, partially documents some of the fragmentation deriving from product line partner reactions to the potential new system.4 Consulting pushed for the new system, but many auditing partners apparently were not in favor of the system.
References 1. American Productivity & Quality Center, Arthur Andersen, tech. report, APQC, Houston, Texas, 1997. 2. A.M. Chard and M. Sarvary, Knowledge Management at Ernst & Young, tech. report I-M-291, Graduate School of Business, Stanford Univ., Stanford, Calif., 1997. 3. Annual Report 1997, KPMG, New York, 1997. 4. J. Gladstone and R. Eccles, KPMG: The Shadow Partner, product 9492-002, Harvard Business School, Cambridge, Mass., 1995.
computer.org/intelligent
IEEE INTELLIGENT SYSTEMS
T h e sulting. Systems for consulting need to facilitate less knowledge reuse, and they need to facilitate one-off database usage. So, such systems will be less predictable and require broader access to a wider range of data than in other product lines. Systems for audit and tax should facilitate greater reuse; they can embed knowledge management resources into their work processes. Ultimately, the different knowledge management requirements for service lines could cause problems in an organization (see the sidebar, “Organizational Impact: Why Knowledge Management Systems Can Cause Controversy”). Improving the data usage report The current data usage report provided by the Big 5 professional services firm is just a list of knowledge bases and corresponding accesses. The findings here suggest gathering additional data as part of the data usage report. Currently the Lotus Notes and outside databases have no practice (audit, consulting, tax) breakdown of data, even though these databases contain most of the knowledge sources. Because the results suggest usage differences between different practice areas, such data could facilitate future analysis. For example, audit and tax information needs appear more predictable, while consulting information needs are less predictable. Access to additional data would let users analyze trends over time. Furthermore, the data usage report could provide a history of grid-based information. For example, for particular practice areas, the analytic information in Tables 1 and 2 could be changed to determine if practice areas were evolving from the lower-left to the upper-right corner or if they were stationary. The grid could provide goals for practice areas.
end of the spectrum, consulting information needs appear more diffuse with much less reuse over time and within a period. Such differential reuse of knowledge can cause problems across product lines, because it suggests differential costs and benefits from the knowledge management system. When the structure of the organization spreads costs across all groups, controversy arises because one group may fund the knowledge management system but not benefit directly from it. Rather than taking the locations on the grid as given, they can be managed. Interactive design of processes and knowledge management could push an application from one part of the grid to another. Unfortunately, issues such as not sharing information impede the ability to manage knowledge in such a fashion. At this point, there are more questions than answers concerning the application of the theory generated here. Future work would include these issues: • What does it take to push knowledge from one quadrant to another? To what extent can technology facilitate the move? What is the role of intelligent systems technology in “unsticking” knowledge from a quadrant? 8 • Can knowledge get “stuck” in one quadrant? If so, why? • Can knowledge “backslide” from the upper-right corner to the lower-left corner? • If the grid provides a “knowledge map,” what kind of knowledge maps do we find in knowledge management systems in other industries? • If we study these grids, and the changes in them, over time is there some dynamic structure that evolves? For example, do we find that knowledge in the upper-right corner stays put, while knowledge in other portions of the grid evolves toward the upper-right corner?
T
his research shows that knowledge base usage heavily correlates over time, suggesting that usage data can provide the ability to forecast knowledge base, future computing, and bandwidth needs. In a Big 5 professional service firm, consulting exhibits a statistically significantly lower level of knowledge reuse over time than audit and tax. Similarly, database accesses within a period differ by functional area (for example, audit, consulting, and tax). Generally, tax tends to reuse knowledge over multiple periods and within periods, while at the other
JANUARY/FEBRUARY 2001
A u t h o r
Daniel E. O’Leary’s biography appears on page
25.
References 1. J. Foley, “Giant Brains Are Thinking Ahead,” Information Week, 9 Sept. 1996. 2. American Productivity & Quality Center, Arthur Andersen, tech. report, APQC, Houston, Texas, 1997. 3. D. Snowden, “A Framework for Creating a Sustainable Knowledge Management Program,” The Knowledge Management Yearbook 1999–2000, J. Corda and J. Woods, eds., Butterworth-Heinemann, Boston, 1999, pp. 52–64. 4. A. Abecker et al., “Information Support for Knowledge Intensive Business Processes— Combining Workflows with Document Analysis and Information Retrieval,” Bringing Knowledge to Business Processes, tech. report SS-00-03, AAAI Press, Menlo Park, Calif., 2000, pp. 53–60. 5. U. Reimer et al., “A Knowledge-Based Approach to Support Business Processes,” Bringing Knowledge to Business Processes, tech. report SS-00-03, AAAI Press, Menlo Park, Calif., 2000, pp. 61–68. 6. H. Schnurr and S. Staab, “A Proactive Inferencing Agent for Desk Support,” Bringing Knowledge to Business Processes, tech. report SS-00-03, AAAI Press, Menlo Park, Calif., 2000, pp. 44–52.
Acknowledgments I presented earlier versions of this article at the Workshop on Information Technology and Systems (WITS) in December 1999 and at Dagstuhl in July 2000. I thank the participants and referees (particularly two anonymous referees) for comments on earlier versions of this article. I also thank Chris Dellarocas for raising a question regarding pushing product areas to different parts of the grid. computer.org/intelligent
7. W. Orlikowski, “Learning from Notes: Organizational Issues in Groupware Implementation,” The Information Society, vol. 9, 1993, pp. 237–250. 8. D. O’Leary, “Management of Reengineering Knowledge: AI-based Approaches,” Intl. J. Intelligent Systems in Accounting, Finance and Management, vol. 9, nos. 1–2, 2000, pp. 107–118. 49