HQEMU: A Multi-Threaded and Retargetable Dynamic Binary Translator on Multicores Ding-Yong Hong
Chun-Chen Hsu
Pen-Chung Yew
Department of Computer Science National Tsing Hua University Institute of Information Science Academia Sinica, Taiwan
[email protected]
Department of Computer Science and Information Engineering National Taiwan University, Taiwan
[email protected]
Department of Computer Science University of Minnesota, USA Institute of Information Science Academia Sinica, Taiwan
[email protected]
Jan-Jan Wu
Wei-Chung Hsu
Pangfeng Liu
Institute of Information Science Academia Sinica, Taiwan
[email protected]
Department of Computer Science National Chiao Tung University, Taiwan
[email protected]
Department of Computer Science and Information Engineering National Taiwan University, Taiwan
[email protected]
Chien-Min Wang
Yeh-Ching Chung
Institute of Information Science Academia Sinica, Taiwan
[email protected]
Department of Computer Science National Tsing Hua University, Taiwan
[email protected]
ABSTRACT Dynamic binary translation (DBT) is a core technology to many important applications such as system virtualization, dynamic binary instrumentation and security. However, there are several factors that often impede its performance: (1) emulation overhead before translation; (2) translation and optimization overhead, and (3) translated code quality. On the dynamic binary translator itself, the issues also include its retargetability to support guest applications from different instruction-set architectures (ISAs) to host machines also with different ISAs, an important feature for system virtualization. In this work, we take advantage of the ubiquitous multicore platforms, using multithreaded approach to implement DBT. By running the translators and the dynamic binary optimizers on different threads on different cores, it could off-load the overhead caused by DBT on the target applications; thus, afford DBT of more sophisticated optimization techniques as well as the support of its retargetability. Using QEMU (a popular retargetable DBT for system virtualization) and LLVM (Low Level Virtual Machine) as our building blocks, we demonstrated in a multithreaded DBT prototype, called HQEMU, that it could improve QEMU performance by a factor of 2.4X and 4X on the SPEC 2006 integer and floating point benchmarks for x86 to x86-64 emulations, respectively, i.e. it is only 2.5X and 2.1X slower than native execution of the same benchmarks
on x86-64, as opposed to 6X and 8.4X slowdown on QEMU. For ARM to x86-64 emulation, HQEMU could gain a factor of 2.4X speedup over QEMU for the SPEC 2006 integer benchmarks. 1
Categories and Subject Descriptors C.4 [Performance of Systems]: Modeling techniques; D.3.4 [Processors]: Code generation; D.3.4 [Processors]: Optimization; D.3.4 [Processors]: Run-time environments
General Terms Design, Performance
Keywords Dynamic Binary Translation, Multi-Threaded, Multicores, FeedbackDirected Optimization, LLVM, Hardware Performance Monitoring, Traces
1. INTRODUCTION Dynamic binary translators (DBT) that could emulate an application binary in one instruction-set architecture (ISA) on a host machine with a different ISA are gaining importance. It is because dynamic binary translation is the core technology of system virtualization, an often required system support in the new era of cloud and mobile computing. DBT could also be used in binary instrumentation, security monitoring and other important applications. However, there are several factors that could impede the effectiveness of a DBT: (1) emulation overhead before the translation; (2) translation and optimization overhead; and (3) the quality of the translated code. Retargetablity of the 1 SPEC 2006 floating point benchmarks are not supported on ARM platforms yet.
DBT is also an important requirement in system virtualization. We would like to have a single DBT to take on application binaries from several different ISAa֒es ֒ and retarget them to host machines also in several different ISAa֒es. This ֒ requirement imposes additional constraints on the structure of a DBT and, thus, additional overheads. As a DBT is running at the same time the application is being executed, the overall performance of the translated binary on the host machine is thus very sensitive to the overhead of the DBT itself. A DBT could ill-afford to have sophisticated techniques and optimizations for better codes. However, with the ubiquity of the multicore processors today, most of the DBT overheads could be off-loaded to other cores. The DBT could thus take advantage of the multicore resources and becomes multithreaded itself. This allows it to become more scalable when it needs to take on more and more large-scale multithreaded applications in the future. In this work, we developed a multithreaded DBT prototype, called HQEMU, which uses QEMU [4], an efficient and retargetable DBT system as its frontend for fast binary code emulation and translation. QEMU could emulate and translate binary applications from several target machines such as x86, PowerPC, ARM and SPARC on popular host machines such as x86, PowerPC, ARM, SPARC, Alpha and MIPS. However, it lacks a sophisticated optimization backend to generate more efficient code. We thus use the LLVM compiler [18], also a popular compiler with sophisticated compiler optimization as its backend, together with a dynamic optimizer that uses on-chip hardware performance monitor (HPM) to dynamically improve code for higher performance. Several new trace formation and code optimization techniques are also developed to generate more efficient code. With the hybrid QEMU (frontend) + LLVM (backend) approach, we successfully addressed the dual issue of good translated code quality and low translation overhead on the target applications. Significant performance improvement over QEMU has been observed. The main contributions of this work are as follows: • We developed a multi-threaded retargetable DBT on muticores that achieved low translation overhead and good translated code quality on the target binary applications. We showed that this approach could be beneficial to both short-running and long-running applications. • We propose a novel trace combination technique to improve existing trace selection algorithms. It could effectively combine/merge separated traces based on the information provided by the on-chip HPM. We demonstrate that such feedback-directed trace merge optimization can significantly improve the overall code performance. • Experimental results show that HQEMU could improve the performance by a factor of 2.4X and 4X over QEMU, and are only 2.5X and 2.1X slower than the native execution for x86 to x86-64 emulation using SPEC2006 integer and floating point benchmarks, respectively. For ARM to x86-64 emulation, HQEMU
shows a gain of 2.4X speedup over QEMU for the SPEC integer benchmarks (there is no ARM-version of SPEC 2006 floating-point benchmarks). The rest of this paper is organized as follows: Section 2 provides the details of our multi-threaded hybrid QEMU+LLVM DBT system. Section 3 discusses the problems of existing trace selection approaches, and presents our trace combination strategy. Section 4 evaluates the effectiveness of our cross-ISA emulation. Section 5 gives some related work. Finally, Section 6 concludes this paper.
2. TRACE-BASED HYBRID DYNAMIC BINARY TRANSLATOR In this section, we first give a brief overview of QEMU. Then we elaborate on the design details of the multi-threaded trace-based hybrid dynamic binary translator HQEMU.
2.1 Overview of QEMU QEMU is an efficient and retargetable DBT system that enables both full-system virtualization and process-level emulation. Its core translation engine is called Tiny Code Generator (TCG), which provides a small set of IR operations (about 142 operation codes). The main loop of QEMU translates and executes the emulated code one basic block at a time. When a block of the guest code is fetched, disassembled and translated into TCG intermediate code, TCG improves the intermediate code with two simple optimization passes: register liveness analysis and store forwarding optimization. Dead code elimination is also done as a byproduct of these two optimization passes. Finally, the intermediate code is translated into the host code with a oneto-one mapping. Without further optimizations, there are often many redundant load and store operations left in the generated host codes. Although the code quality is not as good as it should be, the whole translation process including the optimizations incurs negligible overhead. These design considerations make QEMU an ideal choice for emulating short-running applications or applications with few hot blocks. Some of the experimental results are presented in Section 4.
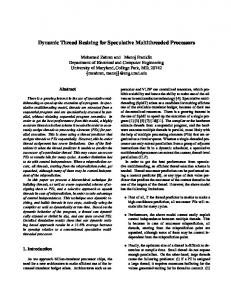
2.2 Multi-Threaded Hybrid DBT Systems The goal of this work is to design a DBT system that could emit high-quality host codes, but exert low overhead on the running applications. The requirements of low overhead and high-quality codes are often in conflict with each other on a single-core system. To find a good balance, one needs to select optimization schemes that are highly cost effective. This approach, however, limits many optimization opportunities because it is very difficult to find sufficient optimization schemes that meet such criteria. Instead, we adopt a hybrid multi-threaded approach to deal with such issues. Fig. 1 illustrates the organization of HQEMU. It has an enhanced QEMU as its frontend, and an LLVM together with a dynamic binary optimizer (DBO) as its backend. DBO uses a HPM-based feedback-directed runtime optimization scheme. The details of DBO are discussed in Section 3. In its current implementation, QEMU is running on one thread and LLVM+DBO are running on another. Two code caches:
Multi-thread App
Emulation Module TCG Translator Core 1~m-2
Block Code Cache
Optimization Thread Pool
Optimization Request FIFO Queue
LLVM Translator
Core m-1
Dynamic Binary Optimizer Core m
Trace Cache Execution Profile
Figure 1: The architecture of hybrid DBT system on a mcore platform. a block-code cache and a trace cache, are built in the DBT system that host translated binary codes at different optimization levels. The two translators are designed for different purposes. The translator in the enhanced QEMU (i.e. TCG) acts as a fast translator. TCG translates guest binary at the granularity of a basic block, and emits translated codes to the block code cache. It also keeps the translated guest binary in its TCG intermediate representation (IR) for further optimization in the HQEMU backend. The emulation module (i.e. the dispatcher in QEMU) coordinates the translation and the execution of the guest program. It kicks start TCG when an untranslated block is encountered. The purpose of the emulation module and the fast translator is to perform the translation as quickly as possible, so we could switch the execution to the translated code in the block code cache for a higher performance. When the emulation module detects that some code region has become hot and is worthy of further optimization, it sends a request to the optimization request FIFO queue together with the translated guest binary in its TCG IR format. The requests will be serviced by the HQEMU backend translator/optimizer running on another thread (and on another core). For the HQEMU backend translator/optimizer, we use an enhanced LLVM compiler because it consists of a rich set of aggressive optimization passes and a just-in-time runtime system. When the LLVM optimizer receives an optimization request from the FIFO queue, it converts its TCG IRs to LLVM IRs directly instead of converting guest binary from its original ISA [17]. This approach simplifies the backend translator tremendously because TCG IR only consists of about 142 different operation codes instead of a much larger set in most guest ISAs. Many LLVM compiler optimization passes are performed on the LLVM IR, and finally highly optimized host code is emitted to the trace cache. A rich set of program analysis facilities and powerful optimization passes in LLVM are helpful in generating such high quality host codes. For example, redundant memory operations could be eliminated via the LLVM register promotion optimization. LLVM also selects the best host instructions sequences. For example, it could replace several scalar operations by one SIMD instruction. These analysis and optimization passes could incur considerable overhead. However, such overheads are hidden because the LLVM translator is running on the other thread (and on another core) without interfering with
the execution of the guest program. The backend LLVM translator could also spawn more worker threads to accelerate the processing of optimization requests if there are many of them waiting in the queue. We also apply the structure of non-blocking FIFO queue [22] to reduce the overhead of communication among these threads. With the hybrid QEMU+LLVM approach, we could benefit from the strength of both translators. This approach successfully addresses the dual issue of good translated code quality and low translation overhead.
2.3 Trace Optimization Support A typical binary translator needs to save and restore program contexts when the control switches between the execution in the dispatcher and from the translated code in the code cache. The saving and restoring of registers during such context switches could incur significant overhead. In the execution of the translated code from the code cache, we may again need to load and store registers during code region transition. The problem is that DBT usually translates one code region at a time, often at the granularity of one basic block. Hence, it conducts register mapping only within this code region. To ensure the correctness of emulation, the values of the guest registers are required to be stored back to the memory before control is transferred to the next code region, and be reloaded at the beginning of the next code region. Even if two code regions have a direct transition path (e.g. through block chaining, shadow stack [8] or IBTC [26]) and also have the same guest to host register mappings, values of the guest registers still need to be stored and reloaded because we cannot be sure if any of these code regions could be the jump target of an unknown code region. Because of these independently translated code regions and the resulting frequent storing and reloading of registers during code region transitions, the performance could be very poor. Such high transition overheads can be alleviated by enlarging the granularity of code regions. The idea is to merge many small code regions into larger ones, called traces, and thus eliminating the redundant load and store operations by promoting such memory operations to register accesses within traces. Traces are code regions with a single entry and multiple exits. They have been shown to improve performance because of improved locality, increased indirect branch prediction accuracy, and opportunities for inter-procedural optimizations [6, 21]. Through trace formation, we not only can apply more code optimizations but also can eliminate the high overhead of region transitions. Since such optimizations can be done in separate threads running on different cores without interfering with the emulation of the guest application, we try to explore more optimization opportunities on those traces. A relaxed version of Next Executing Tail (NET) [12] is chosen as our trace selection algorithm. In the original NET scheme, it considers every backward branch as an indicator of a cyclic execution path, and terminates the trace formation at such backward branches. We relax such a backward-branch constraint, and stop trace formation only when the same program counter (PC) is executed again. This relaxed algorithm is similar to the cyclic-path-based repetition detection scheme in [14].
Trace 1
Trace 2
Algorithm 1: Trace profile and prediction Profile Predict
Host code
Profile Predict
Host code
Profile Predict
Host code
1: 2: 3: 4: 5: 6: 7: 8:
profile stub label: jump < target > if enable prof ile[i] = T RU E then counter ← counter + 1 if counter ≥ threshold then enable predict ← T RU E end if end if
9: predict stub label: 10: if enable predict = T RU E then 11: if P C exists in recording list then 12: enable predict ← F ALSE 13: CompileTrace(recording list) 14: else 15: Add P C to recording list 16: end if 17: end if
Figure 2: An example of trace detection and pseudo code of the profiling and prediction stubs.
In HQEMU, a trace is detected and formed by locating a hot execution path through an instrumentation-based scheme. Fig. 2 gives an example of the trace detection and formation scheme. Two small pieces of codes: a profiling stub and a prediction stub, are inserted at the beginning of each translated code region in the block code cache. The profiling stub determines whether a block is becoming hot or not; the prediction stub will then append a hot code block to a recording list. The pseudo code of these two stubs is shown in Algorithm 1 in Figure 2. To detect a hot trace, we have to locate the head code block of the candidate trace first. During the emulation, the QEMU dispatcher gets the starting PC of the next guest basic block to be executed. The dispatcher looks up a directory to locate the translated host code block pointed to by this PC. If there is a miss in the directory, the emulation modules translates the guest block and add an entry to the directory. If it is a hit, the basic block has been translated before and a cyclic execution path is found. This basic block is a potential trace head and its associated profiling routine is enabled. The counter is incremented each time this block is executed. When the counter reaches a threshold, the prediction routine is enabled to record the blocks following the head block executed in the recording list. When the prediction routine detects that a head block is already in the recording list, a cyclic path is formed and the trace prediction stops. The execution history in the recording list is packed as a request to the LLVM translator through the optimization request FIFO queue. The LLVM translator periodically polls requests from FIFO queue. After LLVM optimization, the head block of the trace is patched a direct jump (line 2 in Algorithm 1) and the execution is redirected from the unoptimized codes to the optimized codes. This jump patching is processed asynchronously by the LLVM translator, and is transparent to the emulated programa֒es ֒ execution threads. We use self-branch patching mechanism proposed in [15] to ensure the patching is completed correctly when a multi-thread application is emulated. The store/load of registers to/from memory within a trace is optimized by promoting these memory operations to register accesses. Since a trace is formed because of its hotness, significant block transition overhead is avoided.
3.
TRACE MERGING
BB1
BB1
BB3 to BB3
BB2
BB2
BB3
to BB1
(a) CFG (b) Trace Figure 3: A CFG of three basic blocks and traces generated with NET trace selection algorithm. Dynamic Binary Optimizer
LLVM Translator
Trace Cache
Trace Combiner
Hardware Monitoring Unit
Trace Filter
Profile Analyzer
Sample Profile
Figure 4: Trace combination with HPM sampling.
Although the overhead of region transitions at the basicblock level can be reduced with the trace formation and optimization, the redundant load/store operations during transitions among traces could still incur noticeable overheads. The reason is that the only traces NET algorithm could handle are either a straight fall-through path or a simple loop. It cannot deal with a hot code region that has a more complex control flow graph (CFG). Figure 3(a) shows a simple code example with three basic blocks. Applying NET on this code region will result in two separate traces as shown in Figure 3(b). The known flaw of such trace selection algorithms includes trace separation and early exits [16]. In order to overcome such problems, we force the merging of problematic traces that frequently jump among themselves. For example, if there are frequent jumps between the two traces shown in Figure 3(b), we will force the merging of those two traces into one with its CFG as shown in Figure 3(a). The biggest challenges of such trace merging are (1) how to efficiently detect such problematic traces; and (2) when to merge them at runtime. One feasible approach is to use the same instrumentation-based NET algorithm described in Section 2.3, but insert routines to detect the separation of traces and early exits. This approach, however, will incur substantial overhead because they are often frequentlyexecuted hot code regions. Instead, we use a feedbackdirected approach with the help of on-chip hardware performance monitor (HPM) to perform trace merging. The workflow of such trace merging in DBO is shown in Figure 4. The DBO (shown in Figure 4) consists of three components: a profile analyzer, a trace filter and a trace combiner. At first, as DBO continues to receive sampled profile, the profile analyzer collects sampled PCs and accumulates the sample counts for each trace to determine the degree of hotness of each trace. In the second step, the trace filter selects the hot candidate traces for merging. In our algorithm, a trace
Table 1: Compiler optimization flags. Native x86 ARM
Optimization flags -O2 -fno-strict-aliasing -O2 -fno-strict-aliasing -m32 -msse2 -mfpmath=sse -O2 -fno-strict-aliasing -mfloat-abi=softfp -mfpu=neon -mcpu=cortex-a8 -ftree-vectorize -ffast-math
has to meet three criteria to be considered as a hot trace: (1) the trace is in a stable state; (2) the trace is in the 90% cover set (to be explained later); and (3) the sampled PC count of the trace must be greater than a threshold. To determine if a trace has entered a stable state, a circular queue is maintained in the trace filter to keep track of the traces executed in the most recent N sampling intervals. The collection of traces executed in the most recent sampling interval is put in an entry of the circular queue, and the oldest entry at the tail of the queue is discarded if the queue overflows. We consider a trace is in a stable state if it appears in all entries of the circular queue. The top traces that contribute to 90% of total sample counts are collected as the 90% cover set. The trace combiner then chooses the traces that are likely to cause trace separation for merging. Note that, in trace optimization, we apply the concept in NET algorithm to collect the basic blocks that form a cyclic path for optimization. The same concept is applied here in trace merging. All traces that form cyclic paths after merging are collected by the trace combiner. However, we do not limit the shape of the merged trace to a simple loop here. Any CFG that has nested loops, irreducible loops, or several loops in a trace, can be formed as a merged trace. Moreover, it is likely to collect several groups of traces for trace merging at a time. Finally, the groups of traces merged by the trace combiner are passed to the LLVM translator through the optimization request FIFO queue for further optimizations. After a merged trace is optimized by the LLVM translator, its initial sample count is set to the maximum sample count of the component traces that form the merged trace. Moreover, the sample counts of the component traces are reset to zero so that they will not affect the formation of the next 90% cover set for future trace combination.
4.
PERFORMANCE EVALUATION
In this section, we present the performance evaluation of HQEMU framework. Detailed analysis of overall performance, overhead of trace generation, and overhead of trace merging are provided to verify the effectiveness of the proposed framework.
4.1 Experimental Setup All performance evaluation is performed on a system with one 3.3 GHz quad-core Intel Core i7 processor and 12 GBytes main memory. The operating system is 64-bit Gentoo Linux with kernel version 2.6.30. The SPEC2006 benchmark suite is tested with test and reference inputs in the experiments and for two different ISAs, ARM and x86 to show the retargetability of HQEMU. All benchmarks are compiled with GCC 4.4.2 for the x86 guest ISA and GCC 4.4.1 [9] for the ARM guest. LLVM version 2.8 is used in our framework and
the default optimization level (-O2)is used for JIT compilation. Because SPEC2006 benchmarks are all single-thread programs, we run only one thread in the LLVM translator and this thread is capable of handling all the optimization requests. The trace profiling threshold is set to 50 and the maximum length of a trace is 16 basic blocks. We use Perfmon2 [24] for performance monitoring with HPM and the sampling interval used in the experiments set at 1 million cycles/sample. The size of circular queue, N, for trace merging in the dynamic optimizer is set to 8. We compare the results to the native runs whose executables are compiled to the host which is a 64-bit x86 (i.e. x86-64). Since the default of GCC compilation on x86-64 is with SSE enabled, native runs can benefit from SSE instructions. Therefore, we also compile the benchmarks in guest ISA with SIMD enabled. All compiler optimization flags used for each architecture are listed in Table 1. Four different configurations are used to evaluate the effectiveness of HQEMU: • QEMU which is the vanilla QEMU version 0.13 with the fast TCG translator. • LLVM which uses the same modules of QEMU except that the TCG translator is replaced by the LLVM translator. • HQEMU-S which is the single threaded HQEMU with TCG and LLVM translators running on the same thread. • HQEMU-M which is the multi-threaded HQEMU, with TCG and LLVM translators running on separate threads. In both the QEMU and the LLVM configurations, code translations are conducted at block granularity without trace formation, and in the HQEMU-S and the HQEMU-M configurations, trace formation and trace merging have been applied.
4.2 Performance of HQEMU Fig. 5 illustrates the overall performance results of x86-32 to x86-64 emulations over the native runs. The Y-axis is the normalized execution time over native execution time. Note that in all the figures, we do not provide the confidence intervals because there was no noticeable performance fluctuation among different runs. Fig. 5(a) and 5(b) show the results of SPEC2006 CINT and CFP benchmarks with test input sets, respectively. In Fig. 5(a), the slowdown factors of QEMU over native execution range from 2.5X to 21X and the geometric mean is 7.7X. Most performance results of LLVM are better than or close to QEMU except for four benchmarks: perlbench, gcc, libquantum and xalancbmk. The reason why LLVM configuration has large slowdowns with these four benchmarks is because too much translation overhead are paid without sufficient amortization. On the other hand, benchmark hmmer and h264ref are two of the cases where the benefit of optimized code outweighs the translation overhead, so that the LLVM configuration outperforms the QEMU configuration. As for HQEMU-M, all benchmarks run faster than both the QEMU and the LLVM configurations, including the four
71
62
306 101
392 178
40
QEMU LLVM HQEMU-S HQEMU-M
30
20 15.4 12.8 10
9.3
7.6 2.8
0
pe
3.7
en
ip2
ch
c
mc
f
go
hm
bm
3.4
2.6
1.7 gc
7.7 7.1
7.0
2.6 bz
rlb
sje
me
k
ng
r
qu
h2
an
64
ref
tum
20
12.1 9.7
9.5
10
1.8 om
as
ne
tar
tpp
2.5
xa
lan
ge
cb
0
o_
me
mk
2.3
2.7
2.0
0.6 bw
av
es
an
ga
me
ss
mil
c
ze
us
mp
gro
3.5 1.5
ca les na d ctu md ealI lie I 3 sA cs DM d
ma
3.9
2.6
1.7 so
ple
x
po
ca
vra
lcu
lix
y
Ge
ton t FD o TD
lbm
wr
f
5.5 3.3
3.1
2.0
ms
(b) CFP (Test input)
sp
hin
x3
ge
o_
me
an
16
12
QEMU LLVM HQEMU-S HQEMU-M Normalized Execution Time
QEMU LLVM HQEMU-S HQEMU-M 8 5.9
4
3.5
3.5
3.2
2.9
3.1
2.4
2.2
3.4 2.7 2.5
3.1
2.6
2.1
12
8.4 8
2.8
2.8 2.1
1.9 1.1
pe
bz
rlb
en
ch
ip2
gc
c
mc
f
go
hm
bm
k
sje
me
r
ng
lib
qu
h2
an
tum
64
ref
om
as
ne
tpp
tar
xa
lan
ge
cb
mk
0
o_
me
an
4.1
3.7
4
1.5
1.2 0
9.5 9.5
8.5
7.4
4.0
3.2 lib
30
(a) CINT (Test input) Normalized Execution Time
224 84
QEMU LLVM HQEMU-S HQEMU-M Normalized Execution Time
Normalized Execution Time
40
bw
av
es
ga
me
ss
mil
c
ze
us
mp
1.7
gro
1.4
1.4
ca les na d ctu md ealI lie I 3 sA cs DM d
ma
2.4
2.1
1.6 so
ple
x
po
ca
vra
y
lcu
lix
Ge
ton t FD o TD
ms
lbm
(c) CINT (Ref input) (d) CFP (Ref input) Figure 5: SPEC2006 benchmark results of x86 to x86-64 emulation with test and reference input. benchmarks that the LLVM configuration lost to QEMU. The performance difference is significant. In Fig. 5(a), the average slowdown of QEMU for CINT is 7.7X, and 12.8X for LLVM, while the slowdown to native run is only 4X for HQEMU-M. In Fig. 5(b), the average slowdowns of QEMU and LLVM are both 9.95X for CFP while the slowdown is only 3.3X for HQEMU-M. Although the performance of HQEMU-S is not as impressive as HQEMU-M, it still outperforms both QEMU and LLVM. For test input driven runs, fast translation is considered important, and QEMU outperforms LLVM, based on the averaged slowdown numbers. However, many of the benchmarks can still benefit from better optimized code even with short runs. This is where HQEMU shines, its start-up of emulation works as in QEMU, but when the code reuse is high, it switches the execution to the trace-optimized code. The longer the code runs, the greater the speed up from optimized traces. In order to minimize the impact of optimization overhead, HQEMU-M allows more than one thread to handle independent TCG translations and LLVM translations. It allows the emulation thread runs like QEMU, while hot traces are selected for optimization. When the translation load becomes high (i.e. the queue of translation requests get filled up), HQEMU-M may even fork more threads to minimize the impact of translation delay. With this multi-threaded approach, the emulation thread can keep going without waiting for the optimization. When the optimization thread finishes the translation, the optimized code is placed in the trace cache. Via an atomic patch to the block code cache, the emulation can direct subsequent execution to the trace cache and start to benefit from optimized traces. Fig. 5(c) and 5(d) present the results of SPEC2006 benchmarks with reference inputs. Unlike test input driven runs, the programs spend much more time running in the optimized code caches. As the result shows, the LLVM configuration outperforms QEMU since the optimization overhead is very much amortized. The speed up from LLVM in-
2.8
2.2
1.8
1.9
wr
f
sp
hin
x3
3.0 2.2 2.1
ge
o_
me
an
cludes some DBT related optimizations such as block chaining and indirect branch prediction as well as compiler optimizations such as redundant load/store elimination. Redundant load/store elimination is effective in reducing instructions generated. The trace formation and trace merging of HQEMU further eliminate lots of redundant load/store instructions related to architecture state emulation. Through trace formations, HQEMU achieves significant improvement over both QEMU and LLVM. For reference input driven runs, the benefit of HQEMU-M is not as outstanding as in Fig. 5(a) and 5(b) when compared to HQEMU-S. This is because the translation overhead is playing less a role for reference input driven runs. As shown in Fig. 5(c) and 5(d), HQEMU-M is about 2.5X and 2.1X slower than native runs with CINT and CFP benchmarks, respectively. Compared to the slowdowns of QEMU, HQEMU-M is 2.4X and 4X faster than QEMU, for CINT and CFP, respectively. For CFPs, the speedup of LLVM and HQEMU over QEMU is greater than that of CINT. This is partly due to the current translation ability of QEMU/TCG. The QEMU/TCG translator does not emit floating point instructions of the host machine. Instead, all floating point instructions are emulated via helper function calls. By using the LLVM compiler infrastructure, such help functions can be inlined and get floating point host instructions generated directly in the code cache. Fig. 6 illustrates the performance results of ARM to x8664 emulations over native execution (running x86-64 binary natively). The results of CFP benchmarks are not listed because most CFP benchmarks are written in Fortran and the ARM toolchain we use does not provide cross-compilation for Fortran. Thus, only results of CINT benchmarks are presented. The performance results of Fig. 6 are similar to the results of Fig. 5 – HQEMU-M is 2.4X faster than QEMU for CINT and is only 3.4X slower than native runs.
92
79
349 136
66.2
QEMU LLVM HQEMU-S HQEMU-M
40
52.4
30
19.8
20
15.9
) FP C e( T) ag er CIN e(
ag er
av
s
ix
ul
II
es m
al
es
ay vr
lc
av
ca
ga
de
o
av
nt
po
to
d m
QEMU LLVM HQEMU-S HQEMU-M
bw
an
na
me
20
Normalized Execution Time
11.7
M
mk
24.9
10.0 11.3
AD
cb
o_
rf
ge
7.5
w
tpp
lan
us
ref
(a) CINT (Test input)
xa
tar
ct
tum
as
ne
26.4 27.6
0%
2.2 om
m
an
64
5.5
lb
h2
ca
r
qu
k bm h c en k bm
k
lib
nc
ng
rlb
sje
me
go
hm
bm
2
go
f
la
mc
c
pe
ch
4.2
1.4 gc
2.4
ip
en
ip2
7.9 3.6
5.4
xa
2.7 bz
rlb
24.2 15.0
bz
pe
4.9
30.7
20.0
20%
c gc f re 64 m h2 ntu a qu lib r e m hm
3.4 0
35.6 28.0
10
8.2
7.1
5.8
40%
12.6
11.2
9.6
10
60.8
60% Slowdown Factor
Normalized Execution Time
50
Figure 7: The slowdown factor of instrumentation-based approach over HPM sampling for trace merging.
15
trace merging and trace formation. 10 8.2 6.0
5.5
5
4.8
4.1
3.9
2.2
2.2
4.0 3.6 3.4
5.0
4.4
4.2
2.0
1.0 0
pe
bz
rlb
en
ch
ip2
gc
c
mc
f
go
bm
hm k
me
sje r
ng
lib
qu
an
h2 tum
64
ref
om
ne
as tpp
tar
xa
lan
ge
cb
mk
o_
me
an
(b) CINT (Ref input) Figure 6: CINT2006 results of ARM to x86-64 emulation with test and reference input.
From the observation of the results, QEMU is suitable for emulating short runs or programs with very few hot blocks. The LLVM configuration is better for long running programs with heavy reuse of translated codes. HQEMU has successfully combined the advantages of QEMU and LLVM and can efficiently emulate both short- and long-running applications. Furthermore, the trace selection and merging in HQEMU expand the power of LLVM optimization to significantly remove redundant load/stores. With HQEMU, cross-ISA emulation is getting closer to the performance of native runs.
4.3 Results of Trace Generation and Merging To evaluate the impact of trace generation and trace merging, we use x86-32 to x86-64 emulation with SPEC2006 benchmarks as an example to show how the optimizations eliminate the emulation overhead incurred from code region transitions. In this experiment, the total number of memory operations for each benchmark is measured for (a) LLVM, (b) HQEMU with trace formation only and (c) HQEMU with both trace formation and merging. The differences between (a) and (b) represent the number of redundant memory accesses eliminated by trace formation; the difference between (b) and (c) represents the impact of trace merging. The hardware monitoring counters, MEM_INST_RETIRED:LOADS and MEM_INST_RETIRED:STORES, are used here to collect the total number of memory operations. Table 2 lists the results of the measurement. Column two and three present the total number of traces generated and merged in the benchmark and the values are accumulated if the benchmark has multiple input sets. Each trace is associated with a version number and is initially set to zero. After the trace merging, the version number of the new trace is the maximum version of the traces merged plus one. The maximum version of each benchmark is listed in column four. The reduced number of memory operations by trace formation (b-a) and trace merging (c-b) is listed in column five and six, respectively. The last column presents the improvement contributed from
From the results of column five and six in the table, we can see that most redundant memory operations are eliminated by trace formation for almost all benchmarks. libquantum, astar and calculix are benchmarks that have significant improvement from trace merging. As for libquantum, the hottest code region of it is composed of three basic blocks and the CFG is shown in Fig. 3(a). The code region is then divided into two separate traces by the NET trace selection algorithm. During trace transitions, almost all general purpose registers of the guest architecture need to be stored and reloaded again. In addition, there are billions of transitions between these two traces for the entire execution. Through trace merging, HQEMU successfully merges these two traces into one big region with CFG shown in Fig. 3(a) and keeps the execution staying inside this region without the aforementioned transition overhead. Thus, the performance of libquantum is improved by 71%. The other two benchmarks also exhibit similar trace separation behaviors. In Table 2, the performance of several benchmarks shows slight degradation from trace merging. The result is due to two reasons. First, the trace merging is based on HPM based sampling. Even though the sampling frequency is low, it still introduces overhead. Second, as the number of host registers becomes insufficient for aggressive register promotion of architecture state mapping, this may end up with register spilling and adversely increases the total number of memory operations.
4.4 Overhead of Trace Generation Table 3 lists the number of traces generated by HQEMU and the breakdown of time for the SPEC2006 benchmarks with reference inputs. The translation time represents the time spending on trace generation by the thread of the LLVM translator. As the table shows, most benchmarks spend less than 1% of total time conducting trace translation. gcc is a special benchmark which has lots of basic blocks and no clear hot regions. About 160 thousand traces are generated at runtime which costs about 236 and 301 seconds for emulating the x86-32 and ARM guest architectures, respectively. The translation time is about 25% of the total execution time. Thanks to the multi-threaded approach of HQEMU, this significant translation overhead can often be hidden by running the translation thread on an otherwise idled core to minimize the impact to the emulation thread. This also matches the performance results of gcc in Fig. 5(c) and 6(b) which shows HQEMU-M improves HQEMU-S by a factor of 24% and 19% for x86 and ARM guest, respectively.
Table 2: Measures of traces with x86 to x86-64 emulation for SPEC2006 benchmarks with reference input Benchmark perlbench bzip2 gcc mcf gobmk hmmer sjeng libquantum h264ref omnetpp astar xalancbmk
# Trace 13123 3076 159830 269 43310 939 1437 219 6314 1773 1053 3224
Benchmark bwaves gamess zeusmp cactusADM namd dealII soplex povray calculix tonto lbm wrf
# Trace 367 10675 1705 970 1088 3918 2474 1961 3492 5046 165 5449
CINT2006 # Comb. Ver. 5 1 41 2 81 4 9 3 216 4 0 0 30 5 1 1 11 2 5 1 21 5 1 1 CFP2006 # Comb. Ver. 3 2 60 5 48 2 1 2 0 0 9 1 20 3 7 3 5 1 28 3 1 1 14 2
A(1010 ) 113.9 212.1 214.2 23.2 138.1 136.0 152.2 26.8 441.2 31.0 88.9 115.6
B(1010 ) 7.7 24.0 4.8 5.1 16.5 0.0 40.0 290.5 31.4 8.0 56.1 3.5
Impro. -1.0% 2.7% -0.5% 4.7% -0.3% -0.7% 1.8% 71.7% 1.4% -1.4% 17.0% -1.0%
A(1010 ) 113.0 400.6 157.3 194.6 227.9 117.6 37.6 64.0 400.2 138.9 65.9 348.7
B(1010 ) .5 25.8 20.4 -20.9 .6 8.2 46.0 -4.9 238.6 6.5 7 10.3
Impro. -2.5% 3.2% 2.7% -2.6% -0.6% 0.5% 11.9% -3.2% 21.4% -0.5% 10.4% -0.4%
Table 3: Numbers of traces generated by HQEMU and the breakdown of time for SPEC2006 ref inputs. Unit of time: second. CINT2006 Benchmark perlbench bzip2 gcc mcf gobmk hmmer sjeng libquantum h264ref omnetpp astar xalancbmk Average
x86 to x86-64 ARM to x86-64 Total Time Trans. Time # Trace Total Time Trans. Time 1271 22.8 (1.8%) 10313 1276 29.5 (1.4%) 1117 5.9 (0.5%) 3427 1128 9.7 (0.9%) 914 235.8 (25.8%) 144408 1223 300.5 (24.6%) 451 .7 (0.2%) 218 370 .8 (0.2%) 1560 61.2 (3.9%) 47625 2503 88.8 (3.5%) 1029 1.9 (0.2%) 661 1748 2.5 (0.1%) 1696 2.3 (0.1%) 1282 2520 2.8 (0.1%) 841 .5 (0.1%) 249 891 .8 (0.1%) 1937 13.8 (0.7%) 5396 2622 20.8 (0.8%) 838 3.8 (0.5%) 1351 1417 4.9 (0.3%) 670 2.1 (0.3%) 941 908 2.6 (0.3%) 762 8.3 (1.1%) 2889 1200 11.2 (0.9%) 0.6% 0.6% CFP2006 x86 to x86-64 Benchmark # Trace Total Time Trans. Time bwaves 367 951 1.2 (0.1%) gamess 10675 2312 25.6 (1.1%) zeusmp 1705 1093 6.3 (0.6%) cactusADM 970 1597 2.2 (0.1%) namd 1088 710 2.8 (0.4%) dealII 3918 1034 6.7 (0.6%) soplex 2474 548 6.5 (1.2%) povray 1961 782 4.4 (0.6%) calculix 3492 2188 6.7 (0.3%) tonto 5046 2133 11.3 (0.5%) lbm 165 617 0.5 (0.1%) wrf 5449 1998 12.0 (0.6%) Average 0.3%
# Trace 13123 3076 159830 269 43310 939 1437 219 6314 1773 1053 3224
4.5 Overhead of Trace Merging In this sub-section, we discuss the overhead of trace merging based on two approaches: HPM sampling and instrumentation. For HPM sampling, we measure the overhead by enabling HPM sampling but do not actually merge traces as they are detected. The HPM sampling overhead ranges from 0.7% (milc) to 3.7% (xalancbmk) and is 1.4% of the total execution time on average for SPEC2006 benchmarks. As for instrumentation, we insert profiling and prediction routines of NET in code regions of all traces to detect cases for trace merging. When the hot traces form a cyclic path, these traces are merged. We present the overhead by comparing the performance of instrumentation-based approach to those of HPM sampling. The slowdown factor is normalized to the time of HPM sampling and is shown in Fig. 7. The average overhead of instrumentation-based approach is about 24.9% for CINT and 11.7% for CFP. The results indicate that HPM sampling could be very cost effective for the detection of trace merging.
5.
RELATED WORK
Dynamic binary translation is widely used for many purposes: transparent performance optimization [2, 19, 27], security monitoring [25], runtime profiling [20, 23] and crossISA emulation [8, 3]. With the advances of multicore architectures, several multithreaded DBT systems exploiting abundant multicore resources for optimization have been proposed in the literatures. However, most of them have very different objectives and approaches in their designs. A very related work to HQEMU is [17] which also integrates QEMU and LLVM in their DBT system. In their framework, the authors target small programs with ARM to x86-64 emulation. It sends one block at a time to LLVM translator when the TCG translator determines it is worthy of optimization. Hence, the performance of the translated code was very poor. They also did not consider the retargetability issue of their DBT. It requires a different binary to LLVM translator for each different ISA, instead of using TCG as an IR as in HQEMU. Unlike their framework, HQEMU applies sophisticated LLVM optimization on traces. Therefore, we can benefit from the advantages of long traces. HQEMU also exposes the opportunities to eliminate redundant load/store instructions during code region transitions. Ha [13] and Bohm [5] proposed the strategy of spawning one or multiple helper thread(s) for JIT trace compilation so that concurrent interpretation and JIT trace compilation can be achieved. Their approach conducts trace profiling and prediction while interpreting guest programs. Instead of using interpreter, our emulation process is based on JIT compilation. We instrument trace detection routine in the block binary code and efficiently redirect execution to trace cache as soon as the optimized code is ready. They also did not use HPM to reduce profiling overhead as in HQEMU during trace merge and optimization. The Java HotSpot VM’s parallel garbage collector [1] spawns multiple garbage collection threads to decrease garbage collection overhead and hence increase application throughput. Its threading strategy does not improve the quality of code and requires the execution of guest program to stop while garbage collection is being performed. In contrast, our goal is to reoptimize guest program at runtime, and guest code quality
can be improved significantly. COREMU [28], a full-system emulator based on QEMU, emulates multiple cores by creating multiple instances of sequential QEMU emulators. The system is parallelized by assigning multiple QEMU instances to multiple threads. With the same goal of COREMU, PQEMU [11] takes a different approach to have only one instance of QEMU but parallelizes it internally. Through sophisticated arrangement of critical sections, PQEMU achieves minimal overhead in locking and unlocking shared data. The advantage of their approach is that the performance of emulating multi-thread program can be enhanced because each guest thread is handled by a separate emulator thread. However, the emulation of singlethread program cannot benefit as much because they did not try to optimize the target guest code in each thread. In contrast, HQEMU assigns DBT functions to separate threads so very sophisticated optimizations can be applied to each guest thread without incurring overheads on the application threads, and the performance of both single-thread and multi-thread guest programs can be improved on multicore systems. Hiniker et al. [16] address the trace separation problem in two trace selection algorithms, NET and LEI. The authors focus on the issues of code expansion and locality for same-ISA DBT systems. A software-based approach for trace merge is also proposed. Davis and Hazelwood [10] also use software-based approach to solve trace separation problem by performing a search for any loops back to the trace head. Our work targets cross-ISA DBT systems and addresses the issues of trace separation problem especially for the performance and emulation overhead. We reduce redundant memory operations during region transitions and use a novel trace combination approach based on HPM sampling techniques. ADORE [19] is a lightweight dynamic optimization system based on HPM. Using HPM sampling profiles, performance bottlenecks of the running applications are detected and optimized. Chen et al. [7] proposed some techniques to improve the accuracy of HPM sampling profiles. These work motivate us to exploit HPMbased sampling techniques for our trace merge algorithm. However, [7] and [19] are not multi-threaded DBTs.
6. CONCLUSION In this paper, we presented HQEMU, a multi-threaded retargetable dynamic binary translator on muticores. HQEMU runs a fast translator (QEMU) and an optimization-intensive translator (LLVM) on different processor cores. We demonstrated that such multi-threaded QEMU+LLVM hybrid approach can achieve low translation overhead and good translated code quality on the target binary applications. We showed that this approach could be beneficial to both shortrunning and long-running applications. We have also proposed a novel trace merging technique to improve existing trace selection algorithms. It could effectively merge separated traces based on the information provided by the on-chip hardware HPM. It could remove redundant memory operations incurred from transitions among translated code regions. It could also detect and merge traces that have trace separation and early exit problems using existing trace selection algorithms. We demonstrate
that such feedback-directed trace merge optimization can significantly improve the overall code performance. [15]
Acknowledgment This work is supported in part by NSC grants NSC99-2220E-001-001, NSC99-2221-E-001-003-MY3, NSC99-2221-E-002111-MY3, and is also supported in part by NSF grant CNS0834599.
[16]
7.
[17]
REFERENCES
[1] Hotspot parallel collector. In Memory Management in the Java HotSpot Virtual Machine Whitepaper. [2] V. Bala, E. Duesterwald, and S. Banerjia. Dynamo: a transparent dynamic optimization system. In Proc. PLDI, pages 1–12, 2000. [3] L. Baraz, T. Devor, O. Etzion, S. Goldenberg, A. Skaletsky, Y. Wang, and Y. Zemach. IA-32 Execution Layer: a two-phase dynamic translator designed to support IA-32 applications on ˆ o-based systems. In Proc. Annual ItaniumA˝ Microarchitecture Symposium, 2003. [4] F. Bellard. QEMU, a fast and portable dynamic translator. In USENIX Annual Technical Conference, pages 41–46, 2005. [5] I. Bohm, T. E. von Koch, S. Kyle, B. Franke, and N. Topham. Generalized just-in-time trace compilation using a parallel task farm in a dynamic binary translator. In Proc. PLDI, 2011. [6] D. L. Bruening. Efficient,Transparent, and Comprehensive Runtime Code Manipulation. PhD thesis, Massachusetts Institute of Technology, Sept. 2004. [7] D. Chen, N. Vachharajani, R. Hundt, S.-W. Liao, V. Ramasamy, P. Yuan, W. Chen, and W. Zheng. Taming hardware event samples for FDO compilation. In International Symposium on Code Generation and Optimization, pages 202–211, 2010. [8] A. Chernoff, M. Herdeg, R. Hookway, C. Reeve, N. Rubin, T. Tye, S. B. Yadavalli, and J. Yates. FX!32: A profile-directed binary translator. IEEE Micro, 18(2):56–64, 1998. [9] GNU toolchain for ARM processors v2009q3-67. http://www.codesourcery.com/sgpp/lite/arm/. [10] D. Davis and K. Hazelwood. Improving region selection through loop completion. In ASPLOS Workshop on Runtime Environments/Systems, Layering, and Virtualized Environments, 2011. [11] J.-H. Ding, Y.-C. Chung, P.-C. Chang, and W.-C. Hsu. PQEMU: A parallel system emulator based on QEMU. In 1st International QEMU Users Forum, 2011. [12] E. Duesterwald and V. Bala. Software profiling for hot path prediction: Less is more. In Proc. ASPLOS, pages 202–211, 2000. [13] J. Ha, M. Haghighat, S. Cong, and K. McKinley. A concurrent trace-based just-in-time compiler for single-threaded javascript. In Workshop on Parallel Execution of Sequential Programs on Multicore Architectures, 2009. [14] H. Hayashizaki, P. Wu, H. Inoue, M. J. Serrano, and T. Nakatani. Improving the performance of
[18]
[19]
[20]
[21] [22]
[23]
[24] [25]
[26]
[27]
[28]
trace-based systems by false loop filtering. In Proc. ASPLOS, pages 405–418, 2011. K. Hazelwood, G. Lueck, and R. Cohn. Scalable support for multithreaded applications on dynamic binary instrumentation systems. In Proc. International Symposium on Memory Management, 2009. D. Hiniker, K. Hazelwood, and M. D. Smith. Improving region selection in dynamic optimization systems. In Proc. Annual Microarchitecture Symposium, pages 141–154, 2005. A. Jeffery. Using the LLVM compiler infrastructure for optimised, asynchronous dynamic translation in QEMU. Master’s thesis, University of Adelaide, Australia, 2009. C. Lattner and V. Adve. LLVM: A compilation framework for lifelong program analysis & transformation. In International Symposium on Code Generation and Optimization, pages 75–88, 2004. J. Lu, H. Chen, P.-C. Yew, and W.-C. Hsu. Design and implementation of a lightweight dynamic optimization system. Journal of Instruction-Level Parallelism, 6:1–24, 2004. C.-K. Luk, R. Cohn, R. Muth, H. Patil, A. Klauser, G. Lowney, S. Wallace, V. Reddi, and K. Hazelwood. Pin: Building customized program analysis tools with dynamic instrumentation. In Proc. PLDI, 2005. D. Merrill and K. Hazelwood. Trace fragment selection within method-based JVMs. In Proc. VEE, 2008. M. M. Michael and M. L. Scott. Simple, fast, and practical non-blocking and blocking concurrent queue algorithms. In 15th Annual ACM Symposium on Principles of Distributed Computing, 1996. N. Nethercote and J. Seward. Valgrind: a framework for heavyweight dynamic binary instrumentation. In Proc. PLDI, pages 89–100, 2007. The hardware performance monitoring interface for Linux. F. Qin, C. Wang, Z. Li, H.-S. Kim, Y. Zhou, and Y. Wu. LIFT: A low-overhead practical information flow tracking system for detecting security attacks. In Proc. Annual Microarchitecture Symposium, pages 135–148, 2006. K. Scott, N. Kumar, B. R. Childers, J. W. Davidson, and M. L. Soffa. Overhead reduction techniques for software dynamic translation. In Proc. IPDPS, pages 200–207, 2004. S. Sridhar, J. S. Shapiro, E. Northup, and P. P. Bungale. HDTrans: an open source, low-level dynamic instrumentation system. In Proc. VEE, pages 175–185, 2006. Z. Wang, R. Liu, Y. Chen, X. Wu, H. Chen, W. Zhang, and B. Zang. COREMU: a scalable and portable parallel full-system emulator. In Proc. PPoPP, 2011.