Running head: IDENTIFYING SETS OF MAXIMALLY EFFICIENT ACES-TF ITEMS
Identifying Sets of Maximally Efficient Items from the Academic Competence Evaluation Scales-Teacher Form
Christopher James Anthony* Oklahoma State University James Clyde DiPerna The Pennsylvania State University
* Corresponding author at: School of Applied Health and Educational Psychology, Oklahoma State University, 444 Willard Hall, Stillwater OK 74078, USA. Tel: +1 405-744-9443. Email address:
[email protected] (C. J. Anthony)
1
IDENTIFYING SETS OF MAXIMALLY EFFICIENT ACES-TF ITEMS
2
Abstract The Academic Competence Evaluation Scales-Teacher Form (ACES-TF; DiPerna & Elliott, 2000) was developed to measure student academic skills and enablers (interpersonal skills, engagement, motivation, and study skills). Although ACES-TF scores have demonstrated psychometric adequacy, the length of the measure may be prohibitive for certain applications in research and practice. Thus, the purpose of this project was to use item response theory (IRT) to identify sets of maximally efficient items (SMIs) for each subscale of the ACES-TF that could inform the development of an abbreviated version. Results supported the reliability and precision of SMI scores. As such, the SMIs demonstrate promise to inform the development of an abbreviated version of the ACES-TF. Keywords: Academic Competence Evaluation Scales, Nonacademic Skills, Item Response Theory
IDENTIFYING SETS OF MAXIMALLY EFFICIENT ACES-TF ITEMS
3
Public Significance Statement Although there is increasing interest in “noncognitive” factors that promote student academic achievement, it is difficult to efficiently measure these factors in practice. As such, this study applied advanced measurement techniques to identify the most efficient items from a behavior rating scale, the Academic Competence Evaluation Scales (ACES), which assesses several noncognitive factors (e.g., motivation, social skills). The identified set of efficient items includes fewer than half of the original ACES items but demonstrates similar levels of precision and psychometric properties.
IDENTIFYING SETS OF MAXIMALLY EFFICIENT ACES-TF ITEMS
4
Identifying Sets of Maximally Efficient Items from the Academic Competence Evaluation Scales-Teacher Form During the last two decades, there has been growing interest in the contributions of “noncognitive” variables in promoting academic achievement (e.g., Farrington et al., 2012). This trend has been fueled by the contention that, in addition to cognitive ability and academic skills, several other individual level variables are important for promoting personal and academic success (Duckworth & Yeager, 2015). Variables of interest in this domain include constructs such as motivation, self-control, and social skills. Despite increasing emphasis on these factors, significant measurement issues persist including insufficient reliability and the context dependency of many measures (Duckworth & Yeager, 2015). As such, there is need for development and validation of efficient measurement tools to assess student level factors promoting academic achievement. Several constructs similar to those currently characterized as noncognitive 1 variables have been studied for decades (e.g., Messick, 1979) and included in models of school learning (e.g., Carroll, 1963). Based on this research, DiPerna and Elliott (1999) hypothesized that student success in the classroom setting reflected both academic enablers and academic skills. Academic enablers are defined as attitudes and behaviors that allow a student to participate in and benefit from classroom instruction and include interpersonal skills, engagement, motivation, and study skills. Academic skills are defined as foundational skill domains typically targeted by academic curricula and include reading/language arts, mathematics, and critical thinking (DiPerna & Elliott, 2000). Subsequently, DiPerna and colleagues (e.g., Anthony, DiPerna, & Amato, 2014;
1
Although the term “noncognitive” is used in this paper, the authors share concerns raised about the adequacy of this label for the constructs of interest (e.g., Farrington et al., 2012; Messick, 1979). Because it is the most common currently used term for such constructs, we retain this label.
IDENTIFYING SETS OF MAXIMALLY EFFICIENT ACES-TF ITEMS
5
DiPerna, Volpe, & Elliott, 2005) tested models specifying interrelationships between academic enablers and academic achievement. Results of these studies supported the contributions of academic enablers in predicting academic achievement and indicated that prior achievement and interpersonal skills related to motivation, which in turn related to study skills and engagement, which directly impacted academic achievement. Academic Competence Evaluation Scales In addition to examining the impact of, and relationships between, academic enablers and skills, DiPerna and Elliott (2000) developed the Academic Competence Evaluation Scales (ACES) to assess these variables. Despite evidence suggesting the psychometric adequacy of scores from the teacher form of the measure (ACES-TF), the length of this measure may limit its use in several contexts. For example, the ACES-TF is too long for assessing all students at the universal level within a multi-tiered educational service delivery system, and it may present similar challenges even when used within the secondary (selective) level if there are approximately 15% of students who need to be assessed within a classroom. In addition, though used in a number of studies to date, the length of the ACES-TF may be problematic if participants are required to complete a number of outcome measures as excessive participant burden can jeopardize score validity due to boredom or fatigue (Galesic & Bosnjak, 2009). There are many methods for analyzing items to inform development of abbreviated versions existing measures (Widaman, Little, Preacher, & Sawalani, 2011). Several approaches rooted in the classical test theory of measurement have limitations such as the sample dependence of item parameters (Hambleton & Jones, 1993) and a tendency to overemphasize internal consistency estimates (Boyle, 1991). An alternate theory of measurement, item response
IDENTIFYING SETS OF MAXIMALLY EFFICIENT ACES-TF ITEMS
6
theory (IRT; Hambleton & Jones, 1993), offers several advantages for identifying the most efficient items to inform short form development. In IRT, an individual’s probability of a particular response (e.g., correctly answering a math question) is modeled as a mathematical function including two groups of parameters. First, an individual trait or ability parameter (commonly denoted as θ) represents the respondent’s level of the construct being measured. Second, various item parameters define how an item functions with respect to measuring that trait. If the proposed mathematical model is determined to fit empirical data adequately and other assumptions are satisfied (e.g., the assumption of unidimensionality; the assumption of local dependence), the estimated parameters defining the relationship between the latent trait and variations in item scores are deemed an accurate reflection of the assessment process and thus interpretable. The values of these parameters can be used for various applications, including evaluation of the adequacy and efficiency of test items (Thomas, 2011). There are several advantages of IRT relative to CTT including sample-independent item parameters and modeling score precision across a broad range of the trait being measured. Another important advantage is the focus of IRT on item parameters (rather than global functioning of tests). Such a focus enables various approaches to improving measurement efficiency such as selection of items to function for particular measurement contexts, and computer adaptive testing, in which predetermined algorithms select items from large banks to tailor tests to individual test takers during testing (Dodd, De Ayala, & Koch, 1995). In addition to these advantages, IRT has several limitations. Most of these limitations reflect the strong assumptions made by IRT models and the tendency of IRT models to not be robust to violations of these strong assumptions (Hambleton & Swaminathan, 1985).
IDENTIFYING SETS OF MAXIMALLY EFFICIENT ACES-TF ITEMS
7
Despite its advantages, IRT has only recently begun to be used to inform the development and refinement of student behavior rating scales due to various factors such as the lack of computer packages to conduct IRT analyses and high sample size requirements (Streiner, 2010). For example, Anthony, DiPerna, and Lei (2016) used IRT to identify sets of maximally efficient items (SMIs) for each subscale of the Social Skills Improvement System – Teacher Rating Scales (SSIS-TRS; Gresham & Elliott, 2008). Results indicated the number of items could be reduced by approximately 50% with minimal losses in measurement precision and similar levels of concurrent relationships with validity measures. These results demonstrate the potential promise of using IRT to identify SMIs of existing behavior rating scales to inform development of abbreviated measures. Rationale and Purpose There is growing interest in assessing noncognitive constructs in both research and applied settings. Although the ACES-TF was developed to assess several such constructs, its length is prohibitive for certain applications. Procedures rooted in IRT hold promise to inform identification of SMIs and abbreviated versions of student rating scales for use in school settings (Anthony et al., 2016). Thus, the purpose of this project was to identify SMIs for each ACES-TF subscale to inform the development of a potential abbreviated version of the measure. Method Participants Data from the standardization of the ACES-TF (DiPerna & Elliott, 2000) were used in the current study. Specifically, 455 students from first – fifth grade were included in the study (Table 1). Participants were roughly evenly split between boys and girls and were diverse across race, region, socioeconomic status, and educational status.
IDENTIFYING SETS OF MAXIMALLY EFFICIENT ACES-TF ITEMS
8
Measure The Academic Competence Evaluation Scales – Teacher Form (ACES-TF; DiPerna & Elliott, 2000) is a teacher rating scale measuring academic enablers and academic skills. The original ACES-TF includes four academic enabler subscales (Interpersonal Skills, Engagement, Motivation, and Study Skills) and three academic skills subscales (Reading/Language Arts, Mathematics, and Critical Thinking). Scores are generated for each subscale as well as each of the two total scales (Academic Enablers & Academic Skills). The ACES-TF includes 73 items rated on a 5-point Likert scale. Example items from the academic enabler subscales include interacts appropriately with adults (Interpersonal Skills), volunteers to read aloud (Engagement) and persists when task is difficult (Motivation). Example items from the academic skills subscales include reading comprehension (Reading/Language Arts) and drawing conclusions from observations (Critical Thinking). Scores from the ACES-TF have demonstrated evidence of internal consistency with Cronbach’s α coefficients ranging from .94 to .99 and 2-3 week stability coefficients ranging from .88 to .97 (DiPerna & Elliott, 2000). Further, studies of internal structure, convergent, and discriminant validity have provided support for use of the ACES-TF scores with students in K-12 settings (DiPerna & Elliott, 2000). Procedures Teachers completed the ACES-TF for 2 - 6 children that they identified from their classroom. Specifically, they rated a maximum of two students (one boy and one girl) within each of the following categories: (a) general education, (b) formally identified with a learning disability and receiving special education services, or (c) at risk for academic failure (i.e., achieving significantly below grade-level expectations but not identified with a disability). For teachers rating children in first and second grade, instructions were modified to include equal
IDENTIFYING SETS OF MAXIMALLY EFFICIENT ACES-TF ITEMS
9
numbers of students in the bottom, middle, and upper third of their class. Teachers also were asked to include at least two students of racial minority status (race identified as non-White in school records) within the sample of ACES-TF ratings from their class. Data Analysis All IRT analyses were conducted with IRTPRO Version 2 (Cai, Thissen, & duToit, 2011) and other analyses were conducted with SPSS version 22 (IBM, 2013). First, missing data were addressed in several ways. For cases missing more than 50% of their item-level ratings for a particular subscale (0.4% to 3.1% of cases across subscales), casewise deletion was employed in order to avoid imputation of values based on excessively incomplete data. The percentages of missing values for items after this casewise deletion ranged from 0 to 17.5 (median = 0.4). For these cases with missing data, two different procedures were used. First, because IRT overall fit and local dependence statistics are sensitive to matrix sparsity, the relative mean substitution (Raaijmakers, 1999) method of imputation was used to calculate these statistics from complete case datasets. To calculate parameter estimates, the resulting option and test characteristic curves, and model comparison fit statistics, the default Bock-Aitkin marginal maximum likelihood procedure (Bock & Aitkin, 1981) was applied. Polytomous IRT analyses were used to examine the measurement efficiency of the ACES-TF items. All analyses were conducted by subscale to preserve the content coverage of the ACES-TF and ensure that any resulting abbreviated measure would produce scale and subscale scores corresponding to those available for the original ACES-TF. First, relevant assumptions of IRT were checked by subscale. The assumption of unidimensionality was examined by conducting Exploratory Factor Analyses (EFA) on each of the subscales of the ACES-TF. Ratios of first to second eigenvalues (Reeve et al., 2007; ratios in excess of 4
IDENTIFYING SETS OF MAXIMALLY EFFICIENT ACES-TF ITEMS
10
supported unidimensionality) and scree plots supported unidimensionality in all cases. The assumption of local independence was assessed through examination of the local dependence χ2 values (Chen & Thissen, 1997) generated by IRTPRO. According to these indices, there was evidence for local dependence (i.e., local dependence χ2 values > 10) on multiple subscales of the ACES-TF, which were addressed during item analysis to ensure identified SMIs did not demonstrate local dependence. Subsequently, several polytomous IRT models were tested with each subscale: the Partial Credit Model (PCM; Masters, 1982), the Generalized Partial Credit Model (GPCM; Muraki, 1992), and the Graded Response Model (GRM; Samejima, 1970). Nested models were compared with χ2 difference tests and non-nested models were compared with comparative fit indices, such as the Akaike Information Criterion (AIC; Akaike, 1974). In all cases the GRM provided the best fit to the data compared with various other IRT models. Results Given its superior fit, item parameters were computed using the GRM. Resulting Item Information Curves and item content were used to inform identification of SMIs. Information levels at the range of -1.5 to -0.5 were emphasized given one of the primary goals for the ACESTF was to identify students who are at-risk. To provide an objective anchor to the process, a maximum increase of 50% of the estimated standard error (𝑆𝑆𝑆𝑆(𝜃𝜃) =
1
) was allowed at the θ
�𝐼𝐼(𝜃𝜃)
values of -1.5, -.7, and 0 for each subscale. When multiple item combinations resulting in similar levels of information were considered, item content was evaluated to maximize content coverage of resulting SMIs. In addition to these two primary criteria, SMIs were free of local dependence and fit the employed IRT model at least adequately as evidenced by RMSEA < .10 (MacCallum,
Browne, & Sugawara, 1996) as shown in Table 2. Due to initial content consideration, one item
IDENTIFYING SETS OF MAXIMALLY EFFICIENT ACES-TF ITEMS
11
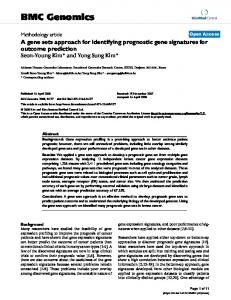
(Pays attention in class) was moved from the Study Skills subscale to the Engagement subscale. As a result of these procedures, a total of 32 items were retained across all SMI subscales (Table 2). After completing the item analysis process, preliminary reliability/precision analyses were conducted for each SMI subscale. Test Information Functions (TIFs) were compared between ACES-TF subscales and their corresponding SMIs. TIFs indicate the total information resulting from the sum of item information values across θ. Information values in the SMI subscales were consistently lower than in the ACES-TF subscales. Nevertheless, all subscales retained the shape of their ACES-TF counterparts. Furthermore, a formula that converts information to a standard reliability metric ranging from 0 to 1 (reliability = 1-[1/information]; Petrillo, Cano, McLeod, & Coon, 2015) was used to examine absolute levels of SMI score reliability. There were very few instances where the reliability estimates for an SMI subscale fell below .90 for either the Academic Skills subscales (when -2 < θ < 2 or Academic Enablers subscales (when -2.5 < θ < 1). Comparison TIFs for each ACES-TF and SMI subscale can be found in Figures 1 and 2. Discussion Overall, the SMIs retained a relatively high degree of precision considering that an abbreviated measure based on the SMIs would be 56% shorter than the original ACES-TF. Although there was a decrease in score precision relative to the ACES-TF, absolute precision remained high for all SMIs. Across broad ranges of θ, information values exceeded the .90 reliability threshold. Specifically, precision levels dropped slightly below (.89) this threshold for only one subscale (Critical Thinking) within a very limited range (-.20 < θ < -.10). Thus, the SMIs could inform the future development of a short form of the ACES-TF if further validated.
IDENTIFYING SETS OF MAXIMALLY EFFICIENT ACES-TF ITEMS
12
The outcomes of the current study are similar to those found by Anthony et al. (2016) when applying IRT to the Social Skills Improvement System – Teacher Rating Scale (SSIS-TRS; Gresham & Elliott, 2008). Specifically, both studies identified SMIs representing a large reduction in the number of items on popular behavior rating scales with similarly small decreases in score precision. Collectively, these studies demonstrate the potential for IRT to improve efficient measurement with behavior rating scales. There are several limitations to the current study. Although the study featured a relatively large and representative sample, additional studies are necessary to examine the ACES-TF SMIs with other samples of students to ensure the current findings are replicable. Also, the RMSEA value of the ACES-TF Reading/Language Arts subscale could only be calculated after removing an oral language item from the subscale. This may have been due to the multidimensional nature of the Reading/Language Arts subscale, which includes aspects of reading, oral language, and written language; however, the source of this error was eliminated in the item analysis process as the SMI Reading/ Language Arts subscale was associated with an acceptable RMSEA. As this was an issue only with the full length ACES-TF Reading/Language subscale and not the SMI in this domain, future research should examine the dimensionality of this ACES-TF subscale. Another direction for future research regards the dimensionality of the ACES-TF. Because the assumption of unidimensionality was met for all subscales and was consistent with prior research regarding the factor structure of the ACES (e.g., DiPerna & Elliott, 2000; DiPerna, 2004), we did not test for potential hierarchical or multidimensional structure of the ACES-TF. Nonetheless, it is unknown if a multidimensional model better represents the structure at this time. Future studies should examine and compare alternative models with the ACES-TF (e.g.,
IDENTIFYING SETS OF MAXIMALLY EFFICIENT ACES-TF ITEMS
13
second order, bifactor, or correlated factors model), and, if necessary, employ multidimensional IRT to further evaluate the efficiency of ACES-TF items. Finally, it should be noted that the SMIs identified in this study were designed to be “maximally efficient” for students in the at-risk range. Thus, the identified SMIs may not be the most efficient combination of ACES-TF items for other purposes (e.g., measurement across the whole spectrum of θ). Given the high overall level of SMI score precision, a further validated abbreviated version of the ACES-TF based on the identified SMIs holds promise for research and practice applications. Within schools, examples of potential applications include providing a second level of assessment within a multi-phase screening procedure or serving as a progress monitoring measure for small-group interventions targeting ACES-TF constructs. Within research contexts, an ACES-TF short form based on the identified SMIs could yield several benefits such as reduced missing data (Stanton, Sinar, Balzer, & Smith, 2002), increased validity (Galesic & Bosnjak, 2009), and the ability to include more ACES-TF subscales within a research protocol. Furthermore, the identified SMIs offer researchers an alternative to ad-hoc short form development procedures that produce scores of unknown technical adequacy. Although additional psychometric studies of the ACES-TF SMIs are necessary before they could be used in practice, evidence from the current study provides initial support for their psychometric adequacy. Furthermore, results provide additional justification for the use of IRT to refine existing behavior rating scales. Given the growing interest in noncognitive factors and longstanding challenges for adequate measurement of such constructs, the ACES-TF SMIs, and the methods used to identify them, hold promise to advance educational research and practice.
IDENTIFYING SETS OF MAXIMALLY EFFICIENT ACES-TF ITEMS
14
References Akaike, H. (1974). A new look at the statistical model identification. IEEE Transactions on Automatic Control, 19, 716–723. doi: 10.1109/TAC.1974.1100705 Anthony, C. J., DiPerna, J. C., & Amato, P. R. (2014). Divorce, approaches to learning, and children’s academic achievement: A longitudinal analysis of mediated and moderated effects. Journal of School Psychology, 52, 249-261. doi:10.1016/j.jsp.2014.03.003 Anthony, C. J., DiPerna, J. C., & Lei, P.W. (2016). Maximizing measurement efficiency of behavior rating scales using item response theory: An example with the Social Sills Improvement System - Teacher Rating Scale. Journal of School Psychology, 55, 57-69. doi:10.1016/j.jsp.2015.12.005 Bock, R. D. & Aitkin, M. (1981). Marginal maximum likelihood estimation of item parameters: Application of an EM algorithm. Psychometrika, 46, 443-459. doi: 10.1007/BF02293801 Boyle, G. J. (1991). Does item homogeneity indicate internal consistency or item redundancy in psychometric scales? Personality and Individual Differences, 12, 291-294. doi:10.1016/0191-8869(91)90115-R Cai, L., Thissen, D., & du Toit, S. H. C. (2011). IRTPRO for Windows [Computer software]. Lincolnwood, IL: Scientific Software International. Carroll, J. B. (1963). A model of school learning. Teachers College Record, 64, 723-733. Chen, W. H., & Thissen, D. (1997). Local dependence indices for item pairs using item response theory. Journal of Educational and Behavioral Statistics, 22, 265-289. doi: 10.3102/10769986022003265 DiPerna, J. C. (2004). Structural and concurrent validity evidence for the Academic Competence Evaluation Scales-College edition. Journal of College Counseling, 7, 64-73.
IDENTIFYING SETS OF MAXIMALLY EFFICIENT ACES-TF ITEMS
15
DiPerna, J. C., & Elliott, S. N. (1999). Development and validation of the academic competence evaluation scales. Journal of Psychoeducational Assessment, 17, 207-225. DiPerna, J. C., & Elliott, S. N. (2000). Academic Competence Evaluation Scales. San Antonio, TX: The Psychological Corporation. DiPerna, J. C., Volpe, R. J., & Elliott, S. N. (2005). A model of academic enablers and mathematics achievement in the elementary grades. Journal of School Psychology, 43, 379-392. doi: 10.1016/j.jsp.2005.09.002 Dodd, B. G., De Ayala, R. J., & Koch, W. R. (1995). Computerized adaptive testing with polytomous items. Applied Psychological Measurement, 19, 5–22. Duckworth, A. L., & Yeager, D. S. (2015). Measurement matters: Assessing personal qualities other than cognitive ability for educational purposes. Educational Researcher, 44(4), 237-251.379-392. doi: 10.1016/j.jsp.2005.09.002 Farrington, C.A., Roderick, M., Allensworth, E., Nagaoka, J., Keyes, T.S., Johnson, D.W., & Beechum, N.O. (2012). Teaching adolescents to become learners. The role of noncognitive factors in shaping school performance: A critical literature review. Chicago: University of Chicago Consortium on Chicago School Research. Galesic, M., & Bosnjak, M. (2009). Effects of questionnaire length on participation and indicators of response quality in a web survey. Public Opinion Quarterly, 73, 349–360. doi: 10.1093/poq/nfp031 Gresham, F. M., & Elliott, S. N. (2008). Social Skills Improvement System: Teacher Rating Scales. Bloomington, MN: Pearson Assessments.
IDENTIFYING SETS OF MAXIMALLY EFFICIENT ACES-TF ITEMS
16
Hambleton, R. K., & Jones, R. W. (1993). Comparison of classical test theory and item response theory and their applications to test development. Educational Measurement: Issues and Practice, 12, 38-47. Hambleton, R. K., & Swaminathan, H. (1985). Item response theory: Principles and applications. Boston: Kluwer. IBM Corp (2013). IBM SPSS Statistics for Windows, Version 22.0. Armonk, NY: IBM Corp. MacCallum, R. C., Browne, M. W., & Sugawara, H. M. (1996). Power analysis and determination of sample size for covariance structure modeling. Psychological Methods, 1, 130-149. doi: 10.1037/1082-989X.1.2.130. Masters, G. N. (1982). A rasch model for partial credit scoring. Psychometrika, 47(2), 149-174. doi: 10.1007/BF02296272 Messick, S. (1979). Potential uses of noncognitive measurement in education. Journal of Educational Psychology,71, 281-292. doi: http://dx.doi.org/10.1037/0022-0663.71.3.281 Muraki, E. (1992). A generalized partial credit model: Application of an EM algorithm. Applied Psychological Measurement, 16, 159-176. doi: 10.1177/014662169201600206 Petrillo, J., Cano, S. J., McLeod, L. D., & Coon, C. D. (2015). Using classical test theory, item response theory, and rasch measurement theory to evaluate patient-reported outcome measures: A comparison of worked examples. Value in Health: The Journal of the International Society for Pharmacoeconomics and Outcomes Research, 18, 25-34. doi: 10.1016/j.jval.2014.10.005 Raaijmakers, Q. A. W. (1999). Effectiveness of different missing-data treatments in surveys with likert-type data: Introducing the relative mean substitution approach. Educational and Psychological Measurement, 59, 725-748. doi: 10.1177/0013164499595001
IDENTIFYING SETS OF MAXIMALLY EFFICIENT ACES-TF ITEMS
17
Reeve, B. B., Hays, R. D., Bjorner, J. B., Cook, K. F., Crane, P. K., Teresi, J. A., ... & Liu, H. (2007). Psychometric evaluation and calibration of health-related quality of life item banks: Plans for the Patient-Reported Outcomes Measurement Information System (PROMIS). Medical Care, 45, S22-S31. doi: 10.1097/01.mlr.0000250483.85507.04 Samejima, F. (1970). Estimation of latent ability using a response pattern of graded scores. Psychometrika, 35(1), 139-139. doi: 10.1007/BF02290599 Stanton, J. M., Sinar, E. F., Balzer, W. B., & Smith, P. C. Issues and strategies for reducing the length of self-report scales. Personality Psychology, 55, 167-194. doi: 10.1111/j.17446570.2002.tb00108.x Streiner, D. L. (2010). Measure for measure: new developments in measurement and item response theory. The Canadian Journal of Psychiatry, 55(3), 180-186. Thomas, M. L. (2011). The value of item response theory in clinical assessment: a review. Assessment, 18(3), 291-307. doi: 10.1177/1073191110374797 Widaman, K. F., Little, T. D., Preacher, K. J., & Sawalani, G. M. (2011). On creating and using short forms of scales in secondary research. In K. H. Trzesniewski, M. B. Donnellan, & R. E. Lucas (Eds.), Secondary data analysis: An introduction for psychologists (pp. 3961). Washington, DC: American Psychological Association.
IDENTIFYING SETS OF MAXIMALLY EFFICIENT ACES-TF ITEMS
18
Total Information
Mathematics
Total Information
Reading/Language Arts
θ
θ
Total Information
Critical Thinking
θ ACES-TF Information
SMI Information
.90 Reliability Threshold
Figure 1. Comparison of Test Information Functions (TIFs) for Academic Competence Evaluation Scales – Teacher Form (ACESTF) Academic Skills Subscales and corresponding Sets of Maximally Efficient Items (SMI).
IDENTIFYING SETS OF MAXIMALLY EFFICIENT ACES-TF ITEMS
19
Total Information
Engagement
Total Information
Interpersonal Skills
θ Motivation Total Information
Total Information
θ Study Skills
θ ACES-TF Information
θ SMI Information
.90 Reliability Threshold
Figure 2. Comparison of Test Information Functions (TIFs) for Academic Competence Evaluation Scales – Teacher Form (ACESTF) Academic Enabler Subscales and corresponding Sets of Maximally Efficient Items (SMI).
IDENTIFYING SETS OF MAXIMALLY EFFICIENT ACES-TF ITEMS Table 1 Demographic Characteristics (Percentages) of Participant Sample by Sex Girls (n = 221)
Boys (n = 234)
Race White 63 63 Black 16 16 Hispanic 15 14 Other 6 7 Grade First 21 22 Second 23 24 Third 16 16 Fourth 22 23 Fifth 18 15 Region Northeast 24 26 Northcentral 20 22 South 29 28 West 28 24 Educational Status General Education 77 71 Special Education 8 9 At Risk 15 19 SES Low 29 24 Low-Middle 15 12 Middle 24 32 Middle-High 15 13 High 9 7 Note. Some total percentages do not sum to 100 due to missing data and/or rounding.
20
IDENTIFYING SETS OF MAXIMALLY EFFICIENT ACES-TF ITEMS Table 2 Number of Items and RMSEAs for SMI and ACES-TF Subscales Number of Items SMI ACES-TF
RMSEA SMI ACES-TF
Academic Skills Reading/Language Arts 6 11 .09 .13b Mathematics 4 8 .07 .08 Critical Thinking 4 14 .07 .07 Academic Enablers Interpersonal Skills 5 10 .04 .06 Engagement 4a 8 .06 .05 Motivation 5 11 .07 .05 Study Skills 4 11 .03 .04 Note. RMSEA = Root Mean Squared Error of Approximation; ACES-TF = Academic Competence Evaluation Scales – Teacher Form; SMI = Set of Maximally Efficient Items a Includes one item from the original ACES-TF Study Skills subscale b ACES-TF Reading/Language Arts RMSEA reflects 10 items.
21