1
Impact of IPv4 Address Allocation Practice on BGP Routing Table Growth Zhiguo Xu, Xiaoqiao Meng, Lixia Zhang, Songwu Lu Department of Computer Science University of California, Los Angeles Los Angeles, CA 90095 {zhiguo, xqmeng, lixia, slu}@cs.ucla.edu
Abstract— Rapid BGP routing table growth has been a main concern for the operation of the Internet in recent years. In this paper, we study how current IPv4 address allocation practice affects the BGP table growth. The practice includes both the newlymade allocations and two address policies, i.e., allocation size and minimum allocation size. We first found that the address blocks allocated during the past five years contributed to more than 71% of the BGP table growth within the same period. Moreover, contributions made by allocated address blocks quickly become static after the allocation. Based on this observation, we propose an empirical model to emulate the table growth. We next study the impact of two address policies and show that while the ”allocation size” policy is observed to have visible impact on the growth, there is no clear evidence that the ”minimum allocation size” policy, designed for slowing down the table size increase, has suppressed the growth. We finally discuss how the address policies could have better controlled the BGP table growth.
I. I NTRODUCTION In the current Internet practice, IPv4 addresses are allocated in a hierarchical manner. Four regional Internet registries (RIRs), i.e., ARIN, RIPE NCC, APNIC and LACNIC, are responsible for allocating IPv4 address blocks to Internet service providers (ISPs). These ISPs will further assign IP addresses from their allocated address blocks to the end users. The BGP [3] routing table size has been growing rapidly in recent years. It has well doubled from January 1998 to December 2002. The continued growth of the routing table size raises grave concerns regarding the scalability, stability, management, and increased dynamics of the BGP routing system. To keep the BGP table growth in check, it is desirable to have a better understanding about the composition of the growth. Since each address block should be announced into the routing system after the allocation, potentially there is some intimate relationship between the address allocation practice and the table growth. Previous studies [13][14] have shown that a large number of prefixes that could have been aggregated into a shorter prefix are announced individually. In these studies, the identified factors driving the BGP table’s growth including load balancing, multi-homing and etc. However, the impact of address allocation on the routing table growth has not been fully investigated. In this paper, we present a quantitative study on how IPv4 address allocation practice affects the BGP routing table growth. The studied practice includes (1) each newly made address allocation; (2) two important address policies, address allocation
Cathy J. Wittbrodt Packet Design 3400 Hillview ave, Building 3 Palo Alto, CA 94304.
[email protected]
size and minimum address allocation size (MAS) for CIDR portion1 . The measurement is mainly based on allocation made in the past five years, i.e., from January 1, 1998 to December 31, 2002, which is referred to as new allocation for brevity. We first analyze the advertisement of the new allocation. The results show that the new allocation is typically announced into the routing table in a timely fashion and being used persistently. Specifically, over 84% of allocated blocks are used within 60 days, and on average an address block is globally routable for 96.8% days since the first time it was announced. Moreover, the result shows that the contribution of address allocation to the table growth diminishes quickly with the elapse since the allocation. The overall growth of BGP routing table size is the composite effect of advertisement of new routing prefixes and disappearance of old prefixes in the same order of magnitude. Although address blocks allocated at all times could engage in the growth of global routing table size, the address blocks allocated more than three years ago have almost no impact on the growth since they tend to bring in and take away the same amount of routing prefixes. Finally, we examine two allocation policies that the RIRs have taken to withhold the BGP table size from growing too rapidly. The first policy is the allocation size. The second is to publicize minimum allocation size for each CIDR portion to encourage route filtering. Our measurements show that the policy of allocation size does have obvious effect on the table growth while the impact of MAS is not obvious. We note that a recent work [20] also discusses the impact of address allocation on the BGP table. However, the main focus of [20] is to analyze and model the evolution of the BGP routing table structure. Instead, we focus on analysis of real measurement data and address allocation policies. The rest of the paper is organized as follows. Section II provides background introduction, and describes the data source and methodology used in this study. Section III characterizes the advertisement of new allocation. Section IV models the relationship between the table growth and the IPv4 address allocation. Section V analyzes the impact of two allocation policies on the BGP table size growth. Section VI discusses some implications of our results and Section VII concludes the paper. 1 The policy of MAS prescribes the minimum allocation size for certain CIDR address portions, and these minimum values are generally recommended for prefix filtering. In this sense, MAS can also be regarded as a filtering policy.
A. IPv4 address allocation records We obtain the IPv4 address allocation archives for the four RIRs from [8], since RIRs require each address request or delivery be officially recorded, we consider these archives to be complete and account for the majority of IPv4 addresses being used. B. BGP routing table data We obtain the BGP routing tables from two data sources: the Oregon Route-Views project [9] and RIPE NCC Amsterdam [10]. The Route-Views router establishes peering sessions with a number of Internet backbone routers and collects routing updates since November 1997. The second data source, RIPE NCC, Amsterdam [10], is collected from a different set of BGP routers since September 1999. Due to the nature of the highly distributed global routing system, no magic vantage point can capture all the BGP routing prefixes in the entire Internet. We therefore merge the routing tables from both data sources on a daily basis. Consequently, the daily routing tables used in this study are solely from Route-Views between 01/01/1998 and 08/31/1999 and from the combination of both sources from 09/01/1999 to 12/31/2002, the end of the study period. Given that both Oregon Route-Views and RIPE RRC peer with a number of major ISP backbones, the BGP snapshots provided by our merged data should be close to the complete set of the globally advertised routing information. To evaluate the completeness of the merged BGP data, we resort to a third set of BGP tables collected by the LINX monitoring site in London [11]. By comparing the LINX data with our merged BGP snapshots, we find that their difference is minor. Among the 100K routing prefixes contained by a BGP snapshot in the merged data, only less than 1% are not contained by the LINX data. This is also true conversely. We therefore believe that our merged routing table data provides a good view to the globally advertised routing prefixes. 2 RFC2050
[7] sets forth some allocation guidelines. However the allocation policies in practice may vary in different RIRs.
4
10
3
10
Number of allocated blocks
II. BACKGROUND , DATA S OURCE AND M ETHODOLOGY The current IPv4 address space is managed by the four RIRs. Allocation and management policies have been evolving over time to better serve the fast-growing Internet2 . Since 1993, Classless Inter-Domain Routing (CIDR) is adopted to allocate address blocks. CIDR retains the notion of identifying networks by address prefixes, but allows a flexible boundary between the network-prefix and the host-number field. For example, CIDR permits the allocation of 64.4.176.0/20, where 64.4.176.0 is the network prefix and 20 is the prefix length. This allocated prefix contains 212 unique IP addresses. CIDR provides a flexible address allocation and enables an efficient utilization of the address space. In this paper, we study the address allocation during a fiveyear period dating from January 1 1998 to December 31 2002. We call allocation made in this study period as new allocation. Accordingly, allocation made before this period is called old allocation. The used data sets include both allocation records and BGP data.
2
10
1
10
0
10 0 10
1
10 Usage latency (week)
2
10
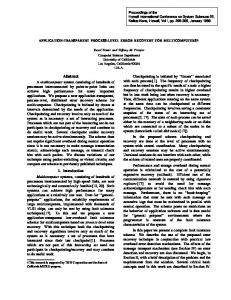
Fig. 1. Log-log distribution of usage latency (the fit line has slope -1.77. The time unit for usage latency is one week.)
III. A DVERTISEMENT OF NEW ALLOCATION To utilize an address block newly allocated from the RIRs, ISPs are required to advertise appropriate routing prefixes into the global routing system, thereby driving the BGP table growth. In this section, we study the advertisement of newly allocated blocks and see how this advertisement is related to the BGP table growth. Specifically, we seek to answer the following three questions: (1) How fast a newly allocated block gets used? In other words, how long does it take a newly allocated address block to be advertised in the BGP table? (2) Once a new address block is used, is it consistently shown up in the BGP table? (3) Once an address block is advertised, is it using the same prefix form as the one being allocated? A. Usage latency To answer the first question, we define usage latency for each newly allocated block, which is equal to the time interval between the allocation time and the earliest time that the block is shown up in the BGP table. We calculate the usage latency for all the new allocated blocks and plot the distribution in Figure 1. It shows that the number of blocks with usage latency τ is exponentially decreasing with the increase of τ . In total, 90% allocated blocks have usage latency less than 70 days. The average usage latency is 44 days. Since the most popular allocation size in the study period is /16, /19 and /20, we also calculate the usage latency for allocation with size /16, /19 and /20, separately. The detailed results are provided in our technical report [19]. B. Advertisement persistency In our second measurement, we examine how persistently an allocated block is shown up in the BGP table. The result shows that 90% new allocation, after their first advertisement, will be shown up in 97% daily BGP tables. This observation shows that once an allocated block gets used in the BGP table, its existence can be well assumed to be lasting. C. Breakdown of BGP table size growth After the RIRs delegate address blocks to ISPs, the ISPs can make the addresses globally reachable in one of the three advertisement patterns, i.e., identical advertisement, fragmentation
4
18
x 10
16
14 Actual table size
Routing table size
12 No identical fragmentation 10 No fragmentation 8 No new allocation 6
4
2
0 01/98
Fig. 2.
06/98
12/98
06/99
12/99
06/00 Time
12/00
06/01
12/01
06/02
12/02
Routing table size change
and aggregation. These three advertisement patterns make different contribution to the BGP table size growth. We therefore conduct measurements to understand how much of the BGP table size growth is caused by the three different advertisement patterns. The curve marked as actual table size in Figure 2 represents the BGP table size change in the study period. We can see that the size is more than doubled, that is, 55k on 01/01/1998, while 125k on 12/31/20023 . Despite such an increase, if we remove all the routing prefixes resulting from new allocation, the table size turns out to merely increase from 55k to 70k, as can be observed from the curve marked as no new allocation in Figure 2. We conclude that among the 70k growth in the study period, only 20k are relevant to the old allocation (allocation before 01/01/1998) while the other 50k are from new allocation. The underlying intuition is that more newly allocated blocks tend to be more active in terms of bringing in more routing prefixes. Such a point will be further elaborated in Section IV. D. BGP table growth caused by different advertisement patterns First of all, we evaluate the table growth caused by fragmentation. We do this by adopting a “removal while preserving connectivity” strategy. Specifically, for a given BGP table, we check every routing prefix X and determine whether the addresses that X contains come from a new allocation. If it is true, say, X is originated from an allocated address block Y , we then start to look through the entire BGP table to see whether there exist any other routing prefixes that can summarize X. If such prefixes exist, we know that removing X from the BGP table still preserves its global connectivity, we then safely remove X and decrease the BGP table size by one. On the other hand, if no such a routing prefix exists, we then need to inject a virtual routing prefix Y into the BGP table, remove X and keep the 3 There are two dramatical spikes in the period [Dec. 2000, June 2001]. These were caused by misconfigurations and have been explained in [13].
BGP table size unchanged. The essence of the “removal while preserving connectivity” strategy is to see to what extent the BGP table can be reduced without losing any global reachable address. We apply the above strategy to every daily BGP table and recalculate the table size accordingly, thereby resulting in a different BGP table size growth which is represented by the curve marked as no fragmentation in Figure 2. The curve clearly demonstrates the popularity of fragmentation. If all the new allocation are advertised without fragmentation, the BGP table size growth is much slower, and it is actually very close to the BGP table size growth when no new allocation is made at all. Take the BGP table on 12/31/2002 as an example, without fragmentation the size would shrink from 125k to 80k, nearly one third cut-down. Secondly, by using a similar strategy, we evaluate the popularity of identical advertisement and represent the adjusted BGP table size growth by the second highest curve in Figure 2 (marked as no identical advertisement). It shows that removing identical advertisements can roughly cut down the BGP table size by less than 5k. This number is almost half of the total number of new allocation, which is 9937. Finally, we consider aggregation advertisements. However, they only account for less than 0.5% of the BGP table size. We therefore did not plot it in Figure 2. To summarize the above observations, we conclude that 27 of the table size growth in the study period is caused by old allo4 cation. About 57 ∗ 45 55 ≈ 7 of the growth comes from fragmentation of new allocation. While the other 17 are due to identical and aggregation advertisements. IV. A N E MPIRICAL MODEL FOR THE BGP TABLE GROWTH In the previous section, we characterize the advertisement of allocated blocks, we now set out to measure and model the numerical relationship between the new allocated blocks and the table growth. We adopt a novel approach to decomposing the table growth into two components: prefix appearance and prefix disappearance. Both components are identified to be more likely related to the new allocation. By quantifying the relationship between the new allocation and the two components, we infer that address blocks allocated more than three years ago do not make effective contributions to the BGP table growth any more. Such an observation enables us to create an empirical model to emulate the BGP table growth. A. Composition of the BGP table growth As shown in Figure 2, the general trend of the BGP table growth fits in a monotonic increasing curve with occasional setbacks. A close examination shows that the table growth is far more dynamic than the curve looks like. In our analysis, the study period is divided into 10 time intervals each of which is a half year. As shown in Figure 3, the growth in each interval is a combination of new prefixes being advertised and old prefixes being removed. These two components make opposite contribution to the table growth, and the number of each of them in each time interval is of the same magnitude order. So we set out to characterize these two components separately.
4
x 10
newly!advertised prefixes disappeared prefixes
4
Routing table change in number of prefixes
3.5
3
2.5
2
1.5
1
0.5
0 [1998!1]
[1998!2]
[1999!1]
[1999!2]
[2000!1]
[2000!2]
[2001!1]
[2001!2]
[2002!1]
[2002!2]
Study Interval (YYYY!1/2: first/second half year of YYYY)
Percentage of allocated blocks involved in the routing table change
Fig. 3. Composition of BGP table growth at six-month time interval
Allocated blocks involved in appearance of prefixes fit 1 Allocated blocks involved in disappearance of prefixes fit 2
0.8
0.7
0.6
0.5
0.4
0.3
0.2
0.1
0 0
1
2 3 4 5 6 7 8 Age (The elapse time, in unit of 6!month, since the blocks were allocated)
9
Fig. 4. The activity of address allocation vs. the age
B. Composition of table growth contributed by new allocation In this analysis, the allocated address blocks are also divided into half-year bins based on their allocation time. As shown in sub-section III-A, the typical usage delay for newly allocated blocks is 2 months. Since the time granularity is six-month, we can safely ignore the usage delay and assume that address blocks are advertised immediately after their allocation. In addition, from Section III-B we know that the advertisement persistency for address blocks is pretty high (97%), thus we can assume that an allocated block, once gets used, will always show up in the BGP table. Figure 4 shows how actively the allocated blocks are engaged in the two components, i.e., new prefix advertisement and old prefix disappearance. X-axis is the age, defined as the elapsed time since allocation. Y-axis represents the number of allocated
Nubmer of prefix changes contributed by one allocated block
40 Newly advertised prefixes contributed by one allocated block fit 1 Disappeared prefixes contributed by one allocated block fit 2
35
30
25
20
15
blocks with a certain age that are involved in either of the two components. We emphasize that the figure is plotted by averaging over all the new allocation. The two curves in Figure 4 are termed as degree of positive involvement and degree of negative involvement in the paper. From the figure we can see that once address blocks are allocated by the RIRs, 80% of them will immediately bring in new routing prefixes to the global routing system. The degree of positive involvement decreases rapidly in its early stage and eventually keeps relatively stable, showing a trend to be close to zero though never reach zero. It implies that when we decompose the table growth during any study period, there will always exist address blocks allocated long ago still contributing to new prefix advertisement. On the other hand, the degree of negative involvement is growing steadily over the age. It reaches a stable line very close to the degree of positive involvement when the age is larger than three years. The merging between the tails of the positive involvement degree and negative involvement degree indicates that for address blocks allocated more than three years ago, almost equal percentage of them will be involved in the new prefix appearance and old prefix disappearance. We speculate that address blocks allocated more than three years ago make almost no effective contribution to the BGP table size growth. The above speculation is further confirmed by Figure 5, which depicts the number of newly appeared prefixes and disappeared prefixes contributed by a single address block (in the sense of average). For allocated blocks that are involved in prefix appearance, each of them contributes 5-6 new prefixes regardless of the age. While for allocated blocks involved in prefix disappearance, each of them corresponds to 4-6 removed prefixes4 . Based on the above observations, we conclude that the BGP table size growth is mainly caused by the different degree of positive and negative involvements of those recently allocated address blocks. C. The implication of prefix appearance and prefix disappearance We have seen that in terms of the BGP table size growth, the impact of allocated address blocks is approximately stable with the increase of their age. We now show that this is also true in terms of the address consumption, namely, the total number of routable addresses in the BGP table. a) Prefix appearance: Newly-advertised prefixes do not necessarily increase the IP address consumption of the routing table because their address space has already been covered by existing prefixes. In the study period, about 35.6% newly appeared prefixes do not bring in new addresses. While for the newly prefixes coming from old address allocation, over 67.5% of them fall into this category.
10
5
0
0
1
2 3 4 5 6 7 8 Age (The elapse time, in unit of 6!month, since the blocks were allocated)
9
Fig. 5. The contribution of individual active address blocks vs. the age
4 Intuitively, when an address block is newly allocated, it cannot be involved in the prefix disappearance during that period. In both Figure 4 and Figure 5, for those data points at age 0, the involvement of address allocation in the prefix disappearance shows to be non zero. This is due to a small number of address blocks that have been used shortly before the registry time, which has been ignored in our analysis.
5
1.4
x 10
1.35
The size of global routin table
b) Prefix disappearance: Where have the large number of disappeared prefixes gone? Have they caused the loss of total routable addresses? To answer these two questions, we find that the address space contained by 78.3% disappeared prefixes is still covered by remaining prefixes. Only the other 21.7% disappeared prefixes cause addresses loss. This shows that most of the allocated addresses involved in the prefix disappearance are still being used, although they are used in different routing prefix forms.
1.3 1.25 1.2 1.15
1.05 1 01/03
D. An empirical model for the BGP table size growth Based on the above observation that recent blocks have different level of involvements in the new prefix appearance and prefix disappearance, thereby resulting in variation of the BGP table size, we build an empirical model to simulate the prefix appearance and disappearance process based on the address allocation history. The BGP table size growth drawn from the model is demonstrated to be very close to the real data. The model aims to estimate the BGP table size growth from time t − 1 until t based on the address allocation made no more than three years earlier than t. We choose a six-month period as the time unit to reduce the monthly variance. As shown in Figure 4, the percentage of allocated blocks contributing to new prefix appearance is exponentially decreasing over the age. We thus formulate it as PA(x) in which x is the age. We further use NB(x) to represent the amount of address blocks allocated at time t-x. As shown in Figure 5, each positively involved allocated block contributes 6 newly appeared prefixes, which consequently is fixed in the formula. Eventually, we model the component of new prefix appearance as ! (P A(x)) × N B(x)! × 6. We model the component of old prefix disappearance as (P D(x)) × N B(x) × 6, where PD(x) is the percentage of blocks (allocated at time t-x) that are involved in prefix disappearance. The combination of these two components, as shown in the following formula, is used to simulate the absolute table size growth. yrs "
3
TableSize(t)
= TableSize(t − 1) +
(P A(age)
age=0
−P D(age)) × N B(age) × 6 Where TableSize(t)
= Table size at time t
age = Elapsed time since allocation until t P A(x) = 0.4372e−1.185x + 0.3154e−0.05469x
240 (#of monthly allocated blocks) 140 (#of monthly allocated blocks) 100 (#of monthly allocated blocks) data from route!view
1.1
02/03
03/03
04/03
05/03
06/03 07/03 Date
08/03
09/03
10/03
11/03
12/03
Fig. 6. Routing table growth based on different allocation prediction
increase number 6215 fairly well. Further, we assume the number of monthly allocated blocks keeps invariant during 2003. In Figure 6, we set this number to 100, 140 and 240, where 100 is the average number of monthly allocated blocks in 1998, which is the lowest one in the last five years, 240 is the average number of monthly allocated blocks in 2000, which is the largest one in the last five years, and 140 is the average number in 2002. Based on the model and the three different settings, we predict the BGP table size and plot the predicted curve in Figure 6. We also plot the actual table growth curve in the figure by a solid line. Such an actual table growth is based on routing table snapshots collected at Route-Views in the first five months in 2003. As we can see, the predicted curve matches the actual data well, i.e., the biggest gap between the two curves is merely 1.6%. In the last five years, over 75% new allocation takes prefix forms /18, /19 and /20, and over 92.6% allocated blocks are labeled as “allocated,” which means that they are mostly allocated to ISPs for subsequent assignment. So the properties shared among the new allocated blocks imply a clear trend of address allocation practice. Based on this observation, our empirical model should hold true in the near future if other contributing factors such as traffic steering and multi-homing, do not change abruptly. V. T WO ALLOCATION POLICIES Up to this point, we have studied the contribution made by recent allocation to the BGP table growth, and we also provide an empirical model to predict the trend of such a growth. We now examine the impact of two important allocation policies, i.e., allocation size and minimum allocation size (MAS). A. Allocation size
Since the deployment of CIDR, RIRs have been encouraging P D(x) = 0.3013e − 0.2614e hierarchical routing by allocating comparatively large blocks to NB(x) = Number of address blocks allocated at t − x upstream ISPs, and expecting those upstream ISPs to announce When we build this model, we only study the activity and a single routing prefix. The rationale behind this is that larger contribution of address blocks that are allocated in the last five allocated blocks give the upstream ISPS more freedom to manyears. We claim that this has already captured the significant age their addresses. At the same time the ISPs are expected to impact of the allocated address blocks on the table growth. For better summarize the downstream ISPs’ individual announceexample, in the second half year of 2002, according to our ments, therefore few long (specific) routing prefixes should be model which only involves allocation from 1999 to 2002, the injected into the global routing system. If this rationale really increase in table size is 6005, which approximates the actual takes effect in practice, the advertisements resulted from larger −0.0498x
−0.9251x
MAS Number of portions Allocation made from Average number of fragments (per allocation) Average fragment length
80% Allocation size: 16 Allocation size: 18 Allocation size: 19 Allocation size: 20
70%
60%
Percentage
50%
/19 1 26% 2.7 23.1
/20 31 49% 5.7 22.4
/24 3 22% 6.1 23.5
TABLE I
40%
35
ADDRESS PORTIONS USED IN THE STUDY PERIOD
30%
20%
10%
16
80%
18
20
22 24 Allocation size
26
28
30
60%
Fig. 7. Distribution of fragments from allocation with size 16, 18, 19
50%
Percentage
and 20
MAS=19 MAS=20 MAS=24
70%
40%
30%
allocated blocks should have lower percentage of long prefixes. Our measurement shows that there really exist clues to support this argument. We restrict our study to four allocation size, /16, /18, /19 and /20, since 83% of the new allocation take these forms. The BGP table used in our measurement came from 12/31/2002. For each allocation size, we find out all the allocated blocks as well as all the resulting fragments. The distribution of the fragment size is calculated and normalized based on the number of allocation. The result is depicted in Figure 7. A data point (l, p%) on the curve with allocation size s means that for all the new allocation with size s, p% of the fragments generated from them take prefix form /l. From the figure, We can see that although for every allocation size the most popular fragment form is still /24, the percentage of such /24s decreases with the increase of allocation size. For allocation size /16, 52% of the advertisements are /24s, while for allocation size /20, 76% of the advertisements are /24s. Considering the large number of advertisements generated from each allocation, such a percentage discrepency means a lot in terms of the number of routing prefixes. B. Minimum allocation size RIRs make allocation from their own portions that are initially assigned by the IANA. Currently, for each portion of address space, RIRs declare a minimum allocation size (MAS) to prescribe the legitimate minimum size for any allocation made from that portion. In practice, MAS is typically recommended as a starting point for devising a prefix filter, e.g., if a BGP router is aware of the MAS value for a certain address portion, it can safely filter all those advertised routing prefixes that come from the portion while longer than the MAS value. In this section, we will examine the potential impact of MAS on the advertisement of allocated blocks. We first observe that 97.5% of the new allocation are made from 35 address portions. Moreover, in the BGP table on 12/31/2002, 98.5% of the routing prefixes generated from the new allocation are actually resulted from these 35 portions. We conclude that these 35 address portions explain the majority of address allocation in the study period and therefore focus on them in the following measurement. The 35 portions have three different MAS: 19, 20 and 24 (see Table I). We therefore classify them into 4 classes. In each class, we find that the actual allocation size could be far larger
20%
10%
18
20
22
24 Fragment length
26
28
30
Fig. 8. Advertisement length distribution for allocation made from portions with MAS /19, /20 and /24
than the MAS. As a matter of fact, for all these three classes, /19 and /20 are always the most popular allocation size. After our discussion with people in NANOG, we believe that such an inconsistency between the actual allocation size and MAS is caused by several reasons: (1) Several portions fall into the old Class C address space, e.g., 204.0.0.0/6. Even though in practice address blocks are usually allocated with size much larger than /24, in order to prevent some filters from filtering out those class C prefixes that were allocated long time ago, the MAS for the portions is still set to be 24. (2) The real allocation size can vary for special requests, e.g., requests from big organizations or Internet exchange points. To understand the impact of MAS on the advertisement of address blocks, we apply the method in Section V-A to measure the distribution of advertisement length for different MAS. However, in this case we only consider new allocation with allocation size /18, /19 and /20, since 75too much. Their advertisement is comparable. The result is shown in Figure 8. From the figure, we see that MAS 24 corresponds to a higher percentage of /24s than MAS 19 and 20. This is expected to be true. However, MAS 19 generates a higher percentage of /24s than MAS 20, which is contrary to the expectation. Furthermore, for the three different MAS, we calculate the average number of fragments and the average fragment length. Both values are then normalized based on the allocation number. The results are provided in Table I. No obvious difference among the three MAS can be observed. All these measurements suggest that the impact of MAS on the advertisement of address blocks are insignificant. VI. D ISCUSSION The global routing table has experienced much larger changes than the absolute growth of the table size over time. For a six-month study window, the number of routing prefixes
that are withdrawn from the routing table by the end of the study period is identified to be of the same order of magnitude as the number of routing prefixes that are newly advertised during the study period. Essentially, it is because that, by advertising different set of prefixes that cover partial or complete address space of an allocated block, the ISPs can control, to some degree, how the networks assigned addresses from that address block are reached by the Internet. So the meaning of our measurement results on the change of the composition of a prefix set is of two fold. First, the requirement on traffic control may be changing over time for any allocated address block. Second, the change of the way advertising routing prefixes for a given address block does not necessarily result in the change of total number of globally visible routing prefixes, especially for address blocks that have been allocated and used for a while. Further, this observation, together with the observed immediate impact on the table size of newly address blocks, may make us believe that the table growth is mainly driven by the new address allocation and better control on current address allocation could always be expected to have visible effect on the table size immediately. The address allocation has been squeezed by two opposite goals for the address management. The foreseeable depletion of IPv4 address space demands conservative use of the remaining address space by minimizing the allocation block size. However, the concern on the routing table growth may favor larger allocation blocks and enforce hierarchical allocation along the tie-1 ISPs, tie-2 ISPs down to customer networks. So far, from our study, by allocating larger blocks of addresses while the allocation size has obviously affected the degree of fragmentation, which, in turn, has influenced the table growth, the minimum allocation for a CIDR portion has not been able to curb the table growth. The immediate explanation is that the prefix filtering mechanism has not been enforced strictly although differentiating minimum address size in different address space portion has well established the basis of an effective filtering system through the Internet. The deeper reason is the demand on the advertisement of finer routing prefixes rooted in the gap between the functionality provided by the BGP protocol and the requirement of real network operation. Due to the denser network connectivity, multi-homed networks, or ones connected with multiple upstream providers, are becoming more and more popular. While achieving many engineering benefits, for example redundancy, load sharing, performance etc., the implementation of IPv4 multi-homing has accounted for a large number of address fragmentation, which can no longer be simply summarized in an upstream provider, which the CIDR was designed to achieve. So the lesson learned from this case is that if the policy designer has no good control on the real enforcement of the policy, as shown in this case, the policy itself can produce only limited effect. VII. C ONCLUSIONS In this paper, we have quantitatively studied the impact of the IPv4 address allocation practice on the BGP table size growth.
Our findings can be summarized as follows. First, we characterize the advertisement of new allocation using several metrics such as advertisement delay, persistency and advertisement patterns. We find that the routing table growth is a dynamically evolving process with new routing prefixes being advertised and existing prefixes of same magnitude being removed. The table growth persistently involves address blocks allocated in all the past time period. However, newly allocated blocks make much more contribution to the table growth compared with the old ones. Secondly, we examine the impact of allocation size and minimum allocation size. We find that the allocation size has visible influence on the advertisement of allocated address blocks, and accordingly it directly affects the BGP table size growth. However, the minimum allocation size is not observed to have influence on the BGP table growth. Hence, the goal of declaring minimum allocation size seems to be not fulfilled. R EFERENCES [1] Y.Rekhter and T.Li, Architecture for IP Addressp Allocation with CIDR, Internet RFC 1518 [2] V.Fuller, T.Li, J.Yu, and K.Varadhan, Classless Inter-Domain Routing (CIDR): an Address Assignment and Aggregation Strategy, Internet RFC 1519 [3] Y.Rekhter and T.Li, A Border Gateway Protocol 4 (BGP-4), Internet RFC 1771 [4] Y.Rekhter, B.Moskowitz, D.Karrenberg, G.J.de Groot and E.Lear, Address Allocation for Private Internets, Internet RFC 1918 [5] J.Reynolds and J.Postel, Assigned Numbers, Internet RFC 1700 [6] IANA, Special-Use IPv4 Addresses, Internet RFC 3330 [7] VK. Hubbard and et. al., Internet Registry IP Allocation Guidelines, Internet RFC 2050 [8] ftp://ftp.arin.net/pub/stats/{arin, ripencc, apnic} [9] http://www.antc.uoregon.edu/route-views [10] http://data.ris.ripe.net/rrc00 [11] http://data.ris.ripe.net/rrc01 [12] http://www.qorbit.net/documents/junos-isp-prefix-filter-strict.htm [13] G.Huston, Analyzing the Internet’s BGP Routing Table, Internet Protocol Journal, January 2001. [14] Tian Bu, Lixin Gao and Don Towsley, On Routing Table Growth, Proceedings of Globe Internet 2002. http://www-net.cs.umass.edu/ tbu/ [15] CIDR Working Group, Implications of Various Address Allocation Policies for Internet Routing, Internet Draft, draft-ietf-cidrd-addr-ownership07.txt [16] G. Huston, Commentary on Inter-Domain Routing in the Internet, Internet RFC3221 [17] C.Alaettinoglu, Recent BGP Trends ”The Good News” 54th IETF Working Group & BOF Meeting Prefix Taxonomy Ongoing Measurement & Inter Network Experiment WG [18] C.J.Wittbrodt, IPv4 Address Allocation and BGP Routing Table Evolution, Presentation on NANOG Meeting, Oct. 2002. (http://www.nanog.org/mtg-0302/cathy.html). [19] Z.Xu, X.Meng, S.Lu, L.Zhang and C.J.Wittbrodt, IPv4 Address Allocation and the Evolution of the BGP Routing Table, CSD-TR030009, UCLA Computer Science Department (http://www.cs.ucla.edu/wing/publication/). [20] H.Narayan, R.Govindan and G.Varghese, The Impact of Address Allocation and Routing on the Structure and Implementation of Routing Tables. In Proceedings of SIGCOMM’03, Karlsruhe, Germany, 2003.