IMPACT OF VARIABLE RATE FERTILIZATION ON SUBSURFACE WATER CONTAMINATION IN WILD BLUEBERRY CROPPING SYSTEM S. R. Saleem, Q. U. Zaman, A. W. Schumann, A. Madani, A. A. Farooque, D. C. Percival
ABSTRACT. Wild blueberry fields have gentle to severe topography with high proportion of bare spots, and weed patches emphasizing the need for variable rate (VR) fertilization. To evaluate the impact of VR fertilization on subsurface water contamination, two wild blueberry fields were selected in Nova Scotia, Canada. The field boundaries, weeds and bare spots were mapped using real-time kinematics global positioning system. The variation in slope was mapped and management zones i.e. steep slope (Zone-1), moderate slope (Zone-2) and low lying areas (Zone-3) were delineated. Both fields were divided into two halves (VR and uniform). The GPS-guided prescription maps were generated in ArcGIS 9.3 for VR treatment sections. Three fertilization rates 200, 150, and 100 kg ha-1 were applied in Zone-1, Zone-2 and Zone-3, respectively, with a VR fertilizer spreader. The bare spots/weeds were classified as a separate class in the prescription maps and no fertilizer was applied in those areas. For comparison, the uniform fertilizer rate of 200 kg ha-1 used by growers was applied in uniform treatment sections of the selected fields. Subsurface water samples were collected after every heavy rainfall (>20 mm) from 36 suction lysimeters placed in each field with 18 lysimeters in each treatment. The subsurface water samples were analyzed for nitrate nitrogen (NO3--N), and ammonium nitrogen (NH4+-N) concentrations under VR and uniform fertilization. Leaf samples were collected from both VR and uniform treatments and were analyzed for leaf nutrient concentrations. The results of this study suggested significantly lower NO3--N and NH4+-N loading from subsurface water samples leaving the root zone in moderate and low lying areas for VR treatment as compared to uniform treatment. The nitrogen, phosphorus, and potassium nutrient levels in leaves were found to be higher than the recommended ranges for uniform treatment as compare to VR treatment suggesting the excess uptake by plants in uniform treatment which may result in more vegetative growth and lower yield. The results indicated that VR fertilization based slope can increase input use efficiency, farm profitability and reduce subsurface water contamination. Keywords. Variable rate fertilization, GIS, Nitrogen, Slope sensor, Wild blueberry.
W
ild blueberry fields are developed on deforested farmlands with gentle to severe topography, and newly developed fields have high proportion of bare spots (up to 50%) (Zaman et al., 2010). Wild blueberry fields are acidic in nature (Trevett, 1962) and considered inefficient users of nitrate (Townsend, 1969), resulting in either de-nitrification or leaching (Eaton and Patriquin, 1989). The combination of high rainfall, well drained sandy loam soil, and shallow
Submitted for review in June 2012 as manuscript number SW 9799; approved for publication by the Soil & Water Division of ASABE in January 2013. The authors are Shoaib Rashid Saleem, ASABE Member, Graduate Student, Faculty of Agriculture, Dalhousie University, NS, Canada; Qamar Uz Zaman, ASABE Member, Associate Professor, Faculty of Agriculture, Dalhousie University, NS, Canada; Arnold Walter Schumann, Associate Professor, Citrus Research and Education Center, University of Florida, Lake Alfred, Florida USA; Ali Madani, ASABE Member, Professor, Faculty of Agriculture, Dalhousie University, NS, Canada; Aitazaz Ahsan Farooque, ASABE Member, Ph.D. Student, Faculty of Agriculture, Dalhousie University, NS, Canada; David Charles Percival, Professor, Faculty of Agriculture, Dalhousie University, NS, Canada. Corresponding author: Qamar Uz Zaman, Faculty of Agriculture, Dalhousie University, P.O. Box 550, Truro, B2N 5E3, NS, Canada; phone: 902-896-2424; e-mail:
[email protected].
rooting depth of wild blueberry results in high NO3--N and NH4+-N leaching risk during blueberry production (Trevett, 1959). The chances of leaching of both NH4+-N and NO3--N are present in wild blueberry soils and nitrogen formulations have a major impact on leaching of inorganic nitrogen (Thyssen and Percival, 2006). Traditionally, fertilizer is applied uniformly in wild blueberry fields and may result in either over- or underapplication. Nutrients erode from steep slope areas with surface runoff and accumulate in low lying areas of the field. Over-fertilization in low lying areas of the field may deteriorate water quality and reduce farm profit, while under-fertilization in steep slope areas may restrict crop yield (Zaman et al., 2010). The variation in topographic features and soil nutrients indicates the need of VR fertilization in wild blueberry fields for site-specific nutrient management. There is extensive literature in other crops that suggests the possibility of using topography to delineate practical and agronomically meaningful field management zones (Beckie et al., 1997; Franzen et al., 1998). Zaman et al. (2010) related slope variability of 0 to 30 degrees with soil properties, leaf nutrients and fruit yield in wild blueberry fields. They suggested that these fields can be delineated into
Applied Engineering in Agriculture Vol. 29(2): 225-232
© 2013 American Society of Agricultural and Biological Engineers ISSN 0883-8542
225
slope based management zones for VR fertilization within field. Recent development in VR fertilizer spreaders enabled the researchers to apply the required fertilizer inputs precisely in different management zones within a field. The VR fertilizer spreaders performed well for site-specific fertilizer application using GPS-guided prescription maps within a field for different crops (Miller et al., 2004; Derby et al., 2007). As a result, technological barriers to managing fields with VR fertilization have largely been overcome. Many researchers have attempted to evaluate the impact of VR fertilization on subsurface water contamination for different cropping systems (Campbell et al., 1994; Dampney et al., 1999; Shahandeh et al., 2005; Zaman et al., 2009). Dampney et al. (1999) found a reduction in NO3--N leaching in winter wheat with VR fertilization based on variation in topographic features as compared to uniform rate fertilizer application. However, to date, little attention has been paid to apply VR fertilization in wild blueberry production systems. Therefore, this study was initiated to evaluate the impact of VR fertilization on subsurface water contamination.
METHODOLOGY EXPERIMENTAL SITES Two wild blueberry fields were selected in central Nova Scotia to evaluate the impact of VR fertilization on subsurface water contamination. The selected fields were Kemptown (Field 1) site (2.89 ha; 45° 31’ 50” N and 63° 07’ 45” W) and Cattle Market (Field 2) site (2.75 ha; 45° 22’ 37” N and 63° 13’ 7” W). The selected fields were in their vegetative sprout year in 2010 and 2011, respectively. The fields have been under commercial management over the past decade and have received biennial pruning by mowing for the past several years along with conventional fertilizer, weed, and disease management practices. The soil at both experimental sites is classified as sandy loam (Orthic Humo-Ferric Podzols), which is a well-drained acidic soil (Webb et al., 1991). MESUREMENT AND MAPPING OF SOIL VARIABILITY Slope variability was measured with a slope measurement and mapping system (SMMS) at the start of the experiment in sprout year for both fields. The SMMS consists of a tilt sensor, Trimble AgGPS-332 DGPS (Trimble Navigation Limited, Sunnyvale, Calif.) and laptop computer mounted on an all-terrain vehicle (ATV) nominally 0.3 m above ground level. The tilt sensor determines the tilt of the vehicle in any orientation on the slope. A DGPS antenna was mounted on the ATV to determine the location of the sampling point. A laptop computer with the custom developed software recorded geo-referenced slope data from the tilt sensor and GPS in real-time within the fields. The slope data and corresponding DGPS (x and y coordinates) were collected at 3-m intervals and stored on the laptop computer. Detailed procedures for measurement and mapping of slope were adopted from Zaman et al. (2010).
226
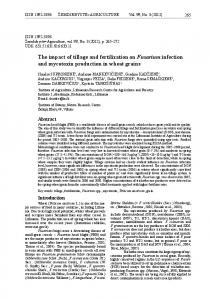
Figure 1. Slope map for Field 1.
The bare spots, field boundary, weeds and grasses were mapped in each field using Topcon HiPer Lite+ RTK-GPS (Topcon Positioning Systems, Inc., Livermore, Calif.). Slope maps were generated in ArcGIS 9.3 software (ESRI, Redlands, Calif.) for both sites using kriging interpolation technique. The slope maps of both fields were divided into three equal categories on the basis of slope variation (fig. 1). VARIABLE RATE FERTILIZATION Three different management zones [Zone-1 (Z1), steep slope; Zone-2 (Z2), moderate slope; and Zone-3 (Z3), low lying area] were delineated based on variation in slope within the selected fields. The fields were divided into uniform and VR treatments sections. Prescription maps were generated for VR fertilization in the developed management zones of the VR treatment sections. The 7.32-m wide boom Valmar 1255 pull type granular applicator (Valmar Airflo Inc. MB, Canada) equipped with Rawson™ Accu-Rate® variable rate controller system (Trimble Navigation Ltd. Calif.), GPS and an electro hydraulic metering drive unit was utilized to apply different fertilizer rates in management zones within the wild blueberry fields. The fertilizer constituted of nitrogen (16.5%), phosphorus (34.5%), potassium (4.5%), and sand and/or clay filler (44.5%). The selected fields were fertilized in the third week of May, 2010 and 2011during the sprout years. In VR section of each field, the highest fertilizer rate, equal to the grower’s previous uniform rate (200 kg ha-1) was allocated to the Z1, and the Z2 and Z3
APPLIED ENGINEERING IN AGRICULTURE
x
Figure 2. Prescription map for Field 1.
Figure 3. Lysimeter locations for the Field 1.
management zones received 150 and 100 kg ha-1, respectively (figs. 2 and 3). Bare spots/weeds were defined as a separate class in the developed VR management zones and no fertilizer was applied in bare spots. The grower’s uniform fertilizer rate of 200 kg ha-1 was applied everywhere in the uniform fertilizer treatment sections of both fields for comparison. Due to space constraints, only the maps of Field 1 are discussed here. The criterion for the selection of these rates was the study conducted by Zaman et al. (2009) suggesting excessive leaf nutrients and vegetative growth, and less fruit yield in low lying areas and vice versa.
of analytes until they were analyzed at the Water Quality Research Laboratory, Department of Environmental Sciences of the NSAC. The subsurface water samples were collected four and five times during 2010 and 2011, respectively, from Field 1 and Field 2, respectively after heavy rainfall events. The subsurface water samples were analyzed for NH4+-N and NO3--N using a Technicon auto-flow analyzer (Technicon Autoanalyzer-2, Terry Town, N.Y.).
SUBSURFACE WATER SAMPLES COLLECTION AND ANALYSIS Thirty-six vacuum lysimeters were installed in eighteen paired locations in each field to collect subsurface water (fig. 3). The lysimeter locations were recorded using RTKGPS. Six lysimeters in each zone were located in uniform and VR fertilization treatment sections of the field. The paired locations were arranged so that each lysimeter in VR treatment section has a corresponding location as near as possible in the uniform treatment section of the field. The ceramic cups of the lysimeters were installed at 40 cm depth below the soil surface, which is below the root zones of the blueberry plants. A vacuum of 80 Kpa (0.8 bar) was created in the lysimeter systems just prior to or after heavy rainfall events. Subsurface water samples were collected in 125-mL Nalgene sampling containers after 24 to 48 h. The samples were immediately stored in a freezer to prevent volatilization
29(2): 225-232
LEAF SAMPLING AND ANALYSIS Leaf samples were collected at tip-dieback stage (third week of July) in the sprout year and were analyzed for macro- and micro-nutrients present in the leaves. Twenty leaf samples were collected from each zone at randomly selected locations. Ten leaves were randomly collected per plant and dried at 65°C. Complete digestion of the leaf samples with heated concentrated nitric acid was performed to solubilize the nutrients (Percival and Prive, 2002). The digests were analyzed for leaf nutrients using inductively coupled plasma emission spectrometry (ICPES) (Percival and Prive, 2002), except leaf N. The concentrations of leaf N were determined using a LECO-CNS-1000 (LECO Corporation, St. Joseph, Mich.). DATA ANALYSIS The SAS software (SAS Institute Inc., Cary, N.C.) was used to perform repeated measures analysis of variance (RM ANOVA) for NO3--N and NH4+-N by using a mixedmodel procedure and significance probability (P) of 5%, in order to compare the potential impacts that VR fertilization
227
or uniform fertilization have on the subsurface water contamination. ANOVA with PROC MIXED was used to compare the means of leaf nutrients in both fields. The assumptions of normality of residuals were verified using a Shapiro-Wilk test. Residuals were plotted to check the constant variance. Means comparisons were conducted using a LSD for significantly different treatments (P