International Journal of
Geo-Information Article
Implementation of Geographical Conditions Monitoring in Beijing-Tianjin-Hebei, China Jixian Zhang *, Jiping Liu, Liang Zhai and Wei Hou * Chinese Academy of Surveying and Mapping, Beijing 100830, China;
[email protected] (J.L.);
[email protected] (L.Z.). * Correspondence:
[email protected] (J.Z.);
[email protected] (W.H.); Tel.: +86-10-638-818-16 (J.Z.); +86-10-638-806-22 (W.H.) Academic Editor: Wolfgang Kainz Received: 7 March 2016; Accepted: 26 May 2016; Published: 8 June 2016
Abstract: Increasingly accelerated urbanization and socio-economic development can cause a series of environmental problems. Accurate and efficient monitoring of the geographical conditions is important for achieving sustainable development. This paper presents the first results of the project “Geographical Conditions Monitoring (GCM)” in an exemplified area “Beijing-Tianjin-Hebei (BTH)” in China over the last three decades. It focuses on four hot issues in BTH: distribution of dust surfaces and pollution industries, vegetation coverage, urban sprawl, and ground subsidence. The aim of this project is the detection of geographical condition changes and for the description of this development by indicators, as well as the analysis and evaluation of the effects of such processes on selected environmental perspectives. The results have shown that the contributions of the applied GCM in making the plan of urban design and nature conservation. Valuable experience gained from this project would be useful for further developing and applying GCM at the national level. Keywords: Geographical Conditions Monitoring; Beijing-Tianjin-Hebei; dust surfaces; pollution industries; urban sprawl; ground subsidence; vegetation coverage
1. Introduction In 2013 China launched the “Geographical Conditions Monitoring (GCM)” national project. The GCM is a dynamic monitoring of the territory of the country. It mainly contains two steps: the first is to identify the status and spatial distribution of natural and cultural geographical features, such as rivers and lakes, forest, grassland, road network, urban layout, etc. The second is a statistical analysis of their changes in the quantity and frequency, distribution characteristics, regional differences, and trends [1]. It aims to transfer the data collected from the Earth’s surface into information and knowledge which will support sustainable development and evidence-based decision-making. In terms of application, GCM can be divided into three categories: fundamental monitoring, thematic monitoring, and disaster monitoring [1]. Fundamental monitoring focuses on all geographical features from the Earth’s surface. It provides the databases for thematic and disaster monitoring. Thematic monitoring is a higher level of geo-information which focuses on issues that would arouse public and governmental concern, such as environmental protection and natural resource management. Disaster monitoring is not regularly conducted. It is often following the disaster events, e.g., earthquakes, floods, mudslides, fires, and droughts. Such monitoring programs are designed to ensure a flow of benefits, or to control the severity and distribution of anticipated or especially unanticipated negative effects as they occur, and possibly to ensure due compensation where it is required [2]. It is usually of interest in geographic regions where rapid industrial or urban development and/or dramatic socio-economic change is taking place. In China, GCM has been considered as a component of “Digital
ISPRS Int. J. Geo-Inf. 2016, 5, 89; doi:10.3390/ijgi5060089
www.mdpi.com/journal/ijgi
ISPRS Int. J. Geo-Inf. 2016, 5, 89
2 of 19
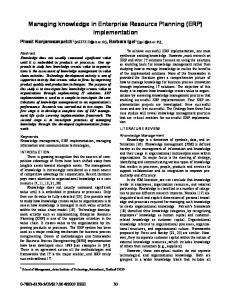
China”, a framework for geographic information needed by the nation. The outcome of GCM can be applied in the public service platform of “Digital China” to enrich its content. Similar projects have been initialized and conducted at the national level among other countries, even at the global level. In the late 20th century, the idea of establishing a National Ecological Observatory Network (NEON) has been formulated by the scientists in United States. In 2006 the initial plan for NEON has been completed and funded by the National Science Foundation (NSF) of US. It is currently in the construction phase, in which it will establish a national network for data and metadata gathering, field sampling, data processing, and information delivering. The aim is to manage large-scale ecological observing systems and experiments, and provide open, continental-scale data that characterize and quantify complex, rapidly-changing ecological processes [3]. To link existing and diverse observing systems around the world, the Global Earth Observation System of Systems (GEOSS) was established to provide comprehensive environmental data, information and analyses. It covers nine so called “Societal Benefit Areas”: agriculture, biodiversity, climate, disasters, ecosystems, energy, health, water, and meteorology [4], and will support the development of new systems where gaps currently exist. In Europe, a monitoring program “European environment information and observation network” (EIONET) was established in 1994 under the frame of European Environment Agency (EEA) and cooperating countries has increased consistently [5]. It aims to provide timely and quality-assured data, information and expertise for assessing the state of the environment in Europe and the pressures acting upon it. A broad issues related to environment protection are covered by EIONET, such as air pollution, climate change, transport, water stress, agriculture, biodiversity, natural risks, etc. In 2003, the European Union (EU) has launched another program “Global Monitoring for Environment and Security” (GMES), which mainly contains two kinds of services: monitoring of Earth systems (including land, marine, and atmosphere) and horizontal applications (including security, emergency, and climate change). This program is designed for supporting the EU as a global actor. For example, GMES is Europe’s main contributor to the global ten-year implementation plan of the GEOSS. GMES has also been highlighted in the EU’s dialogues with USA, Russia, China, and India [6]. In addition to the above mentioned programs, there are monitoring projects focusing on specific topics, such as the Famine Early Warning Systems Network (FEW NET) created by the US Agency for International Development, Global Drought Monitoring Network [7], and the natural disasters and crustal deformation monitoring implemented by Geospatial Information Authority of Japan. In this paper, a brief description and application of China’s Geographical Conditions Monitoring program are presented in the exemplified Beijing-Tianjin-Hebei region. Four important issues, i.e., distribution of dust surfaces and pollution industries, urban sprawl, vegetation coverage, and land subsidence, are monitored from a spatial perspective. An important aim of GCM is to support the decision-making process of nature conservation and spatial planning. In this case, further comprehensive analyses are necessary to understand the monitoring results, especially the impact of pollution sources on populations and land subsidence on infrastructures. Additionally, a cumulative analysis of the change pattern of urban sprawl and vegetation coverage is conducted to gain more insights of the anthropogenic impact on the Earth’s surface. 2. Methodological Basis for Thematic Monitoring at a Regional Scale 2.1. Monitoring Area The Beijing-Tianjin-Hebei (BTH) region is an urban agglomeration located in Northern China, including the mega-cities of Beijing and Tianjin, and several cities from Hebei province, e.g., Shijiazhuang, Baoding, Tangshan, etc. (Figure 1). It has a population of approximately 110 million and covers 218,000 km2 . In 2014, the BTH region’s annual GDP was about 6.65 trillion yuan, ranking third in China’s 20 urban agglomerations. As the political, economic, and cultural center of China, integrative development of BTH was set as a national strategy. Currently, the BTH region is experiencing rapid urbanization with an annual growth ca. 1.38% [8]. According to the historical data and future
ISPRS Int. J. Geo-Inf. 2016, 5, 89
3 of 19
ISPRS Int. J. Geo-Inf. 2016, 5, 89
3 of 19
policy, a foreseeable increase of urbanization and economic growth will continue in this region and, correspondingly, the need for the space andfor resources would put great pressure on the environment. region and, correspondingly, need space and resources would put great pressure on the Against this background, have implemented program in this region focusing four environment. Against thiswebackground, we havea monitoring implemented a monitoring program in thison region themes: distribution of dust surfaces and pollution industries, vegetation coverage, urban sprawl, and focusing on four themes: distribution of dust surfaces and pollution industries, vegetation coverage, urban land subsidence. The monitoring period covers from 1990 to 2014, depending on the data availability sprawl, and land subsidence. The monitoring period covers from 1990 to 2014, depending on the data for each monitoring theme. availability for each monitoring theme.
Figure 1. 1. Location Location and and range range of of the the BTH BTH region, region, China. China. Figure
2.2. Approaches of Thematic Monitoring 2.2. Approaches of Thematic Monitoring 2.2.1. Dust Dust Surfaces Surfaces and and Pollution Pollution Industries Industries Monitoring Monitoring 2.2.1. The rapid rapid urbanization urbanization and and industrialization industrialization result result in in popping popping up up of of industrial industrial pollution pollution sources sources The and construction construction in in the the whole whole of of China China [9], [9], especially especially in in the the region region of of BTH. BTH. Dust Dust surfaces surfaces and and and pollution industries, which have often been recognized as the primary sources of fine particulate pollution industries, which have often been recognized as the primary sources of fine particulate matter (e.g., (e.g., PM PM2.5)) [10–13], attract both attention from the government and public. In this monitoring matter 2.5 [10–13], attract both attention from the government and public. In this monitoring program, dust surfaces are considered as the land cover types which can produce ground dust into the atmosphere driven by wind or other man-made effects, including open mining field, piling surface, construction surface, bare surfaces, rolling trample surfaces, and other dust surfaces. Pollution industries include steel smelting, thermal-power plants, cement, petrochemical factories,
ISPRS Int. J. Geo-Inf. 2016, 5, 89
4 of 19
program, dust surfaces are considered as the land cover types which can produce ground dust into the atmosphere driven by wind or other man-made effects, including open mining field, piling surface, construction surface, bare surfaces, rolling trample surfaces, and other dust surfaces. Pollution industries include steel smelting, thermal-power plants, cement, petrochemical factories, non-ferrous metals enterprises, coal mining, papermaking, and pharmaceutical manufacturing enterprises. The address information of pollution industries is registered in the business entity database, but not spatialized. What we have done is located each address of pollution industries on the map based on the basic geographical information data, and represented as points. The dust surfaces are manually identified from high-resolution images in 2007 and 2013. The minimum mapping unit of dust surfaces is 1600 m2 . Aerial photos are used as the data sources in Beijing and Tianjin; SPOT5 multi-spectral data and Resources III images are used for Hebei province. The results of 2013 are verified by on-site investigation with no less than 5% samples for both dust surface and pollution industries. The results of 2007 are verified by higher resolution images of the same period and existing geographic information data. At the end, the distribution maps of dust surfaces and pollution industries in BTH are produced for the year of 2007 and 2013 (polygons for dust surfaces, and points for pollution industries). The area ratio of dust surface and density of pollution industries are simply adopted as the indicators for describing the spatial distribution of the two types of pollution sources (see detail in Table 1). Table 1. Thematic monitoring indicators used in BTH region. Indicator
Formula
Description
Area Ratio of Dust Surface (ARDS)
areads ARDS “ area ˆ 100% unit areads : the area of dust surface within a reporting unit, such as city unit (km2 ); areaunit : the area of the reporting unit (km2 ); range: 0 ď ARDS ď 100%
ARDS is proposed to measure the proportion of the dust surface located in a reporting unit.
Density of Pollution Industries (DPI)
pi DPI “ areaunit numpi : number of pollution industries in report unit; areaunit : the area of the reporting unit (km2 ); Range: 0 ď DPI
Pollution sources
num
DPI is proposed to measure the density of the pollution industries within a reporting unit.
Urban sprawl ∆U
Urban Expansion Speed (UES)
UESi “ ∆tjij ˆ 100% ∆Uij : the urban expansion area at the reporting unit i during the period j (km2 ); ∆tj : the time span during the period j (year); Range: normally the UES should be bigger than 0, but the urban area may also shrink. UFD “
Urban Fractal Dimension (UFD)
The annual growth rate of urban area in a period. It indicates absolute difference (area) of urban area in a certain time.
2lnpP{4q lnpAq
A: area of urban patch (km2 ); P: perimeter of urban patch (km); Range: 1 ď UFD ď 2 UFD approaches 1 for shapes with very simple perimeters such as squares; and approaches 2 for shapes with highly convoluted, plane-filling perimeters. Generally, when UFD < 1.5, the urban border tends to be simple; when UFD > 1.5, the urban border is more complex.
Fractal dimension is an important index of urban spatial morphology which expresses the space filling ability of urban border and the complexity of the irregular border. The greater the fractal dimension, the more irregular and complex the urban spatial morphology is.
ISPRS Int. J. Geo-Inf. 2016, 5, 89
5 of 19
Table 1. Cont. Indicator
Formula
Description
“ UR a PR
Urban Expansion Coordination Coefficient (UECC)
UECC ˆ 100% UR “ ∆t At {A0 ´ 1 ˆ 100% PR: the average annual growth rate of non-agricultural population in urban area; UR: the annual growth rate of urban area; At : the urban area at the end of a time period (km2 ). A0 : the urban area at the beginning of a time period (km2 ). ∆t: time span in year. When UECC > 1.12, it indicates large-scale expansion of urban area; while UECC < 1.12, indicates an insufficient expanded urban area, and other problems may appear, such as traffic congestion, insufficient infrastructure and poor living comfort.
UECC refers to the ratio of the growth rate of urban land and that of urban population for a certain period. The hypothetical value 1.12 of this indicator is set based on the research from China Academy of Urban Planning and Design and other literatures [14–17].
Vegetation coverage nir´red nir`red pNDV I´NDV Isoil q p NDV Iveg ´NDV Isoil q
NDVI “ FVC “ Fraction of Vegetation Coverage (FVC)
NDVI: Normalized Difference Vegetation Index which is calculated based on near infrared (nir) and red spectral bands; NDVIveg : the NDVI value for a surface with a fractional vegetation cover of 100%; NDVIsoil : the NDVI value for bare soil; Range: 0 ď FVC ď 100% θslope “
Change trend of vegetation coverage
ˆ 100%
nˆ
řn
FVC indicates the state of regional vegetation coverage and is important for evaluating the regional environment.
řn řn iˆM f c,i ´ i“1 i i“1 M f c,i řn 2 řn 2 nˆ i“1 i ´p i“1 iq
i“1
θslope : the slope of a linear regression equation for FVC values during a certain period; n: number of years in FVC time serial analysis; Mfc,i : the FVC value for the ith year. When θslope ě 0.1, FVC improving obviously during the study period; θslope ě 0.06, FVC improving slightly; 0.06 ą θslope ě 0.02, FVC improving; 0.02 ą θslope ě ´0.02, FVC no change; ´0.02 ą θslope ě ´0.06, FVC deteriorating; ´0.06 ą θslope ě ´0.1, FVC deteriorating slightly; ´0.1 ě θslope , FVC deteriorating obviously.
This indicator describes the change trend of vegetation coverage for certain time span in the study area. The absolute value of θslope indicates the change range of FVC. The criteria for evaluating slope are based on field investigation and expert estimation in GCM.
Ground subsidence ∆S
Ground Subsidence Rate (GSR)
GSR “ ∆tjj ∆S j : the surface subsidence during the period j (mm); ∆t j : time span during period j.
This indicator describes the speed of land subsidence.
2.2.2. Urban Sprawl Monitoring Differing from the administrative region of the cities, urban area is specifically defined based on the functional composition of urban patterns in our designed GCM. In this program, the term urban is considered as the area which is located inside the administrative border, and formed from
ISPRS Int. J. Geo-Inf. 2016, 5, 89
6 of 19
the city center to the rural-urban continuum through margin extension, axis extension, or multicenter extension. Urban sprawl can be defined under several perspectives [18,19]. Jaeger, et al. [20] define it as a (negative) status of the built-up area and its dispersion in the landscape. In our case, urban sprawl simply means the expansion process of the urban area. For the year of 1990 Landsat images are chosen as the basic data and high-resolution (