Hindawi Publishing Corporation e Scientific World Journal Volume 2014, Article ID 392309, 9 pages http://dx.doi.org/10.1155/2014/392309
Research Article Improved Ant Algorithms for Software Testing Cases Generation Shunkun Yang, Tianlong Man, and Jiaqi Xu School of Reliability and Systems Engineering, Beihang University, Beijing 100191, China Correspondence should be addressed to Shunkun Yang;
[email protected] Received 3 April 2014; Accepted 14 April 2014; Published 5 May 2014 Academic Editor: Guiwu Wei Copyright © 2014 Shunkun Yang et al. This is an open access article distributed under the Creative Commons Attribution License, which permits unrestricted use, distribution, and reproduction in any medium, provided the original work is properly cited. Existing ant colony optimization (ACO) for software testing cases generation is a very popular domain in software testing engineering. However, the traditional ACO has flaws, as early search pheromone is relatively scarce, search efficiency is low, search model is too simple, positive feedback mechanism is easy to porduce the phenomenon of stagnation and precocity. This paper introduces improved ACO for software testing cases generation: improved local pheromone update strategy for ant colony optimization, improved pheromone volatilization coefficient for ant colony optimization (IPVACO), and improved the global path pheromone update strategy for ant colony optimization (IGPACO). At last, we put forward a comprehensive improved ant colony optimization (ACIACO), which is based on all the above three methods. The proposed technique will be compared with random algorithm (RND) and genetic algorithm (GA) in terms of both efficiency and coverage. The results indicate that the improved method can effectively improve the search efficiency, restrain precocity, promote case coverage, and reduce the number of iterations.
1. Introduction Software testing is the implementation of the system and components and the behavior of observing and recording results under given conditions [1]. Test cases (TC) set plays an important role in the process of software testing and determines the quality of software directly. TC in software testing is a data set, such as input data, execution paths, execution conditions, and testing requirements [2]. For a long time, the TC generation mainly relied on manpower, which means that software testers need to have rich experience in software testing. At the same time, it also leads to the fact that the actual engineering of TC generation work often has great blindness and some problems emerge, such as the huge TC number, high manpower cost, hardly ascend test case coverage, and so forth. Therefore, how to automatically generate TC scientifically and efficiently becomes the research focus of software testing engineer. Over the years, many researchers in automatic TC generation field have carried out extensive and in-depth research and have got a lot of research results. In 1992, ant colony optimization is proposed by Dorigo et al. [3] in his Ph.D. degree thesis. The inspiration comes from the process of ant colony searching for food. Ant colony optimization is a kind of simulated evolutionary algorithm; preliminary studies show that the algorithm
has a good optimization performance. And it has many advantages, such as easy combination with other algorithms and strong robustness and adaptive self-organizing ability. In 2003, McMinn and Holcombe [4] introduced heuristic ant colony optimization into the software test case generation technology for the first time. As the ant colony algorithm is being used widely gradually in the test case generation technology, many tools for software testing based on ACO have been developed. Among them, PPTACO for optimal path generation [5], STTACO for test sequence generation [6], EPPTACO for path generation [7], and PCTDACO for test data generation [8] are the representative tools. Recently, Sharma et al. [9] developed another tool, ESCov, which is based on ACO generation state transition test sequence and achieves maximum coverage and minimum redundancy. After that, Suri and Singhal [10] proposed ACO TCSP tool which is based on ACO algorithm to select TC and greatly reduces the number of cases to 62.5%. Not long after, Suri and Singhal [11] considered execution time constraints and accuracy, in the eight selected programs, and most of the TC numbers decreased by more than 80%. And some scholars apply ACO to many aspects of test data generation technology. Singh et al. [12] applied ACO on test case prioritization. Before long, Bauersfeld et al. [13] applied ACO to input queue
2
The Scientific World Journal
of graphical user interface (GUI) generated automatically and applied dynamic feedback between the system under test (SUT) and the search process. Recently, Srivastva et al. [14] put forward a kind of nonrepeated state transformation method based on ACO algorithm; this method reduces the redundant state conversion and effectively covers the status of the transformation uncovered. And Singh et al. [15] compared a white box testing technology based on ACO algorithm with the existing black-box testing technique and came to the conclusion that path coverage based on ACO algorithm is higher. Now, ant colony optimization has a wide application in test case generation technology. But because of the insufficiency of the algorithm theory itself, it produces many problems, as early search pheromone is relatively scarce, search efficiency is low, search model is too simple, positive feedback mechanism is easy to produce stagnation and precocity phenomenon. In order to overcome the shortage of the ant colony optimization, in this paper, we put forward ILPACO, IPVACO, IGPACO, and ACIACO and build ant colony research path model to improve the search efficiency, restrain precocity, promote case coverage, and reduce the number of iterations.
2. The Description of the Improved Ant Colony Optimization Ant colony optimization has a good optimization effect on path optimization, especially traveling salesman problem (TSP) [16–18]. In this paper, we construct ant colony path model to realize the software test case generation. Using the path model presented in this paper, because of a lack of closed loop feedback, the simple ACO (SACO) will tend to move randomly. We improve ant colony optimization to realize generation of higher coverage TC and prove that the improved algorithm is effective for test case generation. In Section 2, we will describe the four improved ACO algorithms: ILPACO, IPVACO, IGPACO, and ACIACO. 2.1. Improve Local Pheromone Update Strategy for Ant Colony Optimization (ILPACO). SACO is an approach, which uses a small constant to update local pheromone. Let 𝑘 be an integer, 1 ≤ 𝑘 ≤ 2𝑁 − 1. We denote by V𝑘 path node of ant colony and by 𝜏(V𝑘 , V𝑘+1 ) pheromones from node V𝑘 to node V𝑘+1 . We define local volatilization coefficient, 𝛼, and define the small constant to update local pheromone, 𝜏0 . Based on these, the update process of 𝜏(V𝑘 , V𝑘+1 ) is defined as follows: 𝜏 (V𝑘 , V𝑘+1 ) ← (1 − 𝛼) 𝜏 (V𝑘 , V𝑘+1 ) + 𝛼𝜏0 .
(1)
In Section 2.1, we present an improved local pheromone update strategy for ant colony optimization (ILPACO). Using the method of program instrumentation, we get the coverage to update local pheromone instead of the small constant 𝜏0 [19]. Because the value of the coverage will be smaller than one, it is necessary for us to select a proportionality coefficient 𝑘 to multiply by the coverage to fit with a wider range of applications. So local pheromone update variable 𝜏 is defined
Table 1: The value of 𝜆 corresponding to different 𝑁. 𝑁=1 𝑁 = 16 𝑁 = 32 𝑁 = 80
𝜆 = 1.003 𝜆 = 1.045 𝜆 = 1.054 𝜆 = 1.065
as 𝜏 = 𝑘 ⋅ coverage. Based on these, the update process of 𝜏(V𝑘 , V𝑘+1 ) is defined as follows: 𝜏 (V𝑘 , V𝑘+1 ) ← (1 − 𝛼) 𝜏 (V𝑘 , V𝑘+1 ) + 𝛼𝜏 .
(2)
The coverage presented can be any kind of coverage. In this paper, we select three commonly used kinds of coverage; statement coverage (SC), branch coverage (BC), and modified condition/decision coverage (MC/DC) [20]. 2.2. Improved Pheromone Volatilization Coefficient for Ant Colony Optimization (IPVACO). In this section, we describe IPVACO algorithm. For smaller volatilization coefficient 𝛼, the pheromone volatilization is slower; the optimal path will be restrained. In contrast, for the larger volatile coefficient, but not too large, pheromone evaporates quickly and the effect of the optimal path is strengthened. Larger 𝛼 makes the previous experience to be ignored easily and tend to search more by recent experience. In the SACO algorithm, 𝛼 is fixed. In this paper, we put forward the adaptive 𝛼, beginning with a small value tendency to search, and the late tendency to develop with larger values. At the same time, this improved method still uses coverage to update local pheromone. Let 𝛼(0) be initial volatile coefficient and let 𝜆 be a constant value. We denote by 𝑡 iteration and 𝛼(𝑡) volatile coefficient of the number 𝑡 iteration. Consider the following: 𝛼 (𝑡 + 1) = 𝜆𝛼 (𝑡) .
(3)
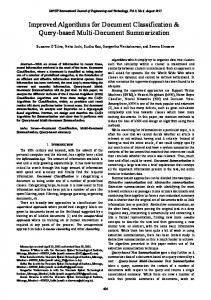
We need to determine right range of 𝜆. Based on the formula (3), it is easy to deduce formula 𝛼(𝑡) = 𝜆𝑡−1 𝛼(1), and total volatile pheromone of one route is 𝛼(1) ⋅ (1 − 𝜆𝑡 )/(1 − 𝜆). The value of desired pheromone of one route is 𝑡⋅𝑒⋅𝑁/4 and 𝑒 is the value of desired pheromone in one generation. Because most of ants’ coverage ranges from 0.25 to 0.35, we can select a value range from 0.25 to 0.35. And 𝑁 is the number of ants that update pheromone. In this paper, we select 1, 16, 32, and 80 as 𝑁. The initial pheromone value of each route is taken as 0.1. Let 𝛼(1) = 0.05. In Figure 1, line 1 shows the total desired amount of pheromone in one route when 𝑒 is equal to 0.25, line 2 shows the total desired amount of pheromone in one route when 𝑒 is equal to 0.35, and line 3, the exponential curve, depicts the amount of pheromone volatilization with different value of 𝜆. Because the pheromone volatilization should be less than the total amount of the path pheromone, according to Figure 1, we get Table 1. Because we select the value of 𝜆 in a range, we are not sure whether the value satisfies the condition that the pheromone volatilization should be less than the total amount of the path pheromone. So it is necessary for us to verify if the value is appropriate. we draw Figure 2 to verify the value. It is the same that line 1 shows the total desired amount of pheromone
The Scientific World Journal N=1
12 11
180
10
160 Line 2
9 8
Line 3
7
Line 2
140 Line 3
120
Line 1
100
Line 1
80
6 5
N = 16
200
Pheromone
Pheromone
3
1
1.005
1.01
60 1.04
1.015
1.045
𝜆 N = 32
450
900 800 Line 3
300
Line 2
250 Line 1
200
Pheromone
350 Pheromone
1.055
N = 80
1000
400
Line 2
700 600
Line 3 Line 1
500 400
150 100 1.05
1.05 𝜆
300 1.055
1.06
1.065
200 1.06
1.065
𝜆
1.07
1.075
𝜆
Figure 1: Pheromone volatilization and accumulated certain 𝜆.
in one route when 𝑒 is equal to 0.25, line 2 shows the total desired amount of pheromone in one route when 𝑒 is equal to 0.35, and line 3, the exponential curve, depicts the amount of pheromone volatilization with increasing generation number. In Figure 2, we see that line 1 is higher than line 3, which means that amount of the path pheromone is always more than the pheromone volatilization. So we verify that the values in Table 1 are appropriate.
convergence speed. Figure 3 shows the process of selecting the best ant from 𝑁 ants. Consider the following:
2.3. Improve the Global Path Pheromone Update Strategy for Ant Colony Optimization (IGPACO). SACO algorithm uses all the ants to update pheromone. In Section 2.3, we describe IGPACO algorithm, which is based on ILPACO algorithm. We use the coverage to update local pheromone, at the same time, and only the best ant can update the amount of pheromone in each iteration, rather than all the ants [21]. Performance of ant colony optimization, as a swarm intelligence algorithm, depends on the individual ants and overall synergy effect [22]. According to pheromone concentration distribution, ants choose routes. That makes the convergence speed slow. Besides, there are certain possibilities that ant colony fall into local optimal solution prematurely. We put forward the approach that the optimal ant update pheromone can reduce the branch paths effectively, whose coverage is low, make ants avoid unnecessary paths, and improve the
2.4. Comprehensive Improved Ant Colony Optimization (ACIACO). Comprehensive approach combines together methods represented above comprehensively to improve simple ant colony algorithm. The methods represented conclude ILPACO, IPVACO, and IGPACO. ILPACO, as it shows in (2), can strengthen the ant colony path with high coverage. And the higher coverage the path has, the greater the path’s pheromone is, which makes routes have a good gradation with each other [23]. IPVACO, as it shows in (3), improves volatile coefficient increases gradually with the increase of number. Beginning with a small value tend to search and the late tend to develop with larger values. IGPACO selects the best ant update path pheromone in each iteration to search for a more optimal path and improve the convergence speed. Figure 4 shows the flowchart of ACIACO and the green parts are the parts improved by the optimization algorithms.
(1 − 𝛼) 𝜏 (V𝑘 , V𝑘+1 ) + 𝛼𝜏 { { 𝜏 (V𝑘 , V𝑘+1 ) ← { if AntI is Best Ant (1 ≤ 𝐼 ≤ 𝑁) { − 𝛼) 𝜏 (V𝑘 , V𝑘+1 ) else. (1 {
(4)
4
The Scientific World Journal 𝜆 = 1.003
9 8
120
Line 2
7
Pheromone
5 Line 3
4
Line 2
100
Line 1
6 Pheromone
𝜆 = 1.045
140
3
Line 1
80 Line 3
60 40
2 20
1 0
0
10
20
30
40
50
60
70
80
90
0
100
0
10
20
30
40
t
80
90
100
Line 2
600
Line 2
500
200
Line 1
150
Pheromone
Pheromone
70
𝜆 = 1.065
700
250
Line 3
100
Line 1
400 300
Line 3
200
50 0
60
t
𝜆 = 1.054
300
50
100 0
10
20
30
40
50
60
70
80
90
100
0
0
10
20
t
30
40
50
60
70
80
90
100
t
Figure 2: Pheromone lines with different 𝜆.
Ant1
Ant2
Ant3
...
...
AntN
BestAnt
Figure 3: Best ant selection.
3. The Construction of the TC-Oriented Ant Colony Path Model In this work, we establish an effective ant colony optimization path. We utilize this path model to achieve effective iteration. And we explain the transformation relationship between ant colony paths and test cases. The establishment of transformation relationship makes effective use of ant colony algorithm for iterative optimization of software test cases. 3.1. The Transformation Relationship between Ant Colony Paths and Test Cases. As shown in Figure 5, we define ant path directed graph by 𝐺 = (𝑉, 𝐸) [24]. We describe node set with 𝑉 = {V1 , V2 , V3 , . . . , V2𝑁} and directed edge set with 𝐸 = {𝑒1 , 𝑒2 , 𝑒3 , . . . , 𝑒4𝑁}. We build the path model with
𝑒1 = (V1 , V2 ), 𝑒2 = (V1 , V𝑁+2 ), 𝑒3 = (V𝑁+1 , V2 ), and 𝑒4 = (V𝑁+1 , V𝑁+2 ), . . . , 𝑒4𝑁 = (V2𝑁, V𝑁+1 ). Ant colony optimization path is an 𝑁 layer structure; each layer has two nodes, a total of 2𝑁 nodes. There are four paths between every adjacent two layers, a total of 4𝑁 paths. Set value in 1 ∼ 𝑁 nodes to 0 and value in 𝑁 + 1 ∼ 2𝑁 nodes to 1. Ants’ every movement can only choose one node in each layer. According to the pheromone, ants follow the arrow direction to move to the next layer and complete the movement of the 𝑁 layer structure. Then, ants move back to the first layer of the path and begin movement of the next generation until the end of the iterations. According to the route of the last generation of ants, which equals to the number the 𝑁 bit binary number. Through the antispoofing, we get the test case. As shown in Figure 6, we give a simple example to explain the relationship between the path and test case. The undertest program is the triangle determination program; the data of test case are three lines of triangle, 𝑎, 𝑏, and 𝑐. We cut the 𝑁 bit binary number into three 𝑁/3 parts: the first part corresponding with 𝑎, the second part corresponding with 𝑏, and the third part corresponding with 𝑐. Generally, we can change the value of 𝑁 and the value of nodes to satisfy different-type and different-interval test cases. The last generation of ants is the eventually generated test cases and
The Scientific World Journal
5
The ants are assigned to starting point randomly
Each path pheromone initialization, iteration number N set to 0
Get the coverage (SC, BC, MC/DC) of TC
No N < 100
Convert the TC to a binary number, determine paths ant colony passed
Output the test cases
Yes
Coverage update partial pheromone
Ants move according to pheromone
Best ant to update pheromone
Enter the next iteration, N++
Ants move from the first layer to the last. And generate a TC. Let i = 0
The number i TC i++
Set volatile coefficient to 1.003 ∗ generation Yes
i ≤ number of TC
No
Figure 4: The flowchart of ACIACO.
the ant number is equal to the number of test cases at last generation. 3.2. Ants Movement Rules. In Section 3.2, we explain the ant movement rules. Firstly, we take a small constant to initialize ant colony path pheromone. According to (1), ants in the current node V𝑗 = V𝑘 (1 ≤ 𝑘 ≤ 2𝑁) can only move to one . We define 𝜏(V𝑘 , V𝑘+1 ) of two nodes in the next layer, V𝑗+1 pheromone of the directed line 𝑒(V𝑘 , V𝑘+1 ); 𝑞 is a random number from the range [0, 1]. If 1 ≤ 𝑘 ≤ 𝑁 − 1, V𝑗+1
{ {V , = { 𝑘+1 { {V𝑘+1+𝑁,
𝑞≤
𝜏 (V𝑘 , V𝑘+1 ) (𝜏 (V𝑘 , V𝑘+1 ) + 𝜏 (V𝑘 , V𝑘+1+𝑁))
(5)
else.
If 1 + 𝑁 ≤ 𝑘 ≤ 2𝑁 − 1, 𝜏 (V𝑘 , V𝑘+1 ) { {V , 𝑞≤ V𝑗+1 = { 𝑘+1 (𝜏 (V𝑘 , V𝑘+1 ) + 𝜏 (V𝑘 , V𝑘+1+𝑁)) { {V𝑘+1+𝑁, else.
(6)
If 𝑘 = 𝑁 or 𝑘 = 2𝑁, 𝜏 (V𝑘 , V1 ) { {V , 𝑞≤ ={ 1 V𝑗+1 (𝜏 (V𝑘 , V1 ) + 𝜏 (V𝑘 , V𝑁+1 )) { , else. V 1+𝑁 {
(7)
4. Experimental Analysis In this section, we present the result of the four proposed approaches. C++ language is used for experiment programming. Classic triangle classification (CTCP) and the collision avoidance system (TCAS) are selected as two undertest programs. Because CTCP and TCAS have characteristics of many branches and determines, they are suited as undertest programs for software test case generation. In Section 4.1, we introduce the experiment process of CTCP. And, in Section 4.2, we introduce the experiment process of TCAS. In two experiments, we compare data by seven approaches, including RND, GA, SACO, ILPACO, IPVACO, IGPACO, and ACIACO. We use the statement coverage, branch coverage, and modified condition/decision coverage (MC/DC),
6
The Scientific World Journal Table 2: Coverage of CTCP by seven approaches. Statement coverage 62.25% 92.45% 61.78% 67.98% 88.28% 90.34% 100.00%
RND GA SACO ILPACO IPVACO IGPACO ACIACO
VN+1
V1
V2
VN+2
...
VN
V2N
Figure 5: Ant colony path model.
three kinds of coverage, as quality standard of test cases. In order to avoid the contingency, we select average coverage and average minimum generation of all test inputs in 100 runs as the experimental data [25]. In Section 4.3, we conclude and analyze the efficiency of all improved approaches. 4.1. Classic Triangle Classification Experiment. The lines of classic triangle classification program are 119. Cyclomatic complexity is 19. In GA, we determine the GA parameters (maximum number of generations (MaxGens), population size (PopSize), crossover probability (XP), mutation probability (MP), and select probability (SP)). We set the parameters of GA as MaxGens = 100, PopSize = 50, XP = 0.1, MP = 0.1, and SP = 0.5. Let volatile coefficient 𝛼 = 0.05 and let proportionality coefficient 𝑘 = 1.0. In volatile coefficient schedule, let 𝜆 = 1.003 for IGPACO and ACIACO, the corresponding value in Table 1 for others, and 𝛼(1) = 0.05. The total number of iterations is 100. Table 2 shows three kinds of coverage of the seven approaches: RND, GA, SACO, ILPACO, IPVACO, IGPACO, and ACIACO. The number of ants is set to the value 16. RND and GA both generate 16 test cases. Because of SACO’s lack of
Branch coverage 47.37% 77.84% 49.58% 54.84% 75.69% 75.49% 88.83%
MC/DC 11.90% 22.76% 14.03% 22.90% 22.88% 23.45% 46.34%
0
1
0
0
1
0
1
0
0
1
0
0
1
0
1
1
0
1
0
0
1
0
1
a
b
c
1
1
a = 010 = 2 b = 011 = 3 c = 010 = 2
1 0
Figure 6: The transformation relationship between ant colony paths and test cases.
coverage feedback, it is similar to RND. And we find that GA is similar to IGPACO. The statement coverage of ACIACO achieves 100%. Table 3 shows changes of coverage by choosing different numbers of ants on ACIACO. We select the number of ants 8, 16, 24, 32, 40, 48, 56, 64, and 72, respectively. We also use statement coverage, branch coverage, and MC/DC as quality standard of test case. As shown in Table 3, the number of ants is 16 and the statement coverage achieves 100%. When the number of ants is increased to 32, statement coverage and branch coverage reach 100%. Because MC/DC interaction intensity is high, when the number of ants arrived at 56, the coverage only stops at about 89%. Unless a large number of ants increase, it is difficult to improve MC/DC coverage. How to improve the MC/DC, high interaction intensity coverage, we need new improved ant colony algorithm to achieve it. Table 4 shows, when branch coverage achieves 100%, the average minimum generation on seven approaches. As shown in Table 3, the number of ants is 32 and ACIACO achieves 100%. So we select the ant number 32. We can see that RND and SACO do not achieve 100%, even more than 10000 generations. GA and IGPACO are similar. IGPACO can reduce number of iterations very well; the average minimum generation is reduced from 161.34 to 47.89. The minimum average iteration number of ACIACO is 24.12. ACIACO reduces the iteration number greatly.
The Scientific World Journal
7 Table 3: The coverage of different ant numbers on ACIACO.
ACIACO 8 ants 16 ants 24 ants 32 ants 40 ants 48 ants 56 ants 64 ants 72 ants
Statement coverage 92.23% 99.65% 100.00% 100.00% 100.00% 100.00% 100.00% 100.00% 100.00%
Table 4: The average minimum generation.
RND GA SACO ILPACO IPVACO IGPACO ACIACO
The minimum generation >10000 54.23 >10000 161.34 135.26 47.89 24.12
4.2. The Collision Avoidance System. The lines of the collision avoidance system are 213 and cyclomatic complexity is 19. In GA, we set the parameters of GA as MaxGens = 100, PopSize = 50, XP = 0.1, MP = 0.1, and SP = 0.5. Program generates twelve aircraft flight parameters. The number of ant colony network nodes is set to 118, the number of the route model on one side is 59, and, thereinto, the parameter Cur Vertical Sep is 1st∼11th node; High Confidence is boor type, so it is 12th node; Two of Three Reports Valid is boor type; it is 13th node; Own Tracked Alt is 14th∼24th node; Own Tracked Alt Rate is 25th∼30th node; Other Tracked Alt is 31st∼35th; Alt Layer Value is 36th∼37th node; Up Separation is 38th∼45th node; Down Separation is 46th∼53rd node; Other RAC is 54th∼55th node; Other Capability is 56th∼57th node; Climb Inhibit is 58th. Let volatile coefficient 𝛼 = 0.05; proportionality coefficient 𝑘 = 1.0. In volatile coefficient schedule, let 𝜆 = 1.003 for IGPACO and ACIACO, the corresponding value in Table 1 for others, and 𝛼(1) = 0.05. The total number of iterations is 100. Table 5 shows three kinds of coverage of the seven approaches: RND, GA, SACO, ILPACO, IPVACO, IGPACO, and ACIACO. The number of ants is set to 16. At the same time, RND and GA both generate 16 test cases. In the same way, RND is similar to SACO. In ACIACO, statement coverage achieves 92.90%, branch coverage achieves 75.11%, and MC/DC achieves 33.64%. Through analyzing data in Table 5, GA is similar to IPVACO and IGPACO. And three kinds of coverage of ACIACO are highest. Table 6 shows changes of coverage by choosing different numbers of ants on ACIAC. We select the number of ants 8, 16, 24, 32, 40, 48, 56, 64, 72, 80, and 88, respectively. We
Branch coverage 80.23% 88.34% 93.72% 100.00% 100.00% 100.00% 100.00% 100.00% 100.00%
MC/DC 33.98% 44.12% 56.78% 56.83% 67.37% 78.36% 89.34% 89.45% 89.47%
also use statement coverage, branch coverage, and MC/DC as quality standard of test case. When the number of ants is 64, the statement coverage achieves 100%. When the number of ants increases to 16, the statement coverage and branch coverage achieve 100%. We find that when the numbers of ants are 32, 40, and 48, the three kinds of coverage increase slowly, even decrease. That is a normal phenomenon. Some parts hardly be covered need test cases those appear with low probability to cover. There is a situation that 40 ants have a higher coverage than 48 ants do. The reason is that 48 ants do not conclude those test cases hardly be covered, but 40 ants conclude part of them. And when the number of ants increases to 48, some test cases generated with low possibility have been generated continually and coverage increases again. All the same, because MC/DC interaction intensity is high, when ants arrived at 80, the coverage only stops at about 76%. As is shown in Table 7, we select the number of ants as 80. And, in GA, the number of test cases is 80. We conclude the average minimum generation number on seven approaches, whose branch coverage achieves 100%. We get some similar conclusions. RND and SACO do not achieve 100%, even more than 10000 generations. GA is similar to IGPACO. IGPACO can reduce number of iterations very well; the average number of iterations is reduced from 238.34 to 96.39. IGPACO is better than IPVACO. The average minimum iteration number of ACIACO is 28.24. ACO greatly reduces number of iterations. 4.3. Discussion and Analysis. From the above experimental data, we can conclude the performance of seven different algorithms. RND and SACO are random processes and the coverage is lowest. GA is effective to promote coverage of test cases and decreases number of iterations. And the performance of GA is similar to that of IGPACO. ILPACO uses coverage as ant colony pheromone feedback to strengthen the advantage path and coverage of test cases is promoted. Based on ILPACO, IPVACO uses adaptive volatile coefficient and makes volatile speed slow first and then faster. The coverage of test cases generated on IPVACO is better than ILPACO. IGPACO uses best ant to update pheromone. IGPACO has a good astringency. And the minimum number of iterations where branch coverage achieves 100% is much smaller than IPVACO and IGPACO. ACIACO, which is based on all the
8
The Scientific World Journal Table 5: Coverage of TCAS by seven approaches. Statement coverage 69.37% 87.82% 71.17% 85.89% 92.54% 89.28% 92.90%
RND GA SACO ILPACO IPVACO IGPACO ACIACO
Branch coverage 48.29% 70.57% 49.77% 64.28% 72.68% 69.28% 75.11%
MC/DC 12.12% 15.47% 11.81% 17.64% 17.47% 17.68% 33.64%
Table 6: The coverage of different ant numbers on ACIACO. ACIACO 8 ants 16 ants 24 ants 32 ants 40 ants 48 ants 56 ants 64 ants 72 ants 80 ants 88 ants
Statement coverage 82.37% 92.29% 92.78% 94.38% 95.84% 95.11% 97.89% 100.00% 100.00% 100.00% 100.00%
Table 7: The minimum generation.
RND GA SACO ILPACO IPVACO IGPACO ACIACO
The minimum generation >10000 98.66 >10000 238.34 174.28 96.39 28.24
above three methods, can effectively improve the search efficiency, restrain precocity, achieve the highest coverage, and minimize the number of iterations. The proposed technique will be compared with RND and GA in terms of both efficiency and coverage. The results indicate that the improved method can improve the search efficiency, restrain precocity, promote case coverage, and reduce the number of iterations effectively.
Branch coverage 64.30% 75.88% 78.68% 80.23% 84.29% 82.30% 87.77% 92.87% 96.45% 100.00% 100.00%
MC/DC 17.17% 33.22% 35.53% 35.55% 38.45% 37.25% 45.25% 57.67% 70.89% 76.12% 76.13%
the search efficiency, restrain precocity, promote test cases coverage, and reduce the number of iterations. The future work will consider following fields. (1) Construct high efficiency ant colony search path. Because ant colony path model is simple, the algorithm astringency is reduced. Establishing efficient ant colony search path can significantly improve test case coverage and reduce the number of iterations greatly. (2) Improve ant colony algorithm further sophisticatedly. For MC/DC such correlation extremely high coverage, we need to think of a more sophisticated algorithm; algorithm should take into account correlation problem of the structures and variables in under test program. (3) Based on ACO, put forward the comprehensive algorithm with other intelligent optimization algorithms. Because of some disadvantages in ant colony optimization, we can use genetic algorithm, particle swarm optimization, artificial bee colony, or another heuristic algorithm to combine with ant colony optimization effectively, mutually complementing each other. The comprehensive algorithm will improve the quality of the software test case generated effectively.
Conflict of Interests 5. Conclusions In this paper, we have improved ACO, establish ant colony search path, and put forward improved approaches: ILPACO, IPVACO, IGPACO, and ACIACO. The proposed technique is compared with RND and GA in terms of both efficiency and coverage. Through the comparison and analysis of CTCP and TCAS, the improved method can effectively improve
The authors declare that there is no conflict of interests regarding the publication of this paper.
Acknowledgments This research is partially supported by the Aeronautics Science Foundation of China (no. 2011ZD51055), Science
The Scientific World Journal and Technology on Reliability and Environmental Engineering Laboratory (no. 302367), the National Pre-Research Foundation of China (no. 51319080201), and YETP1121. And the authors also would like to express their thanks to the anonymous reviewers whose comments would improve this paper considerably.
References [1] Software & Systems Engineering Committee, “IEEE standard for software and system test documentation,” IEEE 829-2008, IEEE Computer Society, 2008. [2] F. Jurado, M. A. Redondo, and M. Ortega, “Using fuzzy logic applied to software metrics and test cases to assess programming assignments and give advice,” Journal of Network and Computer Applications, vol. 35, no. 2, pp. 695–712, 2012. [3] M. Dorigo, V. Maniezzo, and A. Colorni, “Ant system: optimization by a colony of cooperating agents,” IEEE Transactions on Systems, Man, and Cybernetics B: Cybernetics, vol. 26, no. 1, pp. 29–41, 1996. [4] P. McMinn and M. Holcombe, “The state problem for evolutionary testing,” in Proceedings of the Genetic and Evolutionary Computation Conference (GECCO ’03), pp. 2488–2498, Springer, Chicago, Ill, USA, July 2003. [5] P. R. Srivastava, N. Jose, S. Barade, and D. Ghosh, “Optimized test sequence generation from usage models using Ant colony optimization,” International Journal of Software Engineering & Applications, vol. 2, no. 2, pp. 14–28, 2010. [6] P. R. Srivastava, “Structured testing using Ant colony optimization,” in Proceedings of the 1st International Conference on Intelligent Interactive Technologies and Multimedia (IITM ’10), pp. 203–207, ACM Press, December 2010. [7] P. R. Srivastava, V. Ramachandran, M. Kumar, G. Talukder, V. Tiwari, and P. Sharma, “Generation of test data using meta heuristic approach,” in Proceedings of the 2008 IEEE Region 10 Conference (TENCON ’08), November 2008. [8] M. Chis, “A survey of the evolutionary computation techniques for software engineering,” in Evolutionary Computation and Optimization Algorithms in Software Engineering: Applications and Techniques, M. Chis, Ed., chapter 1, pp. 1–12, 2010. [9] B. Sharma, I. Girdhar, M. Taneja, P. Basia, S. Vadla, and P. R. Srivastava, “Software coverage: a testing approach through ant colony optimization,” in Proceedings of the 2nd International Conference on Swarm, Evolutionary, and Memetic Computing (SEMCCO ’11), pp. 618–625, 2011. [10] B. Suri and S. Singhal, “Implementing Ant colony optimization for test case selection and prioritization,” International Journal on Computer Science and Engineering, vol. 3, no. 5, pp. 1924– 1932, 2011. [11] B. Suri and S. Singhal, “Analyzing test case selection & prioritization using ACO,” ACM SIGSOFT Software Engineering Notes, vol. 36, no. 6, pp. 1–5, 2011. [12] Y. Singh, A. Kaur, and B. Suri, “Test case prioritization using ant colony optimization,” ACM SIGSOFT Software Engineering Notes, vol. 35, no. 4, pp. 1–7, 2010. [13] S. Bauersfeld, S. Wappler, and J. Wegener, “A metaheuristic approach to test sequence generation for applications with a GUI,” in Proceedings of the 3rd International Symposium on Search Based Software Engineering (SSBSE ’11), pp. 173–187, September 2011.
9 [14] P. R. Srivastava, S. S. Naruka, A. Alam, N. Agarwal, and V. M. Shah, “Software coverage analysis: black box approach using ANT system,” International Journal of Applied Evolutionary Computation, vol. 3, no. 3, pp. 62–77, 2012. [15] S. Singh, A. Kaur, K. Sharma, and S. Srivastava, “Software testing strategies and current issues in embedded software systems,” International Journal of Scientific & Engineering Research, vol. 3, no. 4, pp. 1342–1357, 2013. [16] A. Uˇgur and D. Aydin, “An interactive simulation and analysis software for solving TSP using Ant Colony Optimization algorithms,” Advances in Engineering Software, vol. 40, no. 5, pp. 341–349, 2009. [17] X. Li, C. Lao, X. Liu, and Y. Chen, “Coupling urban cellular automata with ant colony optimization for zoning protected natural areas under a changing landscape,” International Journal of Geographical Information Science, vol. 25, no. 4, pp. 575–593, 2011. [18] M. Dorigo and L. M. Gambardella, “Ant colony system: a cooperative learning approach to the traveling salesman problem,” IEEE Transactions on Evolutionary Computation, vol. 1, no. 1, pp. 53–66, 1997. [19] A. Andziulis, D. Dzemydiene, R. Steponaviˇcius, and S. Jakovlev, “Comparison of two heuristic approaches for solving the production scheduling problem,” Information Technology and Control, vol. 40, no. 2, pp. 118–122, 2011. [20] K. Agarwal, M. Goyal, and P. R. Srivastava, “Code coverage using intelligent water drop (IWD),” International Journal of Bio-Inspired Computation, vol. 4, no. 6, pp. 392–402, 2012. [21] X. Chen, Q. Gu, X. Zhang, and D. Chen, “Building prioritized pairwise interaction test suites with ant colony optimization,” in Proceedings of the 9th International Conference on Quality Software (QSIC ’09), pp. 347–352, August 2009. [22] M. Dorigo and M. Birattari, “Ant colony optimization,” in Encyclopedia of Machine Learning, pp. 36–39, Springer, New York, NY, USA, 2010. [23] P. R. Srivastava and K. Baby, “Automated software testing using metahurestic technique based on an Ant Colony Optimization,” in Proceedings of the 2010 International Symposium on Electronic System Design (ISED ’10), pp. 235–240, December 2010. [24] Z. Zhang, W. Wang, F. Yue, and H. Cui, “Mars Rover localization and path-planning based on LIDAR and ant colony optimization,” International Journal of Innovative Computing, Information and Control, vol. 7, no. 9, pp. 5571–5582, 2011. [25] C. Mao, X. Yu, J. Chen, and J. Chen, “Generating test data for structural testing based on Ant colony optimization,” in Proceedings of the 2012 12th International Conference on Quality Software (QSIC ’12), pp. 98–101, 2012.