dependent upon the geological environment in which the mica was formed. It is necessary ... KEYWORDS" mica, lithium, magnesium, correlation, classification.
Mineralogical Magazine, February 1999, Vol. 63(1), pp. 57-74
The correlation between lithium and magnesium in trioctahedral micas:
Improved equations for Li20 estimation from MgO data G. T1SCHENDORF Neumannstr. 106, 13189 Berlin, Germany H.-J. FORSTERAND B. GOTTESMA~,~ GeoForschungsZentrum Potsdam, Dept. 4.2, Telegrafenberg, 14473 Potsdam, Germany ABSTRACT
A major disadvantage of the electron microprobe is its inability to determine Li, which may make up an essential component in micaceous minerals. Correct classification of micas and proper calculation of their formulae require alternative methods. One of these is the indirect estimation of the lithium concentration by empirical approaches based on element correlations. Relationships between Li20 and SiO2 have long been used for this purpose; however, they are valid only for a limited range of mica compositions (i.e. Li-rich, Mg-poor varieties). In this paper we report the results from a renewed study of the correlation between Li20 and MgO contents in trioctahedral micas. It is demonstrated that the relations between both oxides are strongly dependent upon the geological environment in which the mica was formed. It is necessary to distinguish a 'normal group', which comprises micas from 'common' S- and I-type magmatic rocks and most metamorphic rocks, a 'low Li-Mg group', to which belong Fe-rich micas from non-alkaline rocks of A-type affinity, and a 'high Li-Mg group' which includes micas from either peraluminous or peralkaline igneous rocks and Mg-enriched wall-rocks. These wall rocks supplied additional magnesium to the mica-forming environment. We offer empirical expressions relating Li20 and MgO contents for these three types which, in many cases, allow a sufficiently good estimation of the lithium content in trioctahedral micas of widely varying compositions.
KEYWORDS" mica, lithium, magnesium, correlation, classification.
Introduction
KNOWLEDGEof the Li contents in micas is important for petrogenefic or classification purposes. Bulk analysis of mineral separates is a poor substitute for in situ microanalysis because zoning and heterogeneities on a grain-size scale are common. Lithium contents cannot be obtained by electron microprobe, and other methods of microanalysis capable of determining this element (secondary ionmass spectrometry and laser ablation-indnctively coupled plasma mass spectrometry) are still out of reach for most researchers. As demonstrated by Tindle and Webb (1990), Li in trioctahedral micas can be estimated with 9 1999 The Mineralogical Society
good accuracy from conventional electron microprobe analysis by using the equation Li20 = (0.287 x SiO2) - 9.552. These authors limited the applicability of this equation to micas with less than 8 wt.% MgO. In a companion paper (Tischendorf et al., 1997), the present authors re-examined the relationship between Li20 and SiO2 and, using a different set of compositional data, came up virtually with the same result, Li20 = (0.289 x SiO2) - 9.658. To minimize error, these authors recommmended this equation only be used for micas with MgO 34 wt.%. Using all the data on micas available to us, we have tested the correlation between Li20 and SiO2
G. TISCHENDORF ETAL.
than 1200 mica analyses, either from sources in the literature or from unpublished data sets of the authors. Generally, published analyses of even the most Li-rich micas (lepidolite) include MgO whereas Li20 is rarely analysed in Mg-rich micas (phlogopite). This is not a major problem because the Li20 contents in Mg-rich micas are relatively low anyway, and not so important for classification and petrological interpretation. On the other hand, accurate determination of the MgO contents in Li-rich micas is essential, because small amounts of MgO (0.5 0.01 wt.%) correspond to greater contents of Li20 (2-6 wt.%). Our evaluation of this data set assumes that the Li20 and MgO values are analytically correct. To minimize the effect of alteration we did not include micas with K20 (+ Na20 + Rb20 + Cs20 + CaO) sum A1; L = lepidolite, sum alk < sum A1 Author
Li20 (wt.%)
Polylithionite, theoretical Gamaleya (1968), no. 1 "k" [P] Stevens (1938), Table 1, no. 17 "kr [P] Semenov et al. (1969) [P] Raade and Larsen (1980), no. 1 ~r [P] Cem~ and Tmeman (1985), no. T ~ [P] Stevens (1938), Table 1, no. 16 ~ [L] Uhlig (1992), Table 5.1, No. Z 11 [L] Cem~ and Trueman (1985), no. S ~ [P] Ukai et al. (1956), Table 3, no. 7 "Or [L] Lapides et al. (1977), Table 2, No. 62 "k [L] Franzini and Sartori (1969), Table [L] Chaudhry and Howie (1973), Table 1, no. M.2 [L] Monier et al. (1987), Table 1, no. 2 [L] Chaudhry and Howie (1973), Table 1, no. MO.1 [L] Stevens (1938), Table 1, no. 15 ~ [L] This work, Table 4, no.1001 [L] This work, Table 4, no.1022 [L] Chaudhry and Howie (1973), Table 1, no. MN.21 [L] Chaudhry and Howie (1973), Table 1, no. MKC [L] Hawthorne and ~ern~ (1982), Table 8, no. 2 "~r [L] Hawthorne and Cern~ (1982), Table 8, no. 4 "k [L] N~mec (1990a), Table 3, no. P IV [L] Cern~ et al. (1970), no. 41 ~ [L] This work, Table 4, no.1004 [L]
7.28-7.65 7.45 7.26 7.18 7.07 6.97 6.84 6.69 6.62 6.55 6.54 6.51 6.40 6.33 6.20 6.18 6.15 6.15 6.00 6.00 5.95 5.95 5.92 5.91 5.90
MgO (wt.%) 0.000 0.18 0.34 0.02 0.15 0.84 0.22 0.04 1.75 0.46 0.50 0.07 0.06 0.03 0.11 0.30 0.020 0.029 0.06 0.08 0.22 0.18 0.03 0.63 0.039
to above HM; e.g. Anderson and Bender, 1989; Rieder et al., 1996) appear crucial in shifting the mica composition in terms of Li20 vs. MgO away from the curve which characterizes the normal group. The extraordinary position of the Honeycomb Hills annitic biotites (see Fig. 3), even with respect to other A-type micas, may be the result of sub-solidus re-equilibration at high fo2 as discussed by lcenhower and London (1997). Micas from the high Li-Mg group (Fig. 4) come from rocks of very different genesis and chemical composition. Host rocks with peraluminous affinity are characterized by extensive interaction between the granitic melt or external pegmatitic liquids with the country rock. The Li and Mg in these micas may have originated from different sources, the lithium coming from graniticpegmatitic melt (mother-rock component), and Mg from the rocks adjacent to the place of formation (wall-rock component). The shift towards higher MgO (at a given Li20) is greatest for micas in contact with the Mg-richest wall
The low Li-Mg group is primarily composed of trioctahedral micas that originate from metaluminous to mildly peraluminous granitoid rocks and their derivatives (pegmatites, aplites) which show A-type affiliation. They are either truly anorogenic or post-orogenic. These micas show a remarkable scatter in Li20-MgO space with some, particularly those from post-collisional Atype granites, approaching the relations observed in the normal group. Several factors, such as source rock composition (a F-rich and water-poor protolith) as well as P T X - c o n d i t i o n s of anatectic melting and crystallization (low oxygen fugacity), have been invoked to explain the typically strongly ferruginous composition of these micas which belong to the annite-siderophyllite series (e.g. Kinnaird et al., 1992; Abdel-Rahman, 1994; Shannon et al., 1997; Smith et al., 1997). However, neither enhanced fluorine (which is equally high in evolved S-type granites) nor low oxygen fugacities (the A-type rocks considered here cover a wide range info2, from below QFM 63
G.TISCHENDORF ETAL TABLE 4. Chemical analyses of mica separates Region Locality Rock type Sample
Erzgebirge P~hla skarn SK 1
Erzgebirge Z6blitz serpentinite 189
Granulitgebirge Wolkenstein pegmatite 1004
Granulitgebirge Wolkenstein pegmatite 1022
Mocambique Alto Ligonha pegmatite 1001
43.3 0.12 11,2 0.33 3.46 0.06 26.3 0.16 0.11 0.07 8.3 0.044 0.118 2.3
43.3 0.26 12.3 1.00 5.38 0.08 24.4 0.02 0.20 0.27 8.3 0.110 0.024 0.44
50.7 0.03 23.2 0.08 0.05 0.22 0.039 0.03 5.90 0.29 9.95 1,461 1.105 5.6
51.6 0.01 23.5 0,29 0.17 0.08 0.029 0.01 6.15 0.27 10.3 1,016 1,083 5.5
51.1 0.0t 22.6 0.17 0.07 1.23 0,020 0.05 6.15 0.25 9.6 1.156 0.245 6.2
Cations normalized to 22 oxygens Si 6.149 AI(IV) 1.851
6.078 1.922
6.883 1.117
6.876 1.124
6.909 1.091
Ti AI(VI) Fe ~+-3 Fe 2+ Mn Mg Li Sum [Y]
0.013 0.029 0.035 0.411 0.007 5,565 0.063 6,122
0.027 0.107 0.106 0.631 0.010 5.103 0.113 6.096
0.003 2.596 0,008 0.006 0.025 0.006 3.221 5.865
0.001 2.567 0,029 0,019 0.009 0,004 3.296 5.925
0.001 2.512 0,017 0.008 0,141 0,004 3,344 6,027
Ca Na K Rb Cs
0.024 0.018 1.503 0.004 0.007
0.002 0.072 1.486 0.010 0.001
0,004 0.075 1.723 0,128 0.064
0.002 0.070 1.751 0,087 0.062
0.007 0.066 1,656 0.100 0.014
Sum [X] F
1.557 1.033
1.572 0.195
1.994 2.404
1.971 2,318
1.843 2.651
5.502 0.437 phlogopite
4.990 0.667 phlogopite
3.215 ~.554 lepidolite
3.291 -2.510 tepidolite
-3.340 -2,344 lepidolite
SiO2 (wt.%) TiO2 A1203 Fe203 FeO MnO MgO CaO Li20 Na20 K20 Rb20 Cs20 F
mgli feal Variety
mgli - Mg - Li (octahedral), real - Fe(tot) + Mn + Ti - Al(VI)(octahedral) Analytical conditions are given in Tischendorf et al. (1969). All samples were recently re-analysed for Si, A1, Mg, Ca, Na, Rb and Cs by XRF, AAS, ICP-AES and INAA, and modified accordingly.
rock. In our suite of samples this comprises serpentinites, amphibolites, keratophyres, gabbros. As a result, we observe Li-poor as well as Li-rich phlogopites (e.g. Pomgrleanu et al., 1986), abnormally Mg-rich zinnwaldites (e.g.
Semenov and Shmakin, 1988; Lagache and Qu+m6neur, 1997), and even the extraordinary micas ( h i g h - L i - R b - C s - M g ' s i d e r o p h y l l i t e s ' ) formed at the exocontact of the Tanco pegmatite (e.g. Icenhower and London, 1995). 64
Li AND MG IN TRIOCTAHEDRAL MICAS 10
We interpret the unique position of the micas from the Portuguese hybrid granites (Neiva, 1981a, b) at the concave side of the 'normal group' regression hyperbola (Fig. 4) as a consequence of crystallization under disequilibrium conditions. Obviously, these micas are characterized by their bigenetic origin which assumes derivation of lithium from the granites and mobilization of magnesium from the wall-rock. Concerning the group of Li-richest micas, polylithionite (in the sense of Cern) and Trueman, 1985) is the characteristic mica in 'peralkaline igneous rocks'. The highly variable A1203 content in lepidolites ( 1 0 - 3 2 wt.%) can be regarded as sensitive to the activity of alumina in the parent medium (i.e. N~mec and Povondra, 1993). Thus, micas with a polylithionite composition reflect the peralkaline environment and trilithionitic micas are typical of peraluminous host rocks. According to their composition and environment of formation, the taeniolites also belong to the group with peralkaline affinity (e.g. Fig. 4). This has called attention to the possible existence of a polylithionite-taeniolite solid solution series with intermediate compositions (Cern) and Trueman, 1985). The Li and Mg in these micas can be mono- as well as bigenetic. It is, however, likely that a major part of the Mg is derived from the wall rock.
normal ou -•--•-7,•,•-.z-•'•n
1
regression
o ' ~ o ~ d2~ ,(~,'/ ---X~X
\
A
\\ 0.1
•
~ / + ~-~+
~
.,.,.I +
-~t- -r~-
0,01 +mu~dphen; mgli > 0 x mus/phen; mgli = 0 to -0.4 0 Li mus/Li phen; mgli = -0.4 to -1.4 EJLimus; mgli 4) should prefer the equation LizO = [0.25/(0.25 + MgO)] 0.03. The error in the other groups has the same order of magnitude as for most of the direct analytical methods for Li20.
The problem o f trioctahedral micas low in RVj
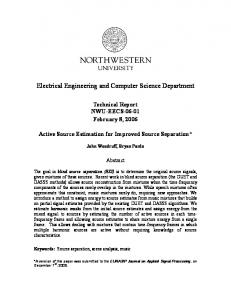
The L i : O / M g O correlation changes with decreasing R vI from trioctahedral lepidolite, zinnwaldite and protolithionite to the dioctahedral Li muscovite/Li phengite. The Li20/MgO relations in both the transitional and dioctahedral micas resemble those characteristic of the low LiMg group. To avoid large errors in estimating LizO by correlation with MgO, we recommend including only micas with R w > 5.0. In order to give an impression about the Li20/MgO distribution in dioctahedral micas, we refer the reader to Fig. 6.
Conclusions Advantages in estimating Li20 using the relationship with MgO include: (a) the applicability to the whole existing compositional range of Li and Mg (and not, as in the case of correlation with SiO2, for only a part of the range), and (b) the reversed behaviour of both the elements across the entire compositional range. We point out that, due to analytical reasons and the existing chemical variability, especially in isomorphous mineral groups, estimation of Li20 in micas by direct correlation with any element, including MgO, is only an approximation. Nevertheless, evaluation of the absolute and relative errors in Li20
Calculation o f errors
In Table 5 we present an evaluation of the average error when calculating Li20 as a function of MgO separately for the four mica groups discussed and for individual MgO intervals. Note that the calculated Li20 mean corresponds very well with the Li20 mean from the analysed samples. With this in mind, the standard deviation 65
G. TISCHENDORF ETAL.
~
0
0
0
0
..C;
9
9
c~
9 9
>
.