Feb 15, 2013 - â Music Technology Group, Universitat Pompeu Fabra, Spain. ABSTRACT. Segregating an audio mixture containing multiple simultane-.
IMPROVED MULTIPLE BIRDSONG TRACKING WITH DISTRIBUTION DERIVATIVE METHOD AND MARKOV RENEWAL PROCESS CLUSTERING Dan Stowell? , Saˇso Muˇseviˇc† , Jordi Bonada† and Mark D. Plumbley?
arXiv:1302.3462v2 [cs.SD] 15 Feb 2013
?
Centre for Digital Music, Queen Mary University of London, UK † Music Technology Group, Universitat Pompeu Fabra, Spain
ABSTRACT Segregating an audio mixture containing multiple simultaneous bird sounds is a challenging task. However, birdsong often contains rapid pitch modulations, and these modulations carry information which may be of use in automatic recognition. In this paper we demonstrate that an improved spectrogram representation, based on the distribution derivative method, leads to improved performance of a segregation algorithm which uses a Markov renewal process model to track vocalisation patterns consisting of singing and silences. Index Terms— birdsong, Markov renewal process, multiple tracking, distribution derivative method, reassignment 1. INTRODUCTION Machine recognition of animal sounds is of growing importance in bioacoustics and ecology, as a tool that can facilitate unattended monitoring, citizen science, and other applications with large volumes of audio data [1, 2]. For birdsong, tasks which have been studied include recognition of species [3] and individuals [4, 5]. However, much research considers only the monophonic case, using recordings of single birds, either isolated or with low background interference. It is important to develop techniques applicable to mixtures of singing birds: because singing often occurs within flocks or dawn choruses, but also because there is research interest in analysing ensemble singing [6] and in non-invasively characterising a population [7]. The automatic recognition literature has only just begun to approach such polyphonic tasks [8]. In the present work we focus on the task of analysing a recording containing multiple birds of the same species (e.g. a recording of a flock), and identifying the streams of syllables that correspond to a single bird. From the perspective of computational auditory scene analysis this task of clustering sounds is analogous to the well-known “cocktail party problem” in perception [9]. We consider the task recently studied by [10], which develops a probabilistic model that can segregate such sequences of sound events modelled as point processes. In that work, it was observed that the quality of the initial detection stage (used to locate individual syllables) when applied to audio mixtures can be a strong limiting factor
on the quality of the tracking. In this paper we work within the same paradigm and demonstrate that improvements to the underlying representation yield improved quality of tracking. In [11] it was observed that birdsong contains very rapid modulations, and that using a chirplet representation instead of standard spectral magnitudes could lead to improved recognition performance by making use of low-level modulation information. The technique described in that paper used a simple dictionary of chirplets to analyse a signal. However, powerful parametric techniques exist to estimate the characteristics of non-stationary signals and may be well-suited to this task. The generalised reassignment method (GRM) [12] has be shown to work well for this even when dealing with extreme frequency and amplitude modulations [13]. However difficulties arise as the linear system of equations for a third degree GRM becomes ill-conditioned. A related method, the distribution derivative method (DDM) [14] circumvents this. In addition a frequency range, rather than just a single frequency can be examined when a highly modulated sinusoid is assumed to occupy a significant portion of spectrum, rather than being concentrated around the peak frequency. Such techniques have not yet been widely tested in practical applications. In the present work we demonstrate that the refined representation derived from the DDM leads to improved tracking of multiple singing birds. In the remainder of this paper, we will give an overview of the DDM, and the particular variant of the technique developed for the present study. We will then describe the multiple tracking technique used to infer the sequence structure contained within a recording of multiple birds. We will apply this tracking procedure to a dataset of birdsong recordings, analysed via either a standard spectrogram or the DDM, showing that the improved spectral representation is of benefit to downstream analysis. 2. DISTRIBUTION DERIVATIVE METHOD The essence of the DDM lies in a simple but powerful concept of the distribution derivative rule. Considering an arbitrary distribution x and a test function Ψ, a straightforward consequence using integration-per-partes on inner product follows: < x0 , Ψ >= − < x, Ψ0 > .
(1)
< s0 , wejω >= − < s, w0 ejω > +jω < s, wejω >,
(2)
where < ., . > denotes the inner product, w the window function of finite time support and s the signal. In such a setting the Fourier Transform (FT) at frequency ω can be written as:
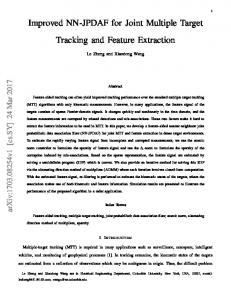
spectrogram 8000 frequency(Hz)
Treating the signal under study as a distribution, the following equality can be obtained using the above:
6000 4000 2000 1.94
1.96
1.98
2
2.02 2.04 time(s)
2.06
2.08
2.1
2.12
DDM spectrogram (freq. polynomial superimposed)
If the signal is modelled as a generalised sinusoid: X s(t) = er(t) , r(t) = rk tk , rk ∈ C,
(3)
(4)
8000 frequency(Hz)
Sw (ω) =< s, wejω > .
6000 4000 2000
k=0
1.94
the following equality: 0 (ω) = < r0 s, wejω > Sw
=
(5)
K−1 X
(k + 1)rk+1 < tk s, wejω >
(7)
can be compacted (using (3)) into: K−1 X
(k + 1)rk+1 Stw (ω) = −Sw0 (ω) + jωSw (ω),
(8)
k=0
where < stk , wejω >=< s, (tk w)ejω >= Stk w . The above holds for any ω and can thus be used to define a linear system of equations with respect to rk , k > 0; however r0 cannot be estimated this way as it was factored out during derivation. The frequencies used to construct the linear system can generally be arbitrary, though one should choose the ones that bear most of the energy of the sinusoids under study to avoid numerical instabilities. The set of frequencies should also cover a big part of the bandwidth occupied by the sinusoid: failure to do so would exclude important frequency domain content of the sinusoid, leading to inaccurate estimation. The complex stationary parameter r0 can be estimated after the non-stationary parameters rk , k > 0 have been estimated. Substituting < s, s >=< e= er0 < e . = < s, s >
1.98
2
2.02 2.04 time(s)
2.06
2.08
2.1
2.12
Fig. 1. Top: spectrogram, Bottom: DDM spectrogram with linear freq polynomial of magnitude peak superimposed.
(6)
k=0
=− < s, w0 ejω > +jω < s, wejω >,
1.96
(10)
The parameters rk , k > 0 in (10) are substituted with estimates rˆk , k > 0 to get the estimate for er0 . For most applications the model with FM polynomial of degree 2 (i.e. frequency change is linear during the observation frame) is sufficient. In such case only values Sw , Sw0 , Stw at different frequencies form the linear system.The widest mainlobe width
is that of w(t)t, 5 bins in total. In order to select an optimal bandwidth for the DDM, a typical bird frequency change must be estimated from a real recording. For the Chiffchaff sounds considered in this paper, a typical chirp exhibits a maximum of 100 kHz/s frequency change, thus for an observation frame of 1024 samples and a sampling frequency of 44100 such chirp would cover roughly about 2300Hz bandwidth. It will be shown that covering a region of about 1000Hz is sufficient to estimate the linear FM accurately enough for the purpose. To use DDM efficiently we use the bins of the FFT: computing DFT at an arbitrary frequency has little advantage and increases computational load significantly. For this paper a bandwidth of 16 bins was considered. The cumulative effective range of all mainlobes positioned at 16 consecutive bins therefore totals to 21 bins (since the widest mainlobe width is 5 bins), almost 1000Hz in the current setting. The estimates depend on the frequency range examined, so we designate them as rˆk (ωL , ωH ). The frequency and amplitude estimates =(ˆ r1 (ωL , ωH )),