2009 XXIII Brazilian Symposium on Software Engineering
Improving a Web Usability Inspection Technique using Qualitative and Quantitative Data from an Observational Study Tayana Conte
Verônica Vaz, Jobson Massolar
Computer Science Department (DCC) Federal University of Amazonas (UFAM) Manaus, Brazil e-mail:
[email protected]
Systems Engineering and Computer Science Program COPPE/ UFRJ Rio de Janeiro, Brazil e-mail:
[email protected]/
[email protected]
Emilia Mendes
Guilherme Horta Travassos
Computer Science Department The University of Auckland Auckland, New Zealand e-mail:
[email protected]
Systems Engineering and Computer Science Program COPPE/ UFRJ Rio de Janeiro, Brazil e-mail:
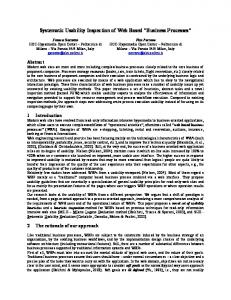
[email protected] and (2) to evaluate the relevant usability criteria of Web Applications. Defining methods and techniques for ensuring usability is therefore one of the current goals of Web engineering researches [3]. The need for sound Web usability techniques motivated our research goal, which is to define a usability inspection technique tailored to support the specific features of Web Applications [4]. To this end we have proposed the Web Design Perspectives-Based Usability Evaluation (WDP) technique, based on the combination of Web design perspectives adapted from existing literature, and Nielsen’s Heuristic Evaluation [5]. To support the development and validation of the WDP technique, we adopted the experimental methodology presented in [6], summarized on Figure 1. This methodology, that represents an extension of [7], comprises six stages: 1) the execution of secondary studies to identify, evaluate and interpret all available research relevant to a particular research question or topic area [8,9]; 2) the creation of the initial version of the technique based on the result of secondary studies; 3) the execution of feasibility studies to determine the usage possibility of the technology; 4) the execution of observational studies to improve the understanding and the cost-effectiveness of the technology; 5) the execution of case studies in real lifecycle to characterize the technology application during a real lifecycle, and; 6) the execution of case studies in industry to identify if technology application fits into the industrial setting. Conte et al. [4] presented an overview of the development of our technique including discussions on how the methodology guided each phase of its development. Specific results of this research were also discussed: the evidence gained through a secondary study regarding Web development processes [11], the results of two feasibility studies [12] and a case study using a real lifecycle [13].
Abstract— We have proposed a checklist-based usability inspection technique (WDP - Web Design Perspectives-Based Usability Evaluation) specific for Web applications’ usability evaluation and we are following an experimentation-based methodology to support its development and improvement. This paper describes an observational study conducted, aimed at eliciting how inspectors apply the WDP technique. We discuss the quantitative and qualitative results of the result and their impact on improving the WDP technique. We analyzed the qualitative data using the procedures from the Grounded Theory (GT) method Web usability evaluation; inspection observational study; qualitative analysis
I.
technique;
INTRODUCTION
Companies that operate their businesses on the Web rely heavily on providing applications and services of high quality so that customers return to do repeat business. As such, these companies only see a return on investment if customers’ needs have been fulfilled. Customers who use the Web for obtaining services have very little loyalty to the companies they do business with. This suggests that new companies providing Web applications of a higher quality will most likely displace customers from previously established businesses. Further, that quality is the principal factor that will bring repeated business [1]. According to Offutt [2], one of the three quality criteria on the dominant Web development drivers is usability. ISO 9241 standard defines usability as “the extent to which a product can be used by specified users to achieve specified goals with effectiveness, efficiency and satisfaction in a specified context of use”. Usability is considered a fundamental factor of Web applications’ quality because users’ acceptability of Web applications seems to rely strictly on the applications’ usability [3]. Web Usability has two main objectives: (1) to drive the design of Web Applications 978-0-7695-3844-0/09 $25.00 © 2009 IEEE DOI 10.1109/SBES.2009.25
227
Figure 1. Experimental Methodology Overview [10]
This paper describes the conducted observational study, discussing the results of the qualitative and quantitative data analyses and their impact in the improvement of the WDP technique. In the first two feasibility studies, the WDP technique was applied as a “black box”, i.e., we knew what we gave as input to the inspectors and we collected the inspections’ results. In this observational study, we intended to ‘look inside’ the inspection process, seeing it as a “white box”, which was fundamental to enable us to understand how inspectors apply the WDP technique. The remainder of this paper is organized as follows: Sections 2 presents the WDP technique and summarizes the results of the initial studies. Section 3 describes the planning and the execution of the Observational Study. Sections 4 and 5 present the results of the Quantitative and Qualitative Analysis, respectively. Finally, conclusions and comments on future work are presented in Section 6.
used, such as: Heuristic Evaluation [5], Cognitive Walkthrough [15], Usability Based Reading [16]. Usability inspections are naturally less expensive than evaluation methods that involve user participation, since they do not need, besides the inspectors, any special equipment or laboratory. According to Zhang et al. [16], it is difficult for an inspector to detect all kind of problems at the same time. Due to that, they proposed a usability inspection technique based on perspectives (Usability Based Reading - UBR). The assumption behind perspective-based inspections techniques is that, thanks to the focus, each inspection session can detect a greater percentage of defects in comparison to other techniques that do not use perspectives. In addition, the combination of different perspectives can detect more defects than the same number of inspection sessions using a general inspection technique [16]. Motivated by the Zhang’s et al. [16] results, we decided to investigate if the adoption of specific perspectives would make Heuristic Evaluation [4] more efficient for usability inspections of Web Applications. In this case, we have to use perspectives related to specific characteristics of Web Applications. We had already conducted a systematic review to characterize Web Development Processes [11], and as a result of this systematic review, we identified design perspectives commonly used in Web development: • Conceptual: represents the conceptual elements that make up the application domain; • Presentation: represents the characteristics related to application layout and arrangement of interface elements;
II. THE DEVELOPMENT OF WDP - WEB DESIGN PERSPECTIVES-BASED USABILITY EVALUATION TECHNIQUE General usability evaluation methods can be divided into two categories: (1) Usability Inspections - evaluation methods based on Experts’ Analysis; and (2) Evaluation Methods involving User Participation (Usability Tests), such as: Laboratory studies, Think Aloud and Cooperative Evaluation [14]. When using Evaluation Methods involving user participation, usability problems are discovered by means of observation and interaction with users, while they perform tasks or provide suggestions about the interface design and its usability. In Usability Inspection, the focus of our research, defects can be discovered by professionals (that can be experts) applying inspection techniques. Different usability inspection techniques have been developed and 228
and Web design perspectives in WDP v3. Figure 2 shows an extract of the WDP v3 technique.
•
Navigation: represents the navigational space, defining the information access elements and their associations. Therefore, we propose the use of Web Design Perspectives as a guide to interpret Nielsen’s heuristics. This derived technique we call Web Design Perspectives-based Usability Evaluation (WDP). Hints were provided for each related pair Heuristic x Perspective (HxP) to guide the interpretation of each heuristic from a perspective’s viewpoint. Following the experimental methodology (see Section 1), we executed a first feasibility study in June 2006 [10]. Its goal was to compare the first version of WDP technique to Heuristic Evaluation (HEV) using as measure the number of defects found while inspecting an existing Web application. Participants were 20 undergraduate students attending a Human-Computer Interaction course at the Federal University of Rio de Janeiro (UFRJ), equally distributed in four teams, according to their experience in Software Developing (High, Medium, or Low). Results showed that high & medium-experience participants found twice as much defects when using the WDP technique compared to the HEV technique. In addition, low-experience subjects found three times as much defects when using WDP technique compared to the HEV technique. Finally, the two teams who used the WDP technique, despite differing largely on their experience levels, did not present a significant difference in the number of reported defects, suggesting that the WDP technique’s effective use does not seem to depend upon inspectors’ expertise. The WDP technique was reviewed in light of the results from the first feasibility study, leading to the second version of the WDP technique (WDP v2) [10]. Since we were unable to establish in the first feasibility study any relationship between the number of detected defects, the total number of existing defects and the time spent by inspectors, a second feasibility study was carried out during November December 2006 [12]. Its goal was to compare the efficiency and effectiveness between the WDP v2 technique and the HEV technique. Within the context of this study efficiency and effectiveness were defined as follows: • Efficiency: the ratio between the number of detected defects and the time spent in the inspection process; • Effectiveness: the ratio between the number of detected defects and the total number of existing (known) defects. Fourteen subjects participated in the study, all from different courses taught at UFRJ (three undergraduate students, nine M.Sc. students and two PhD students). The results of the statistical analysis showed that the WDP v2 technique was significantly more effective than and as efficient as Nielsen’s Heuristic Evaluation. In addition, the results of this study were also used as input to further improve the WDP technique, resulting in its third version (WDP v3) [4]. Table I presents the three Web design perspectives used in WDP v3 and their related focus in usability evaluations. In addition, Table II shows the associations between heuristics
TABLE I.
WEB DESIGN PERSPECTIVES RELATED TO USABILITY EVALUATION
Web Design Perspectives Conceptual
Presentation
Navigation
Usability Focus Relates to the clarity and the concision of problem domain’s elements. Under this perspective, the usability is satisfactory if different users easily understand domain terms, what prevents mistakes caused by ambiguous, inconsistent or unknown terms. Relates to how consistent the information is presented to the user. Under this perspective, the usability is satisfactory if the arrangement of interface’s elements allow the user to accomplish his/her tasks effectively, efficiently and pleasantly. Relates to different user’s access to the system functionalities. Under this perspective, the usability is satisfactory if the navigation options allow the user to accomplish his/her tasks effectively, efficiently and pleasantly.
TABLE II.
RELATIONSHIPS BETWEEN HEURISTICS AND DESIGN PERSPECTIVES IN WDP V3
Heuristics [5] 1.Visibility of system status 2.Matching between system and real world 3.User control and freedom 4.Consistency and Standards 5.Error prevention 6.Recognition rather than recall 7.Flexibility and efficiency of use 8.Aesthetic and minimalist design 9.Help users recognize, diagnose and recover from errors 10.Help and documentation
Web Design Perspectives Presentation
Conceptual
A.1
C.1
A.2
C.2
A.4 A.5
C.4
Navigation
N.3 N.5
A.6 A.7
N.7
A.8 A.9
C.9
N.9
A.10
C.10
N.10
Usability related to Presentation A.4 Consistency and Standard • Evaluate if the terms, graphs and symbols of the interface are consistent • Evaluate if the interface adhere to the adopted standards for layout and controls • Evaluate if the interface is consistent for equivalent tasks • Evaluate if the errors messages are presented in a consistent way according to the adopted standards Figure 2. Extract of WDP v3
III.
THE OBSERVATIONAL STUDY
Since the results obtained from the experimental studies seemed to indicate the WDP’s feasibility and its possibility to be more effective than, and as efficient as, the Heuristic
229
Evaluation [5], we went one step further on following the experimental methodology, in order to also answer the second question of the methodology (see Figure 1): “Do the steps of the process make sense?”. To investigate this question, we performed an observational study with the purpose of eliciting the process used by the usability inspectors when applying the technique during a usability evaluation. During the two feasibility studies [12], subjects (inspectors) who applied the WDP technique received training on Usability Evaluation and the WDP technique prior to using it. However, they were not prescribed any particular sequence in which to apply the technique (e.g. to focus at one perspective at a time, or to focus at one heuristic at a time). As a result, the two feasibility studies informed us on the WDP’s efficiency and effectiveness; however we obtained no feedback regarding the sequence employed by each inspector when applying the WDP technique. Such feedback is important as it could indicate whether a sequence is more appropriate to apply the technique. We also wanted some indication about which order would be easier to follow for novice inspectors. According to the experimental methodology that we are using to improve the WDP technique, the most effective way to gather this type of information is through an observational study [7]. The purpose of an observational study is to collect data about how a particular task is accomplished. Observational techniques can be used to understand current work practices [17]. They are also useful for getting a finegrained understanding of how a process is applied. In this study, we gathered two types of data: observational and inquisitive data. The observational data was collected during the inspection process, without the researcher’s interference. To gather the observational data, we used two methods: (1) the observer-executor method, in which subjects were divided in pairs with two roles: the “executor”, who carries out the inspection and the “observer”, who watches carefully how the “executor” conducts the inspection; (2) the cooperative evaluation, which is a variation of “Think aloud” method [18]. The cooperative evaluation was the interaction protocol used by each pair observer-executor, since the executor describes (or “thinks aloud”) what (s)he is doing and the observer is free to ask questions/explanations about the executor’s decisions or acts [18]. The inspection was divided in two parts such that all subjects would be able to play both roles, i.e., the subjects that were “observers” in Part I, became “executors” in Part II and vice-versa. Inquisitive data was gathered at the completion of inspection using follow-up questionnaires. According to the experimental methodology described in [6,7], the goal of the observational study should answer the question: “Do the steps of the process make sense?”. However, the WDP technique is a checklist-based inspection technique, and as such does not have a fixed order of steps to be followed. According to Zhang et al. [16], we know that focus at one perspective at a time would bring better inspection results. Then, we recommended that the inspectors applied the WDP (v3) technique focusing at one perspective at a time. And we also suggested the sequence in
which to apply the perspectives: first the heuristics related to the Presentation Perspective, followed by the heuristics related to the Navigational Perspective and finally the heuristics related to the Conceptual Perspective. This order was chosen based on the results of the second feasibility study for each perspective [4]. Note that: (1) we only suggested a sequence to be used with the Perspectives instead of a complete process to follow; and (2) the sequence that was suggested was only a recommendation, so subjects could still use a different sequence when applying the Perspectives. We performed this observational study in 2007 using the third version of the WDP technique (WDP v3). Herein our aim was to understand deeply the WDP process, so we did not compare the WDP with any other technique. The observational study is detailed below: A. Goal The goal of this observational study, presented using the GQM paradigm [19], can be formalized as: Analyze Web Design Perspective-based Usability Evaluation Technique (WDP v3) For the purpose of understanding With respect to how the inspectors apply the WDP technique From the point of view of Software Engineering researchers In the context of the evaluation of the usability of a real Web application by undergraduate students with previous usability knowledge. B. Subjects The 14 subjects were students attending an undergraduate-level Human-Computer Interaction class, offered to Computer Engineering students at the Federal University of Rio de Janeiro, Brazil. All of them had received training in usability evaluation, using different techniques, such as heuristic evaluation [5] and cognitive walkthrough [15]. In addition, all subjects signed a consent form and were split into two groups (A and B), each containing seven subjects, arranged using as criterion subjects’ assignments grades. Group A contained the top seven students and Group B the remaining students. All the Observer-Executor pairs had one student from each group. C. Context Selection The object of this study was the same application used in the two feasibility studies (JEMS - Journal and Event Management System). The JEMS application is used to support the process of conference creation, user’s registration, submission, revision, acceptance and publishing of papers from conferences and journals sponsored by Brazilian Computer Society. Since we already have a defect list from the second feasibility study, we selected the same inspection domain – the six use cases associated with the role ‘Reviewer’. All the remaining tasks that needed to simulate a real conference (e.g. conference creation, deadlines setup, papers submission) were carried out by the authors. Part I comprised by the inspection of four use cases related to the initial activities of the Reviewer when received the invitation
230
to be part of the program committee of a conference (‘Confirm participation in the conference’, ‘User authentication’, ‘Inform topics of interest’ and ‘Inform topics of conflict’). Part II included two cases of use related to the review itself (‘Retrieve paper for review’ and ‘Submit review’).
the defects’ list from the second study. For each discrepancy reported, the moderator and the usability specialist verified if it was equivalent to any of the defects from the second study’s list. If the discrepancy was not equivalent to any defect, the second researcher verified if it was a real defect or a false-positive. This classification was double-checked by two other authors. We analyzed both the quantitative and the qualitative data. The quantitative data was obtained from the discrepancies’ worksheets, by comparing them with the defects’ list from the second study. The results of the quantitative analysis are presented in Section 4. We analyzed the qualitative data using concepts from Grounded Theory [22], as detailed in Section 5.
D. Procedure All subjects received proper training regarding JEMS, the WDP technique, the Observer-Executor method and the Cooperative Evaluation method. Then they were arranged into pairs to work together in Part I. • During Part I, Group B subjects were the “executors” and Group A the “observers”. As previously mentioned, “executors” were suggested to apply the WDP technique in a set sequence (1o heuristics related to the Presentation Perspective, 2o - heuristics related to the Navigational Perspective and 3o - heuristics related to the Conceptual Perspective). Once Part I was completed, “executors” provided a worksheet with the discrepancies found and a follow-up questionnaire containing their impressions regarding the WDP technique; “observers” provided forms containing any notes taken during Part I. • We changed the pairs for Part II, but keeping one student from Group A and other from Group B on each pair. During Part II, Group A subjects now became the “executors”. Notice that, at this point, Group A subjects had already a good grasp of usability techniques (reflected in their grades), and in addition had also observed Group B applying the WDP technique, which in our view increased their knowledge of usability inspection and the WDP technique. We stressed to the participants that if they did not agree with to use the suggested sequence, they could use any other sequence as they saw fit. Finally, we also observed carefully how this group chose to apply the WDP technique.
IV.
QUANTITATIVE DATA ANALYSIS
After the discrimination activity, we counted the number of discrepancies, false-positives and defects by inspector and by part (Parts I and II). We did not compare the results of the two parts (Parts I and II) because they had different inspection interactions (Part I and Part II subjects inspected different groups of use cases). It is important to notice that the observer could question the executor’s actions at any time, but (s)he was not allowed to help the executor in the discovery activity. Table III presents the overall results of the usability evaluation for each scenario. TABLE III.
SCENARIOS' RESULTS SUMMARY
Part I 138
Discrepancies
110
False Positives
40
False Positives
13
Defects
98
Defects
97
Types of Defects
E. Data Collection and Validation One of the authors who were responsible for conducting the observational study was acting as the inspection’s moderator. The moderator checked all discrepancies’ worksheets for incorrect or missing information and also gathered the discrepancies. A discrepancy is an issue reported by the inspector that could be a real defect or a false-positive. During the collection activity [20], the moderator highlighted duplicated discrepancies. According to the empirically evaluated suggestion by Lanubile and Mallardo [21], duplicated discrepancies might be classified as defects. After the collection activity, the discrimination meeting (activity in which the discrepancies were classified as real defects or false-positives) was executed by the moderator and another researcher (not involved with the study) with good usability knowledge and prior experience in usability evaluation. The purpose of this meeting was to analyze all discrepancies found for each inspector, comparing them with
Part II
Discrepancies
Defects equivalent to the 2nd study defects list New defects (not reported in 2nd study)
59 Types of Defects 39
Defects equivalent to the 2nd study defects list New defects (not reported in 2nd study)
55
42
Table IV presents the results for each inspector of Part I, showing the time, the number of discrepancies reported, the number of false positives among these discrepancies, the actual number of defects and the efficiency of each inspector (calculated as the ratio between the number of defects found and the time spent). Table V shows the same data to the inspectors of Part II. We computed an efficiency indicator, computed as the average number of defects found divided by the average effort spent on detection activity, for both Parts I and II. The efficiency indicator in Part I was 11.93 defects per hour per inspector, and in Part II was 14.41 defects per hour per inspector. Comparing these measures with the average of 6.45 defects per hour of the group of inspectors who used the technique WDP v2 in the second feasibility study, we can notice that both measures were higher in the study of observation. The efficiency obtained in Part I was almost twice the average of the second feasibility study (ratio equal
231
to 1.85) and efficiency in Part II was more than double (ratio equal to 2.23). However, as mentioned, we cannot claim that the improvement in efficiency indicator is due solely to improve the WDP v3 on WDP v2. Other factors such as: (1) the increased knowledge on usability evaluation, (2) the evaluation scope of each Part was smaller than the scope of the second study and (3) the fact that the inspection was made in pairs, should be considered. TABLE IV.
practitioners, as pointed in [23]. We believe these results are encouraging for experimentation in software engineering because students are often used as substitutes for real world inspectors in many studies. V.
We analyzed the qualitative data using the procedures from the Grounded Theory (GT) method [22]. The Grounded Theory is a qualitative method for data analysis, in which a theory is derived from data, systematically gathered and analyzed through the research process [22]. The GT method is based on coding – the analytic processes through which data are fractured, conceptualized, and integrated to form a theory. The GT method contains three data analysis steps: open coding, where concepts are identified and their properties and dimensions are discovered in the data; axial coding, where connections between the categories (and subcategories) are identified; and selective coding, where the core category (that integrates the theory) is identified and described [22]. The process of grouping concepts that seem to pertain to the same phenomena is called categorizing, and it is done to reduce the number of units to work with. In this observational study, it was not necessary to execute all three data analysis steps, because we could realize the answer to our research question (“how do the inspectors apply WDP technique?”) after the execution of open/axial coding activities. For this reason, we do not claim that we have applied the GT method comprehensively, only some specific procedures applied to the executed activities. The data analysis began with the open coding of the follow-up questionnaires. Figure 3 shows the main questions of the follow-up questionnaires. The objective of the open coding activity was to analyze the data collected and allocate codes to the text. We did not use “seed categories” (an initial set of codes), we started coding directly from the text, creating in-vivo codes. The open coding procedures stimulate the constant creation of new codes and merging of existing codes as new evidence and interpretations emerged.
SUMMARY OF INSPECTION RESULTS PER SUBJECT - PART I Part I
Subject
Time (min)
Discrepancies
False Positives
Defects
Efficiency (Defects/ Hour)
01
81
15
02
13
09,63
02
45
24
05
19
25,33
03
144
31
11
20
08,33
04
45
22
08
14
18,67
05
49
15
06
08
09,80
06
69
19
04
15
13,04
07
60
13
04
09
09,00
AVG
70,43
19,86
05,71
14,00
-
TABLE V.
SUMMARY OF INSPECTION RESULTS PER SUBJECT - PART II Part II
Subject
Time (min)
Discrepancies
False Positives
Defects
Efficiency (Defects/ Hour)
08
75
20
01
19
15,20
09
60
17
06
11
11,00
10
80
17
01
16
12,00
11
67
09
00
09
08,06
12
20
09
00
09
27,00
13
29
23
04
19
39,31
14
73
15
01
14
11,51
AVG
57,71
15,71
01,86
13,85
-
QUALITATIVE DATA ANALYSIS
From the point of view of usability inspection, what is your opinion about the adequacy and ease of use of the evaluation method? 2. Were the proposed perspectives (presentation, navigation, and conceptual) described in such a way that their meanings could easily be understood? If not, what could be improved? 3. Did the union of perspectives and heuristics result in some kind of difficulty or facility in the discrepancies detection? 4. Do you have comments about the application of any heuristic x perspective pair? 5. In a new usability evaluation, would you consider using these perspectives again? What would you suggest in this new application? 6. Comment about the technique application and the identified problems. 1.
Tables III and V show that there was a small number of false positives reported by Part II inspectors. The percentage of false positives was 28,99% in Part I and only 11,82% in Part II. Comparing these results with the percentage of false positives found by the inspectors using the WDP technique in the second feasibility study (False Positives = 26,97%) [4], we can notice that Group A subjects found a very small number of false positive defects in Part II. These results may have happened due to Group A’s greater interest in the WDP technique, and also due to their participation as observers in Part I. Besides, these quantitative results indicated that students with good training present similar inspection skills to
Figure 3. Follow-up Questionnaire
232
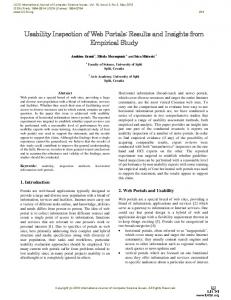
Figure 4. Application Sequence Category
In the next step, axial coding, the codes are grouped according to their properties forming concepts that represent categories. These categories are analyzed and subcategories are identified aiming to provide more clarification and specification. Finally, the categories and subcategories are related to each other, and the causal relationships between the categories were determined. In practice, the open and axial coding steps overlapped and merged because the process proceeded iteratively. At the end of this analysis, the coding processes produced altogether 89 codes which were associated to 03 categories: WDP Structure, Ease of Use and Application Sequence. Although the study’s objective was to identify how the inspectors apply the WDP technique, the follow-up questionnaire had questions about the appropriateness and ease of use of the technique, which led to the identification of the categories: WDP Structure and Ease of Use. With axial coding, we could observe that aspects related to the ease of use of the technique influence the application sequence adopted by the inspectors. Figure 4 shows the relationships of Application Sequence category. This category shows the codes assigned to the comments of the inspectors on how they applied the technique. Each associated code was considered a type or variation of application sequence, and each one was related to the category via the connector "is a". The codes that are preceded by "[XX]" (where XX is a symbol marked the category) are the categories and subcategories. Note that these codes that represent the categories and subcategories are not linked to citations in the questionnaires. Analyzing Figure 4, one can note that the application sequence ranged from: • Alternation between identification of defects from HxP pairs and identification of HxP pairs from defects. In this case, the application did not follow any fixed order. • Suggested order (1o Presentation, 2o Navigation and 3o Conceptualization) – in this case, the application followed the order suggested by the researchers. It should be noted that some inspectors who used such an order does not mention it directly in the questionnaire for monitoring, reporting this only by email. As the researchers chose to not change any text of the questionnaires received, this
code (“suggested order”) was associated only by direct quote. • Sequence order: 1o Presentation, 2o Conceptualization and 3o Navigation - this order was followed by only one inspector, who presented the reasons explaining why he believes that navigation should be the third perspective to be evaluated: the navigation view is not static and to evaluate a link you must change the page. Although this has been the observation of only one inspector, this was an important contribution. The suggested order for applying the perspectives was modified after the analysis of these results. • Sequence order: free after familiarity - As noted in [7], inspectors tend to adjust the technique to their own way of thinking about a problem. This code was assigned to a direct quote from an inspector, but it is related to codes such as "familiarity with the technique allows the inspector to rearrange inspections approach" and "familiarity with the technique makes the inspector finds other heuristics associated with a problem ", which are associated with citations from other inspectors. With the detailed analysis of the codes in the Application category sequence, we could answer the question: “How do the inspectors apply the WDP technique?”. However the Grounded Theory method also comprises the selective coding phase, the identification of the core category of the theory, with which all others are related. The core category should be able to integrate all other categories and express the essence of the social process that occurs between those involved. We decided not to elect a core category yet, because a Grounded Theory rule is the circularity between the collection and analysis stages [24]. At this study, we had had only a data collection round, and it was not possible to validate the properties of the categories identified. Because of this, we decided to postpone the selective coding phase. A. Qualitative Analysis Results Seaman [17] notes that qualitative data can be used to go beyond the statistics and help explain the reasons behind the hypotheses and relationships. When we use analytic methods to examine qualitative data, we achieve a much deeper understanding of the whole phenomena. While browsing
233
TABLE VI.
systematically through the data and coding the occurrences of WDP process-related phenomena, the authors started to understand deeply how the inspectors apply the WDP technique. There was no single answer to the question "How do inspectors apply the technique WDP". The variation of the application order of the WDP technique suggests three different ways of applying it in the observational study: • 1st: the application of the technique did not follow any order. • 2nd: the application of the WDP technique was in the order suggested by researchers • 3rd: the application of the technique began with the order suggested by the researchers then followed an adapted order. The inspectors who applied the technique without following any order just browsed the Web application, looking for the usability problems. When they identified a possible usability problem, they tried to relate the problem to a specific HxP pair. But many times they felt unsure as to which Heuristic and/or Perspective would be related to the usability problem identified, as exemplified by quotations related to codes of the category "Ease of Use". The other inspectors who applied the WDP in the order or even suggested an adapted order have not reported the same level of difficulty in using the WDP technique. Some of the experienced inspectors reported that they grasped the principles of the WDP technique after inspecting the application for a short period, suggesting that the WDP’s learning curve was small. Once experienced inspectors fully grasped the technique, they ruled out the need to follow any prescribed order in which to apply the WDP technique. As noted in [7], inspectors tend to adjust the technique to their own way of thinking about a problem. Using data from questionnaires was not possible to identify whether there were any other factors that influence the choice of the inspector to follow or not particular order. At first the order choice was only a personal decision of the inspector. One of the inspectors who do not follow a fixed order of application stated the need for greater guidance to apply the technique. Motivated by these results, we decided to evolve the WDP technique into a reading technique (called WDP-RT). According to Travassos et al. [25], a reading technique is a specific type of inspection technique that has a series of steps for the individual analysis of a software product to achieve the understanding needed for a particular task. Reading techniques attempt to increase the effectiveness of inspections by providing procedural guidelines that can be used by individual reviewers to examine a given software artifact and identify defects [25]. We believe that, having those procedural guidelines, it would be easier for a novice inspector to execute a usability evaluation. The analysis of the qualitative data also provided us with important feedback to improve further the WDP technique, as it pointed out specific problems in some HxP (Heuristic x Perspective) pairs (See Table VI). This led to a new version of the WDP technique (WDP v4), with improvements in some hints of HxP pairs.
SPECIFIC PROBLEMS FOUND IN HXP (HEURISTIC X PERSPECTIVE) PAIRS.
Problem with A.1 and C.1 HxP Pairs – doubt about which one relate to a usability problem Problem with A.6 HxP Pair – its description refers to Conceptual perspective Problem with A.7 HxP Pair – difficulty in separating from Navigation Perspective Problem with A.8 HxP Pair - hints relate more about minimalist design than on the aesthetics issue Problem with C.10 and N.10 HxP Pairs – doubt about which one relate to a usability problem Problem with C.10 HxP Pair - description could be simpler Problem with equivalence between hints 1 and 3 of A.10 HxP Pair Problem with equivalence between hints 1 and 3 of A.2 HxP Pair Problem with N.7 HxP Pair – incomplete hints Problem with similarity between hint 1 of A.7 HxP Pair and hint 1 of N.7 HxP Pair Problem with similarity between hint 3 of A.8 HxP Pair and hint 1 of A.9 HxP Pair
VI.
CONCLUSIONS AND COMMENTS ON FUTURE WORK
This paper described an observational study aimed at eliciting the activities sequence used by usability inspectors when applying the WDP technique. Both quantitative and qualitative results of this study provided us with important feedback to improve the WDP technique further. The quantitative analysis showed that the efficiency indicator computed for Parts I and II were higher than the efficiency measured in the second feasibility study. However, as previously discussed, other factors may have influenced this outcome besides the improvement of WDP technique. We could also note the difference between the percentages of false positives, Part I (28.99%) and Part II (11.82%). Compared with the percentage of false positives reported by the inspectors who used the technique WDP in the second feasibility study (26.97%), one can notice that the inspectors in Part II (participants of Group A) reported a small number of false positives. This result can be attributed to different factors: Group A was formed by students with the best performance in classroom exercises, as well as their participation as observers in Part I may have increased their knowledge about how to perform an usability evaluation. This is one hypothesis to be investigated in future studies. The qualitative analysis showed that there was no single mode of application of the WDP technique. The qualitative analysis results motivated us to propose to extend the WDP technique into a reading technique called WDP-RT. This will allow usability inspectors to choose between two categories of usability inspection techniques: (1) WDP – the checklistbased technique, with its HxP pairs improved with the results of the observational study (WDP v4 [13]); and (2) WDP RT – the evolved reading technique, aimed at reducing novice inspectors’ difficulties. Future work entails: (1) a new collection-analysis round to further complete the qualitative analysis, (2) the fully development of a different type of WDP technique, a reading
234
technique called WDP-RT, and (3) further studies comparing the WDP technique with other inspection techniques specific for evaluate Web applications usability, such as CWW [26] and MILE+ [27].
[13]
ACKNOWLEDGMENT The authors would like to thank Cleidson de Souza and Mariano Montoni for their help with GT. We would also like to thank Vinicios Bravo for his assistance during the observational study, Ulysses Vilela for his review of the improvements in the WDP current version and all the students who participated in the observational study. This work has been partially supported by the ESE and Science in the Large Scale Project CNPq (475459/2007-5), FAPERJ and FAPEAM.
[14]
[15]
[16]
REFERENCES [17] [1] [2] [3]
[4]
[5]
[6]
[7]
[8]
[9]
[10]
[11]
[12]
E. Mendes, “Cost Estimation Techniques for Web Projects”, IGI Publishing, 2007. J. Offutt, “Quality Attributes of Web Software Applications”, IEEE Software, v. 19, n. 2, pp. 25-32, 2002. M. Matera, F. Rizzo, G. T. Carughi, “Web Usability: Principles and Evaluation Methods”, In: E. Mendes, N. Mosley, (eds), Web Engineering, Chapter 5, New York, Spinger Verlag, 2006. T. Conte, J. Massolar, E. Mendes, G. H. Travassos, “Web Usability Inspection Technique Based on Design Perspectives”, IET Software Journal, v. 3, n. 2, pp. 106-123, 2009. J. Nielsen, “Heuristic evaluation”, In: Jakob Nielsen, Mack, R. L. (eds), Usability inspection methods, Heurisitic Evaluation, New York, NY, John Wiley & Sons, Inc, 1994. S. Mafra, R. Barcelos, G. H. Travassos, “Aplicando uma Metodologia Baseada em Evidência na Definição de Novas Tecnologias de Software”, In: Proceedings of the 20th Brazilian Symposium on Software Engineering (SBES 2006), v. 1, pp. 239 – 254, Florianopolis. October, 2006. F. Shull, J. Carver, G. H. Travassos, “An empirical methodology for introducing software processes”, ACM SIGSOFT Software Engineering Notes, v. 26, n. 5, pp. 288296, 2001. B. Kitchenham, “Procedures for Performing Systematic Reviews”, Joint Technical Report Keele University TR/SE0401 and NICTA Technical Report 0400011T.1, Keele University and NICTA, 2004. J. C. D. A. Biolchini, P. G. Mian, A. C. C. Natali, T. Conte, G. H. Travassos, “Scientific research ontology to support systematic review in software engineering”, Advanced Engineering Informatics, v. 21, n. 2, pp. 133-151, 2007. T. Conte, J. Massolar, E. Mendes, G. H. Travassos, “Web Usability Inspection Technique Based on Design Perspectives”, In: Proceedings of the 21th Brazilian Symposium on Software Engineering (SBES 2007), v. 1, pp. 394-410, João Pessoa, Brazil. October 2007. T. Conte, E. Mendes, G. H. Travassos, “Processos de Desenvolvimento para Aplicações Web: Uma Revisão Sistemática”, in: Proceedings of the 11th Brazilian Symposium on Multimedia and Web (WebMedia 2005), v. 1, pp. 107 - 116, Poços de Caldas. November 2005. T. Conte, J. Massolar, E. Mendes, G. H. Travassos, “Usability Evaluation Based on Web Design Perspectives”, in:
[18]
[19]
[20]
[21]
[22]
[23]
[24]
[25]
[26]
[27]
235
Proceedings of the First International Symposium on Empirical Software Engineering and Measurement (ESEM 2007), Madrid, Spain. September 2007. V. Vaz, T. Conte, A. Bott, E. Mendes, G. H. Travassos, “Inspeção de Usabilidade em Organizações de Desenvolvimento de Software – Uma Experiência Prática”, in: Proceedings of the 7th Brazilian Symposium on Software Engineering (SBQS 2008), v. 1, pp. 369-378, Florianopolis Brazil, 2008. R. O. Prates, S. J. Barbosa, “Avaliação de Interfaces de Usuário - Conceitos e Métodos”.In: J. M. A. Coello, S. C. P. F. Fabbri, (eds), Jornada de Atualização em Informática do Congresso da Sociedade Brasileira de Computação, Capítulo 6, Campinas, SBC, 2003. P. Polson, C. Lewis, J. Rieman, C. Wharton, “Cognitive walkthroughs: a method for theory-based evaluation of user interfaces”, International Journal of Man-Machine Studies, v. 36, n. 5, pp. 741-773, 1992. Z. Zhang, V. Basili, B. Shneiderman, “Perspective-based Usability Inspection: An Empirical Validation of Efficacy”, Empirical Software Engineering, v. 4, n. 1, pp. 43-69, 1999. C. B. Seaman, “Qualitative Methods in Empirical Studies of Software Engineering”, IEEE Transactions on Software Engineering, v. 25, n. 4, pp. 557-572, 1999. A. Dix, J. E. Finlay, G. D. Abowd, R. Beale, “HumanComputer Interaction” (3rd Edition), Prentice-Hall, Inc., 2003. V. Basili, H. Rombach, “The tame project: towards improvement-oriented software environments”, IEEE Transactions on Software Engineering, v. 14, n. 6, pp. 758 – 773, 1988. C. Sauer, D. R. Jeffery, L. Land, P. Yetton, “The Effectiveness of Software Development Technical Reviews: A Behaviorally Motivated Program of Research”, IEEE Transactions on Software Engineering, v. 26, n. 1, pp. 1-14, 2000. F. Lanubile, T. Mallardo, “An Empirical Study of Web-Based Inspection Meetings”, in: Proceedings of the 2003 International Symposium on Empirical Software Engineering, pp. 244-251, Rome, Italy. September 30 - October 01, 2003. A. Strauss, J. Corbin, “Basics of Qualitative Research: Techniques and Procedures for Developing Grounded Theory”, 2ed. London, SAGE Publications, 1998. J. Carver, L. Jaccheri, S. Morasca, F. Shull, “Issues in Using Students in Empirical Studies in Software Engineering Education”, in: Proceedings of the 9th International Symposium on Software Metrics (METRICS’03), pp. 239 – 249, Sydney, Australia, 2003. R. Bandeira-de-Mello, C. Cunha, “Grounded Theory”, in: C. K. Godoi, R. Bandeira-de-Mello, A. B. Silva, (eds), Pesquisa Qualitativa em Estudos Organizacionais: Paradigmas, Estratégias e Métodos, Chapter 8, São Paulo, Saraiva, 2006. G. H. Travassos, F. Shull, J. Carver, V. Basili, “Reading Techniques for OO Design Inspections”, Technical Report, University of Maryland, 2002. M. H. Blackmon, P. G. Polson, M. Kitajima, C. Lewis, “Cognitive walkthrough for the web”, in: Proceedings of the SIGCHI conference on Human factors in computing systems: Changing our world, changing ourselves, v. 5 (1), pp. 463 470, Minneapolis, Minnesota, USA, 2002. D. Bolchini, F. Garzotto, “Quality of Web Usability Evaluation Methods: An Empirical Study on MiLE+”, in: International Workshop on Web Usability and Accessibility (IWWUA) WISE 2007 Workshops, v. LNCS 4832, pp. 481 492, Nancy, France, 2007.