Improving environmental decision-making: bridging the gap between conceptual modelling and quantitative analyses with Quasta Frank van Kouwen, Carel Dieperink, Paul P. Schot and Martin J. Wassen Copernicus Institute for Sustainable Development and Innovation Department of Environment and Innovation PO Box 80115, 3508 TC Utrecht, The Netherlands
[email protected],
[email protected]
Abstract With regard to environmental decision-making, the field of conceptual modelling is primarily focused on representation and visualisation. As such, the ‘soft’ problem structuring methods have limited analytical value. On the other hand, quantitative analyses with various types of ‘hard’ models lack in flexibility and versatility. The Quasta approach as presented in this paper aims to bridge the gap between soft and hard systems by allowing qualitative analysis on the basis of a purely conceptual model. The method can be used to identify the key elements to be modelled in a quantitative system, in order to address the problems as captured in the conceptual model. Keywords: Cognitive mapping, probabilistic reasoning, qualitative modelling.
1
Introduction
Conceptual modelling comprehends ‘soft’ approaches than can be used to structure problems in a participatory manner (Mingers and Rosenhead, 2004; Rosenhead and Mingers, 2001). These problem structuring methods are not aimed at calculating an ‘optimal’ solution. Instead, they acknowledge that the most challenging task in decision-making is to collectively define a problem (Rosenhead and Mingers, 2001). However, the analytical value of these soft approaches is limited, as these are primarily focused on representation and visualisation. As an alternative, quantitative mathematical models can be used. However, many of these ‘hard’ models are developed and used by modellers and researchers and are not aimed at interactive usage by non-technicians. In order to meet this challenge, Decision Support Systems (DSSs) or Planning Support Systems (PSSs; tools for spatial planning) have been developed. These tools are designed for quantitative analyses, such that the tool can be used interactively by non-technicians. However, many Copyright (c) 2007, Australian Computer Society, Inc. This paper appeared at the Twenty-Sixth International Conference on Conceptual Modeling - ER 2007 - Tutorials, Posters, Panels and Industrial Contributions, Auckland, New Zealand. Conferences in Research and Practice in Information Technology, Vol. 83. John Grundy, Sven Hartmann, Alberto H. F. Laender, Leszek Maciaszek and John F. Roddick, Eds. Reproduction for academic, not-for profit purposes permitted provided this text is included.
of these tools are rather tailor-made (van Kouwen et al., 2007a), meaning that the content of the systems cannot be adjusted by the users. Although this would be desirable, most PSSs have not been designed as collaborative tools (Klosterman, 2005). As such, the DSS and PSS tools lack in flexibility and versatility. As such, a gap can be detected between the ‘hard’ analytical DSS or PSS style computer systems and the ‘soft’ problem structuring methods. Aim of this paper is to present a qualitative modelling approach, which can help to bridge this gap. The proposed method allows scenario analysis on the basis of a purely conceptual model. It can be used to identify the key elements to be modelled in a quantitative system. The methodology derives these key elements from the problem structure as captured in the conceptual model. As such, it provides an explicit link between conceptual modelling and quantitative analyses. Since the research was conducted in a context of environmental sciences, the examples and illustrations as presented in this paper are focused on environmental issues and sustainability challenges.
2
Cognitive Mapping
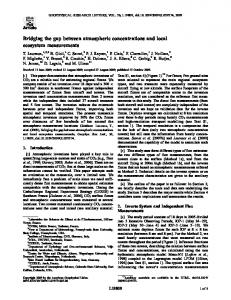
The technique Cognitive Mapping, also known as mental model mapping or concept mapping, can be used to represent knowledge about a certain system or problem (Ackermann and Eden, 2005; Kolkman, 2005; Kolkman et al., 2005; Soini, 2001). The technique is an interactive method for problem structuring and decision-making in groups (Axelrod, 1976; Eden and Ackermann, 2004; Vennix, 1996). Diagrams as used in Cognitive Mapping are useful as they show the connectedness of elements in ‘wicked’ (complex) systems, and they make underlying assumptions more explicit (Courtney, 2001). In this paper, we use Cognitive Maps as defined and described by Axelrod (1976). In this definition the nodes represent variables taking their values in ordered sets and the arrows represent cause-and-effect relationships. The arrows can be either positive or negative. Figure 1 shows a simple example of a Cognitive Map. A positive arrow from variable A to B means that an increase of A is believed to cause an increase of B. A negative arrow from A to B means that an increase of A is believed to cause a decrease of B. Cognitive Maps allow for the representation of key elements of complex systems, as well as their relationships, in a comprehensible diagram.
Climate change Extreme rainfall Sea level rise Relationship Positive Negative
Flooding areas commissioned by government
Peak levels of rivers
Safety in catchment areas
Spatial pressure
Wellman (1994) designed a qualitative approach for computer-supported analysis, in which no strengths have to be specified. He adopted the concept of Qualitative Probabilistic Networks (QPNs; see Wellman, 1990), and suggested to use these for computer-supported reasoning with Cognitive Maps (Wellman, 1994). As such, Wellman’s approach offers some starting points for a Cognitive Mapping computer tool that can be used interactively in participatory discussion sessions. The formalism of QPNs is based on probability theory, meaning that the formalism does not determine values for variables, but instead gives information about the likelihood of values. Three properties jointly distinguish QPNs from other methods for analysing Cognitive Maps:
Figure 1: An example cognitive map of climate change related issues. The textboxes represent variables that can be mentioned by participants of a discussion. The arrows represent causal relationships among these variables. Figure 1 captures some of the climate change related issues which are typical for the densely populated catchment areas in the Netherlands. Climate change may result in sea level rises and extreme rainfall. Both may lead to high peak water levels in rivers, which may harm the safety in the catchment areas (due to the risk of flooding). To prevent this, the government may propose some commissioned areas which, in case of high water levels, are designated to flood. This may reduce the peak levels of the rivers and may therefore improve the safety of the catchment area as a whole. However, this measure would imply that inhabitants of these areas would be required to move out, and that the spatial pressure, which is already very high in the Netherlands, would increase overall.
2.1
Computer-supported Cognitive Mapping
Cognitive Maps can be used to identify and visualise mental models, but they can also be extended to a computer model to analyse the behaviour of a system (Vennix, 1990). Such an analysis can be done with a number of techniques. An example is the formalism of Fuzzy Cognitive Maps (FCMs), which can be used for rapid modelling of the behavioural aspects of complex dynamic systems (Adriaenssens et al., 2004; Khan and Quaddus, 2004; Özesmi and Özesmi, 2004). As such, the technique enables a quick exploration of different scenarios (de Kok et al., 2000). In FCMs, causal relationships have a certain weight (Khan and Quaddus, 2004), and the maps assume relationships to be linear and quantified. However, for complex, unstructured (‘wicked’) problems this is not always the case; relationships are not always linear and quantitative information is not always available. If the strengths are not specified correctly, this may cause an unrealistic outcome of the FCM model. This risk applies to all types of (semi-) quantitative analysis of Cognitive Maps, e.g. the flow charts used by Vennix (1996).
1.
The analysis is purely qualitative, allowing analysis of a Cognitive Map without any quantitative information.
2.
Contradictory influences on a variable will always be detected and highlighted as ambiguity, indicating that quantitative information is necessary for drawing unambiguous conclusions.
3.
QPNs allow forward and backward reasoning; graphically speaking, the direction of reasoning is in the direction of arrows, as well as in the opposite direction. This means that the technique can be used for both predicting and explaining.
The first characteristic allows the technique to be used interactively during group discussions; the arguments of participants can be visualised with a Cognitive Map and this map can be analysed immediately. This may help to take the participants’ knowledge into account in a structured manner. Additionally, it may help to raise awareness because the technique provides immediate reflection on the conceptual model. The second characteristic allows the QPN technique, based on the problem structure as captured in the Cognitive Map, to identify what quantitative analyses are required to solve the problem; the ambiguously influenced variables are exactly those variables that are required to be modelled quantitatively in order to draw unambiguous conclusions (van Kouwen et al., 2007d). The third characteristic enables both forecasting as well as backcasting. Backcasting is backward reasoning from goals to action plans: what actions need to be taken to achieve certain objectives in the future. Backcasting is an effective approach for involving stakeholders in policy-making, as it promotes social learning (Robinson, 2003).
3
The Quasta approach
The method as presented in this paper is based on the QPN-based Cognitive Mapping technique that originates from Wellman (1994). It is called the Quasta approach, as ‘Quasta’ is an abbreviation for the phrase ‘qualitative start’. This emphasises that it is a purely qualitative approach, to be used from the start of a decision-making process. It should be used for the first steps, in advance of using quantitative analyses.
Research has shown that some additional enhancements were required to transform Wellman’s theories into a ready-to-use computer tool. Firstly, implementation of a QPN-based computer tool requires an algorithm for a correct analysis of these networks. By using the original sign-propagation algorithm (Druzdzel and Henrion, 1993), some incorrect results and unnecessary ambiguity may occur (van Kouwen et al., 2007c). By using the adapted algorithm as presented by Van Kouwen et al. (2007c), this can be prevented. Secondly, QPNs have the formal restriction that these are not allowed to have cycles; no feedback loops are allowed. This may give problems, since Cognitive Maps may have these feedback loops (for this reason, they are also known as causal loop diagrams; see for example Vennix, 1996). Van Kouwen et al. (2007d) present an approach which allows to deal with feedback loops in QPNs. Quasta’s technique allows for the analysis of any Cognitive Map by entering information about its variables. For any variable, the user can give directions. The four possible directions are: the variable increases, is stimulated (‘+’), the variable decreases, is being opposed (‘-’), the variable changes in an unknown direction (‘?’) or the variable is not affected (‘0’). After running the Quasta analysis, the computer caclulates one of the four directions (‘+’, ‘-’, ‘?’ or ‘0’) for each of the other variables for which no direction is given. These directions as determined by the tool can be interpreted as changes that logically fit into a scenario in which the variables are changed in the directions as entered by the user. As such, the analysis can be considered as a qualitative type of scenario analysis. Initially, when there is no information given about any single variable, the resulting effect on all
variables will be indifferent. The Cognitive Map in Figure 1 can be considered a Quasta diagram for which no information about any variable is given. Figure 2 illustrates the forecasting functionality of Quasta; it shows the results from using the tool for scenario analysis with the Cognitive Map from Figure 1. It explores a scenario with an increased climate change. Based on the Cognitive Map, Quasta has determined a direction of change for each of the variables. These are the changes that fit logically in a scenario with climate change. It shows that the climate change results in sea level rise and extreme rainfall, both of which may cause high peak levels of rivers. As a result, the safety in catchment areas is under threat.
Climate change Extreme rainfall Flooding areas commissioned by government
Sea level rise
Peak levels of rivers
Spatial pressure
Safety in catchment areas Relationship Positive Negative
Resulting effect on a variable X
Increase
X
Decrease
X
Ambigous
Climate change Extreme rainfall Flooding areas commissioned by government
Sea level rise
Peak levels of rivers
Spatial pressure
Safety in catchment areas Relationship Positive Negative
Resulting effect on a variable X
Increase
X
Decrease
X
Unaffected
Figure 2: Using Quasta for scenario analysis with the Cognitive Map of Figure 1. A direction has been given for the variable “Climate change” (for this reason, its node is depicted with a thick edge). As such, a scenario with increased climate change is explored.
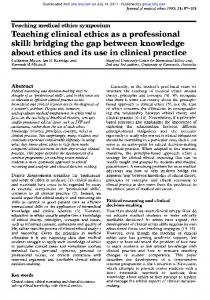
Figure 3: Using Quasta for simultaneous forecasting and backcasting. A scenario with a combination of climate change and safety in catchment areas is explored. In Figure 3, a scenario is explored in which the climate change is combined with an increased safety in catchment areas. The variables ‘sea level rise’, ‘peak levels of rivers’ and ‘extreme rainfall’ have been influenced ambiguously. This is, because there are reasons why these can be expected to increase (due to the climate change) as well as reasons why these can be expected to decrease (because of the increased safety). According to the diagram, there is another factor that may influence the safety: the government may propose some commissioned areas which, in case of high water levels, are designated to flood. However, this measure would imply that the spatial pressure, which is already very high in the Netherlands, would increase overall. These side-effects and the resulting dilemmas are depicted visually with Quasta. Note that Quasta cannot determine whether or not certain scenarios are feasible, especially if there are ambiguous influences. To determine if certain measures
Institute for Sustainable Development and Innovation on 'the development and valorisation of knowledge for sustainable development'. Eight people participated in the workshop. The participants had various backgrounds; some of them were scientists, others were involved in environmental policy-making, consultancy, knowledge management, etc. The workshop language was Dutch and the topic of discussion was Desiccation of Peatlands in the Netherlands. The aim was to develop a common
will suffice and to test the feasibility of scenarios, quantitative information will be required.
4
An example of applying Quasta
To illustrate the functionality of Quasta, the methodology will be applied to an example Cognitive Map. A workshop was organised in May 2006 in Utrecht, The Netherlands, during a symposium of the Copernicus
Lobby of farmers
Lowering water level
Cattle farming
Lowering of soil surface
Oxidation of the peat soil
salination
Diversity in landscape
Subsidation of houses and infrastructural problems
Openness of landscape
Quality of surface water
Agricultural damage due to flooding
Facilities in peat area
Diversity in wild plants
Meadow birds
Agicultural function of peat area
Recreational value of peat area
Relationship
Ecohydrological value of peat area
Peatland as a meadow bird area
Quality of living in peat area
Resulting effect on a variable
Positive Negative
X
Increase
X
Decrease
X
Figure 3: part of the diagram as constructed in a workshop about desiccation of peatlands in the Netherlands (translated to English). A scenario without lowering of the water level is being explored.
Ambiguous
X
Unaffected
strategy about the peatlands. The discussion started by asking the participants what problems they saw in the peatlands with regard to the cycle of lowered water levels, oxidation of the peat soil, and compressed soil surfaces. The next step was to identify the factors that may have caused these problems. During this workshop, the Quasta diagram was visible for each of the participants by means of a large screen and a beamer.Figure 3 shows an edited part of the diagram that has been constructed during this workshop. In peat land areas, there is a problem concerning a vicious circle of lowering the water level, oxidation of the peat soil, lowering of the surface, and in response the water managers will again lower the water level. Figure 3 explores a scenario in which the water level is not being lowered anymore. The tool shows that, based on the participants’ arguments, stopping the process of consequently lowering the water table will result in a scenario which is negative for the agricultural function of the peat area, positive for the ecohydrological value of the peat area, but negative for the peatland as a meadow bird area. The resulting effect on the recreational value and the quality of living the peat area is ambiguous. This is because there are both reasons why these may improve as well as reasons why these may decrease. In such situations, the tool clearly shows what quantitative information is required in order to draw unambiguous conclusions. For instance, on the one hand the lowering of the water level works against subsidation of houses and infrastructural problems, but on the other hand it will (in the long term) result in a lowering of the soil surface which promotes these problems. To determine the resulting effect in a certain time period, one needs to know the balance between these two factors.
urgency for certain measures to be taken. As such, the tool promotes mutual understanding and awareness among participants. Based on the results of this initial problem structuring step, the need for further (in-depth) knowledge can be clarified. When using models for quantitative analyses, the tool provides valuable insights in what should be modelled in order to address the specific problems identified. As a problem structuring tool, Quasta is a flexible instrument; as soon as there are new insights and problem perceptions, the Cognitive Map can be adjusted, new scenarios can be explored, and the resulting need for quantitative information and further knowledge can be identified.
5
This paper has presented the Quasta approach, which allows causal diagrams to be analysed without requiring mathematical functions or quantitative information. As such, Quasta can be considered as an intermediate tool between conceptual modelling and quantitative analyses. This paper has illustrated that Quasta can improve the use of knowledge, due to the fact that it:
When using Quasta interactively in a group setting for scenario analysis, the tool acts as a ‘mirror’ as it gives participants reflection on their lines of reasoning as captured in the diagram. Running the tool usually resulted in some variables being changed in rather unexpected directions. The diagram can be used to trace the reasons for this change. In such a situation, there are two possibilities: 1.
The Cognitive Map appears to be inconsistent with the participants’ ideas;
2.
It appears that the effect determined by Quasta makes sense to participants after all.
In case (1) the tool has helped to reveal mismatches between the participants’ mental models and the diagram, which can be corrected immediately by adapting the diagram. In the practical experiments with Quasta as presented by Van Kouwen et al. (2007b), the workshop participants indicated that the tool helps to reveal inconsistencies. In these situations, the use of Quasta has helped to take the ideas of participants into account in a more consistent manner. In case (2) the tool has facilitated a learning moment: participants become aware of some links between different aspects. It is confirmed that Quasta helps stakeholders become aware of relationships that are new to them (van Kouwen et al., 2007b). This may help participants to understand the
Conclusions
•
is a means to make explicit links between fragmented ‘pieces’ of knowledge. Quasta’s qualitative scenario analysis allows an analytical connection between complex systems, without requiring quantification. As such, it paves the way for further integration of knowledge systems at a quantitative level;
•
comprehends a systematic problem structuring approach to identify the need for further (quantitative) knowledge. More specifically, the commonly occurring ambiguities give an indication about what quantitative information is required in order to address the specific problems;
•
helps stakeholders become aware of the interrelationships between the different aspects of the problem. This is helpful as it promotes mutual understanding among workshop participants.
It has been rather conclusively demonstrated that Quasta can help to improve the use of knowledge. However, so far there have been a limited number of practical applications. Athough the results are positive, more experiments are required to determine the conditions under which the application of Quasta is most effective. Thus far, the tool has merely been used for interactive problem structuring in a group setting. More empirical studies are required to investigate the potential role of Quasta with respect to linkage with quantitative analyses.
6
References
Ackermann, F. and Eden, C., 2005. Using Causal Mapping with Group Support Systems to Elicit an Understanding of Failure in Complex Projects: Some Implications for Organizational
Research. Group Decision and Negotiation 14: 355-376. Adriaenssens, V., de Baets, B., Goethals, P.L.M. and de Pauw, N., 2004. Fuzzy rule-based models for decision support in ecosystem management. The Science of the Total Environment 319(1): 1-12. Axelrod, R., 1976. Structure of Decision - The Cognitive Maps of Political Elites. Princeton University Press, Princeton, New Jersey, USA. Courtney, J.F., 2001. Decision making and knowledge management in inquiring organizations: toward a new decision-making paradigm for DSS. Decision Support Systems 31: 17-38. de Kok, J.-L., Titus, M. and Wind, H.G., 2000. Application of fuzzy sets and cognitive maps to incorporate social science scenarios in integrated assessment models. Integrated Assessment 1: 177-188. Druzdzel, M.J. and Henrion, M., 1993. Efficient reasoning in qualitative probabilistic networks. proceedings of the Eleventh National Conference on Artificial Intelligence, Menlo Park, California, USA. AAAI press. Eden, C. and Ackermann, F., 2004. Cognitive mapping expert views for policy analysis in the public sector. European Journal of Operational Research 152: 615-630. Khan, S. and Quaddus, M.A., 2004. Group Decision Support Using Fuzzy Cognitive Maps for Causal Reasoning. Group Decision and Negotiation 13: 463-480. Klosterman, R.E., 2005. An update on planning support systems (guest editorial). Environment and Planning B 32: 477-484. Kolkman, M.J., 2005. Controversies in water management - frames and mental models. PhD thesis, Universisy of Twente, Enschede, The Netherlands. Kolkman, M.J., Kok, M. and Van der Veen, A., 2005. Mental model mapping as a new tool to analyse the use of information in decision-making in integrated water management. Physics and Chemistry of the Earth 30: 317-332. Mingers, J. and Rosenhead, J., 2004. Problem structuring methods in action. European Journal of Operational Research 152: 530-554. Özesmi, U. and Özesmi, S.L., 2004. Ecological model based on people's knowledge: a multi-step fuzzy cognitive mapping approach. Ecological Modelling 176: 43-64. Robinson, J., 2003. Future subjunctive: backcasting as social learning. Futures 35(8): 839-856. Rosenhead, J. and Mingers, J. (Editors), 2001. Rational Analysis for a Problematic World Revisited Problem Structuring Methods for Complexity, Uncertainty and Conflict, second edition. John Wiley & sons, Chichester, England. Soini, K., 2001. Exploring human dimensions of multifunctional landscapes through mapping and
map-making. Landscape and Urban Planning 57: 225-239. van Kouwen, F.A., Dieperink, C., Schot, P.P. and Wassen, M.J., 2007a. Applicability of Decision Support Systems for Integrated Coastal Zone Management. Coastal Management [forthcoming]. van Kouwen, F.A., Dieperink, C., Schot, P.P. and Wassen, M.J., 2007b. Computer-supported Cognitive Mapping for Participatory Problem Structuring. Environment and Planning A [forthcoming]. van Kouwen, F.A., Renooij, S. and Schot, P.P., 2007c. Inference in Qualitative Probabilistic Networks revisited. International Journal of Approximate Reasoning [submitted]. van Kouwen, F.A., Schot, P.P. and Wassen, M.J., 2007d. A framework for linking advanced simulation models with interactive cognitive maps. Environmental Modelling & Software [submitted]. Vennix, J.A.M., 1990. Mental models and computer models - design and evaluation of a computerbased learning environment for policy-making. PhD thesis, University of Nijmegen, The Netherlands. Vennix, J.A.M., 1996. Group Model Building Facilitating Team Learning Using System Dynamics. John Wiley & sons, Chichester, UK. Wellman, M.P., 1990. Fundamental concepts of qualitative probabilistic networks. Artificial Intelligence 44: 257-303. Wellman, M.P., 1994. Inference in cognitive maps. Mathematics and Computers in Simulation 36: 137-148.