Improving the Accuracy of Diagnostics Provided by Fault Dictionaries John W. Sheppard ARINC 2551 Riva Road Annapolis, Maryland 21401
[email protected] Abstract Using nearest neighbor classification with fault dictionaries to resolve inexact signature matches in digital circuit diagnosis is inadequate. Nearest neighbor focuses on the possible diagnoses rather than on the tests. Our alternative—the information flow model—focuses on test information in the fault dictionary to provide more accurate diagnostics. Keywords: fault dictionary, diagnosis, nearest neighbor, information flow model, Dempster-Shafer 1 Introduction Of the considerable work performed in the area of fault diagnosis of electronic systems, diagnosis of complex digital circuits continues to be a difficult problem because of the large number of possible conditions under which a circuit can operate and fail. Problems arising from state dependence, timing and race conditions, circuit density, design errors, manufacturing flaws, field failures, and other sources result in the many failure modes that must be considered in testing a circuit. When fully automatic testing is required, test engineers rely on the fault dictionary to provide the diagnostics. Test engineering for digital electronics involves using digital simulation to determine input and output vectors that detect various faults within the circuit. Through a process of fault insertion and pattern generation, input vectors and faulty output vectors can be combined and associated with the inserted faults that cause the changes in output to occur. These vectors can be assembled into fault signatures that form fault dictionaries to use for circuit diagnosis. For example, a full adder is simulated with its constituent gates, and sample input vectors corresponding to integers to be summed are provided to the adder to determine functionality. Because of the complexity associated with building and running fault simulations, most digital simulations have been limited to the “single stuck-at” fault model. This assumes that most failures of a circuit can be detected (and
William R. Simpson Institute for Defense Analyses 1801 North Beauregard Street Alexandria, Virginia 22311
[email protected] isolated) using tests designed to look for single stuck-at faults. Under ideal circumstances, tests applied to digital systems result in fault signatures that exactly match signatures in the fault dictionary. These matches uniquely identify the faults in the system. However, under many conditions, errors may be introduced, resulting in no exact match being found in the fault dictionary. This mismatch may be due to errors in testing, noise present in the system, modeling errors, violation of the analysis assumptions, the presence of indeterminate states, and many other factors that are not addressed here. Further, the approach fails completely when faults that may be in the system are not included in the fault dictionary. Current techniques for resolving discrepancies between test results and fault signatures stored in the fault dictionary involve applying distance-based matching algorithms, such as nearest neighbor classification. We claim that these techniques are inappropriate because they assume that the classification space (i.e., the diagnoses) provides information about the actual diagnosis rather than the information present in the tests. Using the fault dictionary with distance-based matching algorithms can lead to improper identification of failures in a system and ineffective repair. 2 Diagnosis with Fault Dictionaries Fault dictionaries define a mapping from combinations of input vectors and output vectors to faults. Formally, this is represented as FD: I × O → F where FD is the fault dictionary, I is the space of input vectors, O is the space of output vectors, and F is the space of faults. At a more basic level, this can be represented as FD:{0,1}n × {0,1}m → F . This represents the fact that the vectors are binary. In the simplest case, diagnosis can be performed with a fault dictionary by finding a direct match between the input/output vectors and a fault signature in the dictionary. Indeed, with a proper model, high confidence tests, and a reasonable fault universe, many faults will be identified in this manner. For illustration purposes, we use a simple digital circuit (Abramovici, Breuer, and Friedman, 1990). This
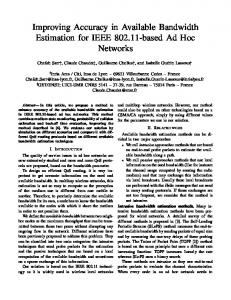
circuit is given in Figure 1. From this figure, and assuming a single stuck-at fault model, we can identify 26 possible stuck-at faults. Each stuck-at fault is denoted as xi where x is a letter matching the line where the fault occurs, and i is either 0 or 1 (denoting stuck-at-0 or stuck-at-1, respectively). We close the fault universe by defining a special “fault” in which no fault, nf, has been detected. The fault dictionary would then include the input vectors (i.e., the patterns applied to lines a, b, and c) and the expected response vector (in this case the value at m). Also associated with that entry would be the list of faults detected should the response be in error. We see in this circuit (Figure 1) only three input lines and, therefore, only eight possible input vectors (disregarding timing and faults other than stuck-ats). For our example, we can examine all eight input vectors; however in general, enumerating all possible vectors would be too costly. If the circuit were sequential, the three input lines might require several additional tests because of the sensitivity of the circuit to the previous state of the circuit. Several tools such as LASAR (Richman and Bowden, 1985; Grant, 1986) provide assistance to the modeler in developing input vectors and detecting stuck-ats and other faults at output vectors. Limiting ourselves to the combinational case (and the example in Figure 1), we begin constructing the fault dictionary by considering the possible input vectors. Each input vector can be regarded as a test. For example, one test might be the vector (0 1 1). Tracing through the circuit, we would expect the output of the circuit to be (0). If the value is (1), a fault must be present in the circuit. The question then becomes, what failure modes (i.e., stuckat faults) can cause the erroneous output? Examining the circuit identifies a1, b0, c0, d1, f0, i1, h0, k1, l1, or m1 as possible causes. By examining all eight input vectors, we find that several failure modes are “ambiguous,” meaning no test vectors can differentiate them. These ambiguity groups, which were taken from Abramovici et al. (1990) are listed in Table 1. The approach used for determining these ambiguous faults is called “fault collapsing” and consists of identifying lines in the circuit that will have identical values regardless of input or fault because of the logical nature of the gates in the circuit. For example, if we a
d
k
g b
f
m h
c
i l
e
j
Figure 1. Sample combinational circuit.
examine the initial AND gate with inputs b and c, we note b0, c0, and f0 are indistinguishable because either b0 or c0 (or both) will force f to have a value of zero, whether or not f is faulty. This approach to ambiguity analysis provides a first, but incomplete, analysis of ambiguity in the fault dictionary. An approach to representing the fault dictionary is to construct a table, such as Table 2, in which each test (i.e., input vector) corresponds to a row in the table. For the fault signatures in Table 2, the column headings correspond to the first member of each ambiguity group in the circuit. Each cell in the table contains the expected output from the circuit. This dictionary assumes eight tests as follows: t1 : 0 1 1 t5 : 0 0 1
t2 : 1 1 0 t6 : 0 0 0
t3 : 1 0 1 t7 : 0 1 0
t4 : 1 1 1 t8 : 1 0 0
Diagnosis matches the results of running the tests with the columns in the table. For example, suppose we run all eight tests and get (1 0 0 1 1 1 1 0) as the set of responses. This pattern would match both d1 and i1, indicating ambiguity between the two associated groups. It is significant that ambiguity is determined by the actual tests used to test the circuit, and selecting a subset of possible test vectors could result in different ambiguity groups. For example, if we evaluated only t1, t2, t3, and t4, we would find that a1 with d1 and i1 forms a new ambiguity group. 2.1 Diagnosis with Nearest Neighbor Classification Given the single stuck-at fault model, we assume that the circuit simulation accurately reflects the performance of the actual circuit. In other words, we assume that (1) the only faults of interest to us are stuck-at faults, (2) these faults are accurately represented in the circuit model, and (3) only one of these faults will be encountered at a time. Given these assumptions and the fact that digital circuit models are deterministic (i.e., the outputs are directly determined by the inputs and, in the case of sequential circuits, the internal state), whenever the fault signature Table 1. Ambiguity groups for sample circuit. Number 1 2 3 4 5 6 7
Ambiguity Group Number Ambiguity Group a0 8 g1 a1 9 i0, h1, l0, j0, e1 b1 10 i 1 , h0 c1 11 j1 , e0 d1 12 k0, d0, g0 f0, b0, c0 13 k1, l1, m1 f1 14 m0
Table 2. Fault dictionary for sample circuit. Test
Fault Signatures
nf a0 a1 b1 c1 d1 f0 f1 g1 i0 i1 j1 k0 k1 m0 0 1 0 0 1 1 0 0 0 1 0 0 1 0 0 t1 1 0 0 1 0 0 1 1 0 0 1 0 1 0 0 t2 1 0 1 0 0 0 1 1 0 0 1 0 1 0 0 t3 0 1 1 1 1 0 1 1 1 1 1 0 1 0 1 t4 1 0 0 1 1 1 0 1 0 1 1 1 1 0 1 t5 1 0 1 1 1 1 0 1 0 1 1 1 1 0 1 t6 1 0 1 0 1 1 0 1 0 1 1 1 1 0 1 t7 1 0 0 0 0 0 1 1 0 0 1 0 1 0 0 t8 Note: The signatures for d1 and i1 are identical, as are the signatures for g1 and j1. Thus, two ambiguities in addition to those listed in Table 2 exist in this circuit. fails to match any signatures in the fault dictionary, the circuit must be exhibiting behavior that was not represented in the model (i.e., the problem lies in the model, not the test results). Debaney and Unkle (1995) assert, “In practice, it is very seldom that an observed fault signature has an exact match in the fault dictionary.” This assertion points to the need for an “inexact” pattern matching algorithm when using a fault dictionary. Inexact matches, caused either by submitting noisy inputs to the circuit, introducing noise in the output, omitting an important signature from the dictionary, or having to deal with multiple faults or indeterminate states, invalidate the signatures. The current practice for processing inexact matches in fault dictionaries applies various distance measures to find the column in the dictionary that most closely matches the target vector. In the case where the single nearest vector is used to identify the fault, we refer to the matching process as single nearest neighbor classification (i.e., 1-NN). In the general case, nearest neighbor can be performed by retrieving the k nearest neighbors (i.e., k-NN) and voting for one of the recommended diagnoses. The winner is reported as the diagnosis. Assuming the data stored in the fault dictionary are ∗ correct, nearest neighbor classification is appropriate when the signatures in the dictionary are representative of the possible faults to be isolated, and the set of signatures must model the underlying distributions of the classification space. Cover and Hart (1967) assert, “If it is assumed that the classified samples (xi , θI) [fault signatures and associated fault] are independently identically distributed according to the distribution of (x, θ), certain heuristic arguments may be made about good decision procedures. For example, it is reasonable to ∗
We will not consider here the case where erroneous data may have been
introduced into the fault dictionary. Nevertheless, it should be clear that the ability to classify is limited by the quality of the fault signatures.
assume that observations that are close together (in some appropriate metric) will have the same classification, or at least will have almost the same posterior probability distributions on their respective classifications.” 2.2 Sources of Error Using Nearest Neighbor We claim that applying the nearest neighbor classification method to diagnosis of digital circuits with fault dictionaries leads to ineffective diagnostics and, thereby, ineffective repair. First, the computational requirements for computing fault dictionaries are quite high, making generating a dictionary for a large circuit with long test sequences expensive. Thus, dictionary compression is required. Second, fault dictionaries depend on a predefined “fault universe” and “test universe.” In other words, the fault dictionary will find only the faults specified in the dictionary, and those faults can be found only with the specified set of tests. The primary assumption here is that the fault is a member of the set of faults defined in the fault dictionary, and the output vector of tests is in error in one or more bits. Nearest neighbor would treat this like a noisy signal problem, finding the existing candidate with the closest match of attributes. Finally, Abramovici et al. (1990) note that the nearest neighbor approach to matching inexact patterns in the dictionary, while effective in many cases, “is not guaranteed to produce the correct diagnosis.” For the fault dictionary to be effective, it must be representative of the underlying probability distributions of the diagnoses. This assumes sufficient sample size for each of the classes (i.e., faults) in the fault dictionary. Many tools apply a “detect limit,” n, which results in signatures that correspond to some fault being discarded when other signatures detect that fault at least n times. This approach forces underrepresentation of the classification space by compressing the fault dictionary,
thus violating the assumption that the signatures represent the underlying distribution. In addition, the set of signatures defined by a fault dictionary are not independently identically distributed according to the distribution of possible points. This is because most fault dictionaries are constructed to maximize detection, and the concern is only to provide at least one input vector to detect each fault. Further, faults within the system affect more than one test indicating some form of dependence among the test outcomes. Additional research in using fault dictionaries for diagnosis has attempted to improve the performance of the matching algorithms. This research focuses on issues such as fault dictionary compression (Ryan, 1994), probabilistic matching (Denœux, 1995), and error bounding (Kliger et al., 1995). Unfortunately, none of these approaches satisfy the requirements of Cover and Hart (1967). Additional details on nearest neighbor error sources and the problems with the approaches described can be found in Sheppard and Simpson (1996) 3 Diagnosis with Information Flow Models Caution is required when diagnosing digital electronic faults with a fault dictionary. Because of the inherent difficulties in processing erroneous test data in fault dictionaries, we present an alternative approach—the information flow model—for processing these data (Sheppard and Simpson, 1991). This alternative considers test results as evidence for or against the presence of a fault in the system. Test results are processed sequentially, and the evidence supporting or denying the presence of a failure mode is attributed to the set of failure modes in the system. This model-based approach incorporates techniques from information fusion and propositional logic to guide analysis. The model represents the problem to be solved as information flow. Tests provide information, and diagnostic inference combines information from multiple tests using logical inference and statistical inference. The structure of the information flow model facilitates our ability to derive diagnostic strategies. An information flow model has two primitive elements: tests and fault-isolation conclusions. Tests include any source of information that can be used to determine the health state of a system. Faultisolation conclusions include failures of functionality, specific nonhardware failures (such as bus timing), specific multiple failures, and the absence of a failure indication. The information obtained for diagnosis may be a consequence of the system operation or a response to a test stimulus. We include observable symptoms of faults in the information flow model as tests, thus allowing analyses that involve information sources other than formally defined tests. The purpose of the
model is to combine these information sources (tests) to derive conclusions about the system being diagnosed. After specifying the primitive elements of the model, we determine the logical relationships among the tests and between the tests and the conclusions. The basic representation of the information flow model is a logical representation of the system being analyzed. In this representation, we define logical values for tests and fault-isolation conclusions. Specifically, if a test fails, it has a logic value of true; if a test passes, it is false. An asserted conclusion is true; a conclusion eliminated from consideration is false. To determine the logical relationships, an analyst will consider the following for each test: • •
What can be inferred from observing a test failing? What can be inferred from observing a test passing?
In the initial stages of modeling, the first issue is more important. The modeler is interested in listing conclusions that, corresponding to a failure, would explain the test failure. The second question is important in determining the type of test. It also points out the dependence relations in the test system, so that independence is not a necessary assumption. The assumption that test quality is the same for all tests in the system is restrictive and sometimes limits our ability to deal with real test situations. Therefore, in addition to the inference process described above (i.e., the set partitioning process), we use a modification of Dempster-Shafer statistical inference which has its root in Bayesian inference (Simpson and Sheppard, 1994). Shafer (1976) added the concept of uncertainty to the Bayesian approach (of applying Baye’s rule) which resulted in two measures being applied to a conclusion. Using this approach, we compute values for two extremes of a credibility interval for every conclusion in the model. These extremes are called support, s(ci), and plausibility, p(ci), and for a given conclusion, ci, s(ci) ≤ Pr(ci) ≤ p(ci). An intermediate measure called denial, d(ci), is computed as the complement of plausibility. Dempster-Shafer theory then combines information from multiple tests using Dempster’s rule of combinations (Dempster, 1968). As tests are performed, Dempster’s rule is applied iteratively to allow test information to be accumulated and the diagnostic process to be optimized. 4 Converting the Fault Dictionary The information flow model specifies the inferences that can be drawn given each test outcome. The fault dictionary maps directly into the information flow model. Using the information in Table 2, we convert the fault dictionary into an information flow model by comparing test results in the presence of a fault to expected test results when the circuit is not faulty. We place a 1 in the
corresponding cell of the matrix if these values are different and a 0 in the cell if they are the same. If the value in the cell is 1, we claim the associated failure mode “causes” the given test to fail. If the value is 0, the presence of the associated failure mode will not be detected by the given test. Given a complete row in the matrix, we say that if the associated failure mode is present, then all of the tests associated with the failure mode (i.e., whose cells have a value of one) must fail. Conversely, if any of those tests pass, then the failure mode must not be present. Converting fault dictionaries to information flow models is easily achieved by interpreting these representations as “attribute maps” which have been discussed at length (Simpson and Sheppard, 1994). As with the fault dictionary, the information flow model closes the fault universe by defining the special conclusion no fault. The no fault conclusion has no specified inference relationships with any tests because a failed no fault cannot imply the failure of any test. To do so would be a contradiction in terms. 5 Diagnosing a Sample Circuit 5.1 Accuracy Using Nearest Neighbor To assess ability of nearest neighbor to process erroneous fault signatures in a fault dictionary, we considered only the sample circuit and used both Hamming distance ( δ ( si , s j ) = ∑ b | sib − s bj | ) and the overlap metric
( δ ( si , s j ) = | si ∩ s j | | si ∪ s j | )
as
distance
measures
(Debaney and Unkle, 1995). The matching procedure was limited to 1-NN; we would expect worse results for k-NN with k > 1 because faults are only represented by a small number (e.g., one) of signatures. For each fault, we considered all possible fault signatures that can be generated with one through eight bits in error. We then compared the results of using 1-NN with the expected fault and recorded the number of correct diagnoses. Because we limited the number of neighbors to one, if a tie occurred, we picked one of the neighbors at random. The results of these experiments are given in Table 3. In the top part of Table 3, we see some characteristics of introducing error into the fault signature to be matched. First, we see that the higher the number of bits in error, the lower the accuracy in matching, down to a limit of 0% accuracy. Second, the performance of Hamming distance compared with the overlap metric is very close. In fact, we conjecture that the differences would not be statistically significant; however, we do not have sufficient data to perform a significance test. Third, the lowest error rate (i.e., 1 bit error) yielded very poor performance on this circuit (between 21% and 27% error). This follows the conclusion of the previous discussion on the appropriateness of nearest neighbor. 5.2 Accuracy of Dempster-Shafer Compared with Nearest Neighbor To compare the differences between the DempsterShafer approach and nearest neighbor classification, we
Table 3. Accuracies of nearest neighbor and Dempster-Shafer. Number of Bits in Error 1 2 3 4 5 6 Accuracy Using Nearest Neighbor on a Fault Dictionary Hamming Distance 82 110 42 9 0 0 Correct Diagnosis 79% 30% 6% 1% 0% 0% Incorrect Diagnosis 21% 70% 94% 99% 100% 100% Overlap Metric 76 91 57 19 0 0 Correct Diagnosis 73% 25% 8% 2% 0% 0% Incorrect Diagnosis 27% 75% 92% 98% 100% 100% Total Cases Examined 104 364 728 910 728 364 Accuracy Using Dempster-Shafer on a Fault Dictionary Correct = 1st 89 174 150 62 0 0 Correct Diagnosis 86% 48% 21% 7% 0% 0% Incorrect Diagnosis 14% 52% 79% 93% 100% 100% st nd Correct = 1 or 2 104 331 336 66 0 0 Correct Diagnosis 100% 91% 46% 7% 0% 0% Incorrect Diagnosis 0% 9% 54% 93% 100% 100% Total Cases Examined 104 364 728 910 728 364
7
8
0 0% 100% 0 0% 100% 104
0 0% 100% 0 0% 100% 13
0 0% 100% 0 0% 100% 104
0 0% 100% 0 0% 100% 13
computed the accuracy for all bit-error combinations using Dempster-Shafer as we did for nearest neighbor. The diagnosis returned corresponded to the failure mode with the highest evidential probability. Ties were broken at random. These results are shown in the bottom part of Table 3. In interpreting this table, we can consider the bit errors as corresponding to some amount of lost information. For example, in the two-bit error case, we assume 25% information loss. From this we can see that even one bit in error is significant in that it corresponds to 12.5% information loss. Consider the rows associated with Correct = 1st. These rows correspond to the analysis when we consider the conclusion assigned the highest probability of being correct. This is analogous to the nearest neighbor case in which we select the fault whose signature is closest to the test signature as the most likely diagnosis (rows Hamming Distance and Overlap Metric). Comparing these rows with the Correct = 1st rows, note that Dempster-Shafer outperforms both Hamming distance-based and Overlap metricbased nearest neighbor. In fact, we see that with 37.5% information loss, nearest neighbor performs randomly (i.e., if we randomly select from the 13 possible failure modes, meaning any failure mode might be selected with probability 7.7%, we will be correct approximately the same number of times as when applying nearest neighbor with three bits in error). On the other hand, Dempster-Shafer does not reduce to “random” performance until we have 50% information loss. When this loss exceeds 50%, both techniques fail to find the correct diagnosis, as expected. An interesting result with Dempster-Shafer involves examining the number of times the correct answer is either the first or second most likely conclusion identified (shown Table 3b in the rows associated with “Correct = 1st or 2nd”). Here we find the correct fault a very high percentage of the time, indicating that an alternative answer in the event repair based on the first choice is ineffective. In fact, in all cases where the answer was ranked either first or second, Dempster-Shafer still considered it to be a member of the hypothesis set. 6 Conclusion With the current practice of using fault dictionaries to diagnose digital circuits, test outcomes can fail to match entries in the fault dictionary, resulting in improper fault identification and ineffective system repair. In addition to assuming erroneous test outcomes, a number of possibilities exist, including modeling error, incomplete fault universes, and improper test development. Current diagnostic practice assumes that the fault dictionary provides adequate representation of the diagnosis space, permitting applying nearest neighbor classification for matching fault signatures. This does not adequately
address the problem of inexact matching in fault dictionaries because current practices for generating fault dictionaries force under-representation of the diagnosis space. After quantifying the difficulty nearest neighbor has with fault dictionaries to diagnose faults in our test circuit, we demonstrated that an alternative approach to diagnosis—using Dempster-Shafer statistical inference and logic modeling—provides more accurate diagnostics with fault dictionary data when dealing with uncertain test outcomes. This approach focuses on analyzing test information rather than examining alternative diagnoses to resolve uncertainty. References Abramovici, M., M. A. Breuer, and A. D. Friedman. 1990. Digital Systems Testing and Testable Design, New York: Computer Science Press. Cover, T. M., and P. E. Hart. 1967. “Nearest Neighbor Classification,” IEEE Trans. on Information Theory, Vol. IT-13, pp. 21–27. Debaney, W. H., and C. R. Unkle. 1995. “Using Dependency Analysis to Predict Fault Dictionary Effectiveness,” Autotestcon ‘95 Conference Record, New York: IEEE Press. Dempster, A. P. 1968. “A Generalization of Bayesian Inference,” Journal of the Royal Statistical Society, Series B, pp. 205–247. Denœux, T. 1995. “A k-Nearest Neighbor Classification Rule Based on Dempster-Shafer Theory,” IEEE Trans. on Systems, Man, and Cybernetics, Vol. SMC-25, No. 5, pp. 804–813. Grant, F. 1986. “Noninvasive Diagnostic Technique Attacks MIL-SPEC Problems,” Electronics Test, Miller-Freeman Publications. Kliger, S., S. Yemini, Y. Yemini, D. Ohsie, and S. Stolfo. 1995. “A Coding Approach to Event Correlation,” Proc. 4th International Symposium on Integrated Network Management, Santa Barbara, California. Richman, J., and K. R. Bowden. 1985. “The Modern Fault Dictionary,” Proc. International Test Conference, Los Alamitos, California: IEEE Computer Society Press. Ryan, P. 1994. Compressed and Dynamic Fault Dictionaries for Fault Isolation, Ph.D. Thesis, University of Illinois at Urbana-Champaign. Shafer, G. 1976. A Mathematical Theory of Evidence, Princeton, New Jersey: Princeton University Press. Sheppard, J. W., and W. R. Simpson. 1991. “A Mathematical Model for Integrated Diagnostics,” IEEE Design & Test of Computers, Vol. 8, No. 4, pp. 25–38. Sheppard, J. W., and W. R. Simpson. 1996. “Inexact Signature Matching in Fault Dictionaries,” submitted to Journal of Electronic Testing: Theory and Application.
Simpson, W. R., and J. W. Sheppard. 1994. System Test and Diagnosis, Norwell, Massachusetts: Kluwer Academic Publishers.