Carex pilulifera; Corn san, Comus sanguinea; Cory cav, Cory- dalis cava; Croc nud, Crocus nudiflorus; Desc fle, Deschampsia flexuosa; Gali apa, Galium ...
113
Plant Ecology 134: 113–118, 1998. c 1998 Kluwer Academic Publishers. Printed in Belgium.
Improving the interpretation of fuzzy partitions in vegetation science with constrained ordinations Jos´e Miguel Olano1 , Javier J. Loidi1, Ander Gonz´alez1 & Adri´an Escudero2 1 2
Dept. Biolog´ıa Vegetal y Ecolog´ıa, Universidad del Pa´ıs Vasco, Leioa, Apdo. 644, Bilbao, E-48080, Spain; Dept. Biolog´ıa Vegal, Universidad Polit´ecnica de Madrid, E.U.I.T. Agr´ıcola, Madrid, E-28040, Spain
Received 29 April 1996; accepted in revised form 14 January 1997
Key words: Basque country, Beech forests, Constrained ordinations, Fuzzy partitions, Fuzzy set theory
Abstract Classification and ordination techniques based in fuzzy set theory are now being commonly used in vegetation studies. However, several problems have been detected in spite of the significant theoretical advantages of the theory. In this paper we have improved the interpretability of fuzzy partitions by combining fuzzy partitions with correspondence analysis (CA) and detrended canonical correspondence analysis (DCCA) in an analysis of the beech forests of Basque Country, northern Spain. Our results seem to overcome difficulties in the interpretation of multi-group partitions. Abbreviations: CA – correspondence analysis; DCCA – detrended canonical correspondence analysis; FSO – fuzzy set ordinations; FST – fuzzy set theory. Nomenclature: Tutin et al. (1964). Introduction The use of multivariate techniques in vegetation research has been maturing since more than twentyfive years (see Mucina & van der Maarel 1989). Kent & Ballard (1988) pointed out the existence of an evidence replacement process, where techniques used by researchers has been continuously and constantly changing through time and research activity (Orl´oci 1978; Gauch 1982; ter Braak & Prentice 1988; Feoli & Orl o´ ci 1991). Recently, the introduction of Fuzzy Set Theory (see Zadeh et al. 1975; Zimmermann 1984; Negotia 1985) in the vegetation context (Roberts 1986; Feoli & Zuccarello 1986, 1988) gives us the theoretical basis to solve several of the most remarkable problems in vegetation studies (Robert 1989; Moraczewski 1993a, b). As a classification technique, a fuzzy approach provides a unifying basis for the main strategies for classification (Marsili-Libelli 1989; Podani 1990) and, due to fuzziness concept, allows a more realistic floristical
and ecological interpretation with respect to the community/continuum controversy (Minchin 1987; Austin & Smith 1989; Barkman 1990; Kent & Coker 1992). An ordination technique based on FST was initially developed and subsequently improved (Roberts 1986; Banyikwa et al. 1990; Zhang & Oxley 1994). However, the complete possibilities of FSO in vegetation studies are yet to be definitively achieved, as the paper of Zhang (1994) clearly points out. Woldu et al. (1989) were the first to propose the use of fuzzy sets in traditional ordinations in order to summarize their information. We have attempted to improve this approach in this paper. Interpretation of membership weight matrices obtained after fuzzy partitions has been carried out by dimensional reduction by means of direct comparison of membership vectors (Feoli & Zuccarello 1986). However interpretation becomes quite cumbersome as the number of groups increases. In this paper a procedure is proposed in order to analyze the results of multi-groups fuzzy set partitions in vegetation studies,
114 following a two-step approach based on ordinations (according to Whittaker 1967). By this approach we attempt to interpret this matrix in two ways: (1) By submitting the relev´es/membership degree matrix to ordination to evaluate relation among fuzzy groups. (2) By submitting the relev´es/species matrix to a constrained ordination with the relev´es/membership degree matrix as the constraining one (ter Braak & Prentice 1988). This step allows the interpretation of species occurring at each group and the efficiency of the partition (Lavorel et al. 1991). Zhang (1994) has recently modified FSO through an inverse procedure, firstly running a DCA on an environmental matrix and later a FSO, using the first DCA axis as one of the FSO axis. This approach overcomes the limitations of FSO interpretation in ecological terms for using only a few number of environmental variables. To test our protocol we have developed an application studying the beech forests of the Basque Country (northern Spain).
Methods
1995 for details on the sampling process and ecological interpretation). Numerical analyses 1. Fuzzy partition Level of fuzziness was 1.1, following Podani (1990) and Escudero & Pajar´on (1994). A high number of groups (10) was evaluated in order to obtain a multigroup membership matrix for further analyses. Logically an optimal number of clusters could have been obtained using Normalized Partition Entropy (MarsiliLibelli 1989) as in other non-hierarchical cluster strategies. Our main focus is to interpret multi-group fuzzy partition, both when rarely the number of optimal clusters is high or when searching for low level ecological information. Euclidean distance was used after normalizing relev´es to unit vector to be congruent wiht the fuzzy partition procedure included in SYNTAX 5.0 (see Podani 1993). Each relev´e has been adscribed to the fuzzy group with maximal membership degree – the number of relev´es was 29 for the group 1; 10 for the 2; 21 for the 3; 7 for the 4; 20 for the 5; 19 for the 6; 25 for the 7; 14 for the 8; 17 for the 9 and 6 for the 10.
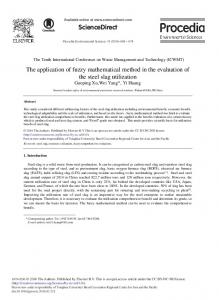
Study area The research was conducted on beech forests of the Eastern Cantabrian fringe of the Iberian Peninsula (Figure 1), located between 600–1500 m a.s.l., and covering an average rainfall regime between 1000–1500 mm. The sampling sites were located in the Cantabro-Euskaldun sector, in the montane belt (biogeographical terms following Rivas-Mart´ınez 1987). The number of sample plots was 168, covering every geomorphogological and lithological situation: sandstone, limestone and marl. Cover of tree layer was always around 100%. The localities had not recently been disturbed, to avoid successional interferences, and were separated for a minimum of 1000 m or a variation in altitude of more than 100 m. The shape of the sample plots was a circle of 11.5 m of radius (more or less 400 m2 ). Percentage canopy cover of every plant was estimated during May and July (1990 and 1991). Environmental variables were annotated or calculated in all sampling sites, including altitude, aspect, slope and some edaphic parameters. Environmental data were not included directly in these analyses being used only to control group properties (see Olano
2. Relev´es/fuzzy membership ordination (CA) The relev´es/membership degree matrix was analyzed through CA in order to study the relation among clusters. Membership degree was coded as a gradient from 1 (total membership) to 0 (no membership). For this and subsequent analyses CANOCO 3.1 (ter Braak 1988, 1990) was employed. The Monte Carlo test was significative at p < 0:01 for the first two axes. 3. Relev´es/species constrained by relev´es/membership degree ordination (DCCA) An ordination constrained by relev´es/membership degree was imposed on relev´es/species matrix, in order to detect the species characterizing the different groups. Constraining data were clearly monotonic, but constrained techniques related to CA work efficiently using monothonic variables as membership degrees are, or even with ‘dummy’ variables (ter Braak 1987). Detrending by fourth-order polynomial was employed as detrending method. The Monte Carlo test was significative at p < 0:01 for the first two axes.
115
Figure 1. Location map of the study area. The continuous line indicate the border between the Eurosiberian region–northern part of the Iberian peninsul and the Mediterranean region.
Results CA ordination Two first axes of ordination summarize around 30% of the global information. Two main trends of variation can be found (Figure 2) when examining the fuzzy groups position in ordination space. The first trend is related to group 10, an outlier located in the positive edge of the first axis. Another trend can be outlined at positive edge of second axis, this comprising groups 6, 4 and 8. Relev´es included in these groups show a more continuous relation with groups constrained near the origin (1, 2, 3, 5, 7, 9). Relev´es belonging to these last groups may show a strong floristical variability, but this is subordinated to the major changes of the outlier group, due to CA sensibility to outliers
(Jongman et al. 1987). Anyway, subsequent analyses of this origo subset must be hierarchized in relation to the previous commented trends. Furthermore, the use of constrained techniques have been recommended to avoid problems associated to outlier effects, because these relev´es are generally centered for the variables used to build the constraining matrices (Oksanen & Huttunen 1989). After relating these three CA groups to environmental data (Olano 1995), it can be concluded that group 10 appears clearly linked to forest growing on limestone screes, and logically under very hard edaphic conditions: stony and mobile soils and water stress. The second trend can be related to low pH values, average below 5 for groups 4 and 6, and only slightly higher (5.45) for group 8. The rest of the groups present an average above 6.
116
Figure 2. CA scatterplot (plane I/II) of the 10 fuzzy group in relev´e space.
DCCA ordination The DCCA on the floristical data set, with the membership degree matrix as constraining one was planned in order to identify the more relevant species. IrmDCCA =IDCA was equal to 0.22 which indicates high congruence between both matrices (Lavorel et al. 1991). When examining the scattergram, species are congruent with the previously defined CA trends (Figure 3). Thus, on the positive edge of second axis, close to the vector of the fuzzy group 10, several taxa with a recognized preference for stone fields biotopes, including scree communities stand out. Some of them are Silene vulgaris, Vincetoxicum hirundinaria, Phyteuma spicata. On the other hand, the centroids of fuzzy groups 4, 6 and 8, located on the positive half of the first axis, are surrounded by typical plants of acid soils, such as Deschampsia flexuosa, Anemone nemorosa, Carex pilulifera and Luzula multiflora (see Aseginolaza et al. 1988; Grime et al. 1988; Rameau et al. 1989, for an autecological characterization of these plants). The constrained approach leads us to interpret those groups restricted to the origo area in the CA. Thus axis 2 separated lowland forests over marl (groups 2 and 3) from upland forests over limestone (groups 1, 5, 7, and 9) as species indicate (see Aseginolaza et al. 1988).
Figure 3. DCCA scatterplot (Plane I/II) including the ten fuzzy group vectors and the species. Species names: Anem nem, Anemone nemorosa; Arab alp, Arabis alpina; Aspl tri, Asplenium trichomanes; Arum mac, Arum maculatum; Blec spi, Blechnum spicant; Care pil, Carex pilulifera; Corn san, Comus sanguinea; Cory cav, Corydalis cava; Croc nud, Crocus nudiflorus; Desc fle, Deschampsia flexuosa; Gali apa, Galium aparine; Hede hel, Hedera helix; Hell occ, Helloborus viridis; Iris gra, Iris graminea; Isop tha, Isopyrum thalictroides; Luzu mul, Luzula multiflora; Meli mel, Melittis melisophyllum; Merc per, Mercurialis perennis; Myce mur, Mycelis muralis; Phyt spic, Phyteuma spicata; Poa nem, Poa nemoralis; Quer pub, Quercus pubescens; Rubi per, Rubia peregrina; Sile vul, Silene vulgaris; Vinc hiru, Vincetoxicum hirundinaria.
Discussion On ecological findings This analysis has succeeded in finding the main structure in beech forest as mentioned in the bibliography (Rivas-Mart´ınez et al. 1991). It seems evident that the higher syntaxonomical ranges in Basque Country beech forests Ilici-Fagenion sylvaticae and Epipactido helleborine-Fagenion) can be related to a pH gradient as the main factor controlling floristic composition, as the exploratory relation with environmental data have shown. The second trend, beech forests on screes (fuzzy group No. 10) are not so well-known, although some relev´es in the bibliography (Rivas-Mart´ınez 1962) can be attributed to this geomorphological and floristical location. Scarce interest has been focused in this type of beech forests, in spite of the relevant floristical composition standing out (see Olano 1995 for detailed
117 ecological and floristical study of this type of forests). The omission of this forests in other previous studies must be related to their natural scarcity and fragility. The patent floristical originality of these two main trends obscures the global interpretation of those relev´es located in the origo area. Central clump includes eutrophic beech forests, which floristical variability has been outlined by fuzzy partition and DCCA analysis. They could be studied following a nested process through an iterative ordination in the way to zoom the origo area. Logically, the subsequent floristical interpretation, and even syntaxonomical, is hierarchized in relation to the main groups. Thus, the first approach or also the first syntaxonomical level separated three groups: beech forets on acidic soils, on screes and on eutrophic soils. The rest of community comments must be arranged in a lower step: beech forest on marl, on limestone... As commented by Dale (1988) and Feoli & Zuccarello (1989) Fuzzy Sets concepts are highly valuable in Phytosociology because they enable to overcome most of the conceptual difficulties of the Phytosociological Theory: contacts between vegetation entities, faithful species at different syntaxonomical level... On the techniques Fuzzy partition in combination with ordination techniques seems to be an efficient strategy to interpret any fuzzy multi-cluster membership matrix (Zhang 1994). The graphical interpretation must be easy because those clusters more closely related tend to appear concentrated in the ordination map. As discontinuities among groups are related to discontinuities in the floristic space, and thus lack transitional sample plots, relation among fuzzy groups is easier to understand than just by plotting group axis by pairs. Interpretability could be highly benefitted by the interpretative techniques developed for ordinations (Wildi 1979; ter Braak & Prentice 1988; Feoli & Lagonegro 1991). The use of relev´es/membership degree matrices in constrained ordinations allows a clear interpretation of all floristical elements in relation to the partition previously generated, in a similar sense than a discriminant analysis. Furthermore, the floristical and ecological information can be managed in several ways using partial constrained ordinations or other related procedures (ter Braak 1990; Borcard et al. 1992; Palmer 1993; Økland & Eilertsen 1994), and even an evaluation of efficiency of partition (Lavorel et al. 1991).
Acknowledgements J. M. Olano was granted by the Ministerio de Educaci´on y Ciencia. Funding from the project GV 118.310-0124/94 of Basque Country University and Basque Country Government has collaborated to finance this work.
References Aseginolaza, C., Gomez, D., Lizaur, X., Montserrat, G., Salaverr´ıa, M., Uribe-Etxebarria, P. & Alejandre, J. 1985. Cat´alogo flor´ıstico de Alava, Vizcaya y Guip´uzoa. Publicaciones del Gobierno Vasco. Austin, M. P. & Smith, T. M. 1989. A new model for the continuum concept. Vegetatio 83: 35–47. Banyikwa, F. F., Feoli, E. & Zuccarello, V. 1990. Fuzzy set ordination and classification of Serengeti short grasslands, Tanzania. J. Veg. Sci. 1: 97–104. Barkman, J. J. 1990. Controversies and perspectives in plant ecology and vegetation science. Phytocoenologia 18: 565–589. Borcard, D., Legendre, P. & Drapeau, P. 1992. Partialling out the spatial component of ecological variation. Ecology 73: 1045– 1055. Dale M. B. 1988. Some fuzzy approaches to phytosociology. Folia Geobot. Phytotax. 23: 239–274. Escudero, A. & Pajar´on, S. 1994. Numerical syntaxonomy of the Asplenietalia petrarchae in the Iberian Peninsula. J. Veg. Sci. 5: 205–214. Feoli, M. & Lagonegro, M. 1991. Testing for elliptical cluster in ecological multidimensional space. Pp. 291–297. In: Feoli, E. & Orl´oci, L. (eds), Computer assisted vegetation analysis. Kluwer Academic Publishers, Dordrecht. Feoli, E. & Orl´oci, L. 1979. Analysis of concentration and detectation of underlying factors in structured tables. Vegetatio 40: 49–54. Feoli, E. & Orl´oci, L. 1991. The properties and interpretation of observations in vegetation study. Pp. 3–13. In: Feoli, E. & Orl´oci, L. (eds), Computer assisted vegetation analysis. Kluwer Academic Publishers, Dordrecht, the Netherlands. Feoli, E. & Zuccarello, V., 1986. Ordination based on classification: yet another solution? Abstracta Botanica 10: 203–219. Feoli, E. & Zuccarello, V. 1988. Syntaxonomy: a source of useful fuzzy sets for environmental analysis. Coenoses 3: 141–147. Gauch, H. G. 1982. Multivariate Analysis in community ecology. Cambridge University Press, Cambridge. Grime, J. P., Hodgson, J. G. & Hunt, R. 1988. Comparative plant ecology. Unwin Hyman Ltd., London. Jongman, R. H. G., ter Braak, C. J. F. & van Tongeren, O. F. R. 1987. Data analysis in community and landscape ecology. Pudoc, Wageningen. Kent, M. & Ballard, J. 1988. Trends and problems in the application of classification and ordination methods in plant ecology. Vegetatio 78: 109–124. Kent, M. & Coker, P. 1992. Vegetation description and analysis. A practical approach. CRC Press. Boca Rat´on. Lavorel, S., Lebreton, J., Debussche, M. & Lepart, J. 1991. Nested spatial patterns in seed bank and vegetation of Mediterranean old fields. J. Veg. Sci. 2: 367–376.
118 Marsili-Libelli, S. 1989. Fuzzy clustering of ecological data. Coenoses 2: 95–106. Moraczewski, I. R. 1993a. Fuzzy logic for phytosociology I. Syntaxa as vague concepts. Vegetatio 106: 1–11. Moraczewski, I. R. 1993b. Fuzzy logic for phytosociology II. Generalizations and predictions. Vegetatio 106: 13–20. Minchin, R. 1987. Simulation of multidimensional community patterns: towards a comprehensive model. Vegetatio 83: 97–110. Mucina, L. & van der Maarel, E. 1989. Twenty years of numerical syntaxonomy. Vegetatio 12: 116. Negoita, C. V. 1985. Expert systems and fuzzy systems. The Benjamin/Cummings publishing Company. Menlo Park, California. Økland, R. H. & Eilertsen, O. 1994. Canonical Correspondence Analysis with variation partitioning: some comments and an application. J. Veg. Sci. 5(1): 117–126. Oksanen, J. & Huttunen, P. 1989. Finding a common ordination for several data sets by individual differences scaling. Vegetatio 83: 815–824. Olano, J. M. 1995. Estudio fitoecol´ogico de los bosques de las sierras de Urbasa, Andia y Enzia (Alava y Navarra): Una aproximaci´on num´erica. Ph.D. Thesis. Universidad del Pais Vasco. Leioa. Orl´oci, L. 1978. Multivariate analysis in vegetation research, 2nd ed. Junk, The Hague. Palmer, M. W. 1993. Putting things in even better order: the advantages of canonical correspondence analysis. Ecology 74: 2215– 2230. Podani, J. 1990. Comparation of fuzzy classifications. Coenoses 5: 17–21. Podani, J. 1993. SYN-TAX ver. 5.0: user’s guide. Scientia publishing. Budapest. Rameau, J. C., Mansion, D. & Dum´e, G. 1989. Flore Foresti`ere Francaise. 1 Plaines et collines. Minist`ere de l’Agriculture et de la Forˆet, Paris. Rivas-Mart´ınez, S. 1962. Contribuci´on al estudio fitosociol´ogico de los hayedos espa˜noles. Anales del Instituto Bot´anico Cavanilles 22: 343–465. Rivas-Mart´ınez, S. 1987. Mapa de las series de vegetaci´on de Espa˜na (escala 1:400 000). Publicaciones del ICONA, Madrid. Rivas-Mart´ınez, S., Bascones, J. C., D´ıaz Gonz´alez, T. E., Fern´andez Gonz´alez, F. & Loidi, J. 1991. Vegetaci´on del Pirineo occidental y Navarra. Itinera Geobotanica 5: 5–456.
Roberts, D. W. 1986. Ordinations on the basis of fuzzy set theory. Vegetatio 66: 123–131. Roberts, D. W. 1989. Fuzzy systems vegetation theory. Vegetatio 83: 71–80. ter Braak, C. J. F. 1987. The analysis of vegetation-environment relationships by canonical correspondence analysis. Vegetatio 69: 69–77. ter Braak, C. J. F. 1988. CANOCO – a Fortran program for canonical community ordination by (partial) (detrended) (canonical) correspondence analysis, principal component analysis and redundance analysis (version 2.19). Groep Landbouwwiskunde, Wageningen. ter Braak, C. J. F. 1990. Update notes: CANOCO ver. 3.1, Wageningen. ter Braak, C. & Prentice, I. 1988. A theory of gradient analysis. Adv. Ecol. Res. 18: 271–317. Tutin, T. G. et al. 1964. Flora Europaea. Vol 1–5. Cambridge University Press, Cambridge. Wildi, O. 1979. GRID, A space density analysis for recognition of noda in vegetation samples. Vegetatio 81: 95–106. Whittaker, R. H. 1967. Gradient analysis of vegetation. Biol. Rev. 49: 207–264. Woldu, Z, Feoli, E. & Nigatu, L. 1989, Partitioning an elevational gradient of vegetation from southeastern Ethiopia by probabilistic methods. Vegetatio 81: 189–198. Zadeh, L. A., 1965. Fuzzy sets. Information Control 8: 338–353. Zadeh, L. A., Fu, K. S., Tanaka, K. & Shimura, M. (eds) 1975. Fuzzy sets and their application to cognitive and decission processes. Academic Press, New York. Zhang, J. T. 1994. A combination of Fuzzy set ordination with detrended correspondence analysis: One way to combine multienvironmental variables with vegetation data. Vegetatio 115: 115–121. Zhang, J. T. & Oxley, E. R. B. 1994. A comparison of the three methods of multivariate analysis of upland grasslands in North Wales. J. Veg. Sci. 5: 71–76. Zimmerman, H. J. 1984. Fuzzy set theory and its applications. Kluwer-Nijhoff Publishing, Dordrecht.