nanomaterials Article
Influence of Solution Properties and Process Parameters on the Formation and Morphology of YSZ and NiO Ceramic Nanofibers by Electrospinning Gerard Cadafalch Gazquez 1 , Vera Smulders 1 , Sjoerd A. Veldhuis 1 , Paul Wieringa 2 , Lorenzo Moroni 2 , Bernard A. Boukamp 1 and Johan E. ten Elshof 1, * 1
2
*
MESA+ Institute for Nanotechnology, University of Twente, P.O. Box 217, 7500 AE Enschede, The Netherlands;
[email protected] (G.C.G.);
[email protected] (V.S.);
[email protected] (S.A.V.);
[email protected] (B.A.B.) Department of Complex Tissue Regeneration, MERLN Institute for Technology Inspired Regenerative Medicine, University of Maastricht, 6200 MD, Maastricht, The Netherlands;
[email protected] (P.W.);
[email protected] (L.M.) Correspondence:
[email protected]; Tel.: +31-53-489-2695
Academic Editor: Thomas Nann Received: 30 November 2016; Accepted: 4 January 2017; Published: 13 January 2017
Abstract: The fabrication process of ceramic yttria-stabilized zirconia (YSZ) and nickel oxide nanofibers by electrospinning is reported. The preparation of hollow YSZ nanofibers and aligned nanofiber arrays is also demonstrated. The influence of the process parameters of the electrospinning process, the physicochemical properties of the spinning solutions, and the thermal treatment procedure on spinnability and final microstructure of the ceramic fibers was determined. The fiber diameter can be varied from hundreds of nanometers to more than a micrometer by controlling the solution properties of the electrospinning process, while the grain size and surface roughness of the resulting fibers are mainly controlled via the final thermal annealing process. Although most observed phenomena are in qualitative agreement with previous studies on the electrospinning of polymeric nanofibers, one of the main differences is the high ionic strength of ceramic precursor solutions, which may hamper the spinnability. A strategy to control the effective ionic strength of precursor solutions is also presented. Keywords: yttria-stabilized zirconia; YSZ; nickel oxide; NiO; nanofiber; electrospinning; microstructure; spinning process; alignment
1. Introduction Ceramic nanofibers have gained considerable interest during the last decade. Their large surface area and aspect ratio provide superior properties for a wide range of applications, such as catalysis, energy, biomedicine, sensing, or electronics [1–3]. Among the different nanofiber preparation methods, electrospinning appears to be the most feasible one due to the relatively uncomplicated equipment, flexibility in composition, control over fiber characteristics, and higher production rates than are possible with other methods [1,2,4–6]. A typical electrospinning setup essentially consists of a spinneret connected to a counter electrode collector via a high voltage supply (Figure 1) [7,8]. A viscous material solution is pumped into a nozzle, the subsequent applied electric field promotes the fluid to overcome the surface tension of the droplet at the tip of the spinneret, and the droplet forms a Taylor cone. The viscosity of the solution prevents the formation of separate droplets, allowing a single fiber to be drawn from the solution [7,9]. Then, the jet shrinks in diameter to form micro and nanofibers that dry and get collected on the counter electrode [7,8,10,11]. The electrospinning process can be divided into four stages [8,10]: jet initiation, Nanomaterials 2017, 7, 16; doi:10.3390/nano7010016
www.mdpi.com/journal/nanomaterials
Nanomaterials 2017, 7, 16
2 of 15
Nanomaterials 2017, 7, 16
2 of 15
jet initiation, rectilinear jet, bending instability, and fiber solidification and collection (Figure 1). During the jet initiation stage, repulsive interactions dominate(Figure the Taylor cone formation rectilinear jet, bending instability, and Coulomb fiber solidification and collection 1). During the jet [8,12].initiation In the stage, rectilinear jet stage, the interactions viscoelasticdominate forces and surfacecone tension compensate repulsive Coulomb the Taylor formation [8,12]. Infor the any rectilinear of jet the stage, viscoelastic forces surface tension for no anylonger perturbations of the perturbations jetthe [11]. However, at aand certain point the compensate viscosity can stabilize the jet [11]. However, at a certain point the viscosity can no longer stabilize the perturbations and perturbations and whipping occurs, known as the bending instability stage. At this point the jet starts whipping known as thewith bending stage. At this pointthan the jet whipping whipping in aoccurs, circular motion, eachinstability consecutive circle larger thestarts previous one.inIt is a circular motion, with each consecutive circle larger than the previous one. It is considered that fiber considered that fiber thinning mostly happens in this stage [11]. Finally, the whipping jet reaches the thinning mostly happens in this stage [11]. Finally, the whipping jet reaches the collector plate and collector plate and deposits the fibers on its surface. Upon touching the electrode, trapped deposits the fibers on its surface. Upon touching the electrode, trapped electrostatic charges start being electrostatic charges start being released to the ground [8,13,14]. released to the ground [8,13,14].
Figure 1. Schematic representation of the electrospinning process.
Figure 1. Schematic representation of the electrospinning process. Ceramic nanofibers can be formed when a suitable precursor is introduced in the solution. Initially, organic-inorganic fibers when are spun. Then, a thermal treatment is appliedin to the the green Ceramic nanofibers can hybrid be formed a suitable precursor is introduced solution. fibers to burn out the organic compounds, and form dense crystalline ceramic fibers [1,2]. However, Initially, organic-inorganic hybrid fibers are spun. Then, a thermal treatment is applied to the green good control over the resulting microstructure remains a challenge and the process is not fibersachieving to burn out the organic compounds, and form dense crystalline ceramic fibers [1,2]. However, fully understood [8,15]. The reproducibility of the process should also be further improved in order to achieving good control over the resulting microstructure remains a challenge and the process is not provide an economically feasible route to production [1]. fully understood [8,15]. The reproducibility of the process should also be further improved in order The fabrication of ceramic nanofibers by electrospinning has been reviewed elsewhere [1,2,16,17]. to provide economically feasible routeoftoceramic production [1]. of diverse compositions, fabrication These an papers describe the fabrication nanofibers The fabrication of ceramicNonetheless, nanofibers all bytheoretical electrospinning has beenstudies reviewed elsewhere [1,2,16,17]. methods and applications. and parametric of electrospinning and Thesesetup papers describe the fabrication of ceramic nanofibers of diverse compositions, fabrication assemblies available so far are based on the formation of polymeric fibers [7,8]. methods and Nonetheless, all theoretical and studies ofnanofibers electrospinning Hereapplications. we report a systematic parametric study on theparametric formation of ceramic by the and process.so Yttria-stabilized (YSZ) and nickel oxide (NiO) were taken as model setupelectrospinning assemblies available far are based zirconia on the formation of polymeric fibers [7,8]. compounds, and both dense and hollow YSZ fibers are reported. Yttria-stabilized zirconia has Here we report a systematic parametric study on the formation of ceramic nanofibers by the a wide range of applications: it is thermally and chemically very stable, a good ionic conductor at electrospinning process. Yttria-stabilized zirconia (YSZ) and nickel oxide (NiO) were taken as model high temperatures, and used in thermal barrier coatings, while NiO is a semiconductor and has compounds, and both dense and hollow YSZ fibers are reported. Yttria-stabilized zirconia has a wide been proposed as photoanode. The most prominent difference between the YSZ and NiO precursor range of applications: it is thermally and chemically very stable, a good ionic conductor at high solutions is the ionic strength of the solution, which strongly affects the spinnability of the fibers. temperatures, and used in thermal barrier coatings, while NiO is a semiconductor and has been The physicochemical properties of the precursor solutions and the main process parameters of both proposed photoanode. The most prominent differencetheir between the on YSZ and NiO and precursor types as of solution were varied systematically to determine influence spinnability, on solutions is the ionic strength of the solution, which strongly affects the spinnability of the fibers. the microstructure and morphology of the resulting fibers. The experimental data are compared The physicochemical properties of the precursor and the processofparameters of bothon types with literature data to interpret the results.solutions We confirmed the main applicability theoretical studies of solution were varied systematically to determine their influence on spinnability, and on the electrospinning of polymers on the formation of arrays of metal oxide nanofibers.
microstructure and morphology of the resulting fibers. The experimental data are compared with literature data to interpret the results. We confirmed the applicability of theoretical studies on electrospinning of polymers on the formation of arrays of metal oxide nanofibers.
Nanomaterials 2017, 7, 16
Nanomaterials 2017, 7, 16 2. Results and Discussion
3 of 15
3 of 15
ResultsProperties and Discussion 2.1.2.Solution
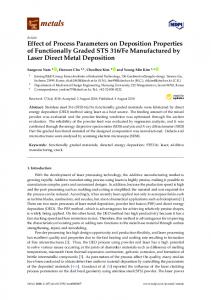
The electrospinning 2.1. Solution Properties process typically yielded fibers as shown in Figure 2A. The fibers shown were highly disordered and their average diameter was 530 ± 121 nm as determined from statistical The electrospinning process typically yielded fibers as shown in Figure 2A. The fibers shown analysis of the scanning electron microscopy (SEM) pictures. physical properties of the were highly disordered and their average diameter was 530 ± 121 nmThe as determined from statistical solution played crucial role in the electrospinning processThe [1,18,19]. The main solution properties analysis of theascanning electron microscopy (SEM) pictures. physical properties of the solution affecting the electrospinning process are viscosity η, conductivity σ, surface tension γ, and solvent played a crucial role in the electrospinning process [1,18,19]. The main solution properties affecting volatility [8,10,11,19]. process We measured theseη, physical properties experimentally. volatility can be the electrospinning are viscosity conductivity σ, surface tension γ, andThe solvent volatility extrapolated from solvent’s boiling point [19–22]. We investigated the influence of both the [8,10,11,19]. Wethemeasured these physical properties experimentally. The volatility canpolymer be from the solvent’s boiling point [19–22]. We influence of bothofthe andextrapolated precursor concentration on the solution properties andinvestigated the resultingthe fibers. The results these polymer and precursor concentration on the solution properties and the resulting fibers. The results experiments in which the polymer concentration was kept constant while the precursor concentration these between experiments which polymer was kept constant while the precursor wasofvaried 0.45inand 0.65the M are shownconcentration in Figure 2B,C. concentration was varied between 0.45 and 0.65 M are shown in Figure 2B,C.
Figure 2. (A) Scanning electron pictureofofthree threepercent percent yttria partially-stabilized Figure 2. (A) Scanning electronmicroscopy microscopy (SEM) (SEM) picture yttria partially-stabilized zirconia (3YSZ) fibers. Precursor concentration 0.65 M, polymer concentration mg/mL zirconia (3YSZ) fibers. Precursor concentration 0.65 M, polymer concentration 10 10 mg/mL polyvinylpyrrolidone(PVP). (PVP). Influence Influence of concentration on (B) diameter (nm) and (C)and polyvinylpyrrolidone ofprecursor precursor concentration onfiber (B) fiber diameter (nm) (μS/m; blackblack squares), static viscosity (mPa·s; red triangles) and surfaceand tension (C) solution solutionconductivity conductivity (µS/m; squares), static viscosity (mPa ·s; red triangles) surface (mN/m; blue circles). Polymer concentration 10 mg/mL. Influence Influence of polymer on (D) tension (mN/m; blue circles). Polymer concentration 10 mg/mL. ofconcentration polymer concentration fiberfiber diameter (nm)(nm) and (E) conductivity (μS/m;(µS/m; black squares), static viscosity (mPa·s; (mPa red ·s; on (D) diameter andsolution (E) solution conductivity black squares), static viscosity triangles) and surface tension (mN/m; blue circles). Precursor concentration 0.65 M. red triangles) and surface tension (mN/m; blue circles). Precursor concentration 0.65 M.
Nanomaterials 2017, 7, 16
4 of 15
The viscosity and surface tension did not change significantly with precursor concentration. A linear correlation between the precursor concentration and fiber diameter after drying and thermal treatment is found. The fiber diameter varied from 300 ± 44 nm at low precursor concentration to 530 ± 120 nm at high concentration. The fibers formed from the solutions with lowest precursor concentration included beads of a few micrometers in size. The conductivity increased with precursor concentration. This can be attributed to the higher concentration of free ions and other species susceptible to ionization. The results indicate that the fiber diameter is primarily dependent on the equivalent solids content after thermal annealing. Although high conductivity might result in thinner polymeric or green fibers [19], the influence of solution conductivity on fiber diameter after annealing was found to be much less prominent than the solids content. Previous studies on ceramic fibers with different composition showed a similar trend [1,15]. Beaded fibers have been attributed to low viscosities [18,19] in polymer electrospinning experiments. However, in our experiments we did not observe a relationship between viscosity and the occurrence of beaded fibers. A stable jet results from a balance between viscoelasticity, surface tension and electrostatic forces, besides the pressure drop due to the pump [12,23]. The electrostatic force is mainly dictated by the conductivity of the solution in a given electric field [8]. The beaded fibers resulted from solutions with low conductivity, which had a similar viscosity and surface tension as solutions that produced fibers without beads. These findings suggest that the force balance between viscosity, surface tension and conductivity was shifted so that the jet could no longer maintain a stable fiber shape, which finally resulted in the formation of beads. Indeed, previous studies have shown that formation of beaded polymeric fibers can be avoided by the addition of soluble salts to a solution in order to increase its conductivity [19,22,24]. The influence of polymer concentration on solution properties and the resulting fibers is presented in Figure 2D,E. We observed an increase of fiber diameter with PVP concentration from 330 ± 68 nm to 754 ± 220 nm. The viscosity of the solution increased considerably with increasing polymer concentration, while it did not have a significant influence on the conductivity or the surface tension. The sample with high concentration of 20 mg/mL PVP was too viscous given the low surface tension, and this resulted in a slightly unstable jet producing a wide range of fiber diameters. This may have been the result of a force balance shift that hampered the jet stability [12,23]. We found that the influence of polymer concentration on viscosity is the main parameter that determines the fiber diameter in these experiments. A high viscosity stabilizes the jet and hinders the whipping phenomenon, which is considered to be the main cause of thinning and fiber formation [10,11]. The dynamic viscosity of the standard solution in Figure 3 shows shear thinning behavior at high shear rates. This means that while the jet is whipping, i.e., high shear, the dynamic viscosity of the solution decreases, which may allow the electrostatic instabilities to exert a larger influence. Nevertheless, the rapid viscosity increase is also determined by the high evaporation rate in the whipping stage. Typically, solutions for electrospinning of ceramics contain a metal alkoxide precursor that condenses and forms a polymer-like network [1,25]. Such solutions can be considered as weak electrolytes, similar to polymeric solutions with low conductivity [8]. In contrast, complete dissociation of salts, such as metal nitrates, which are also common ceramic precursors, leads to strong electrolytes in aqueous solution. Such strong electrolytes cannot be easily electrospun due to their large conductivity. The model system we investigated was NiO made from nickel nitrate solutions. The conductivity of a 0.21 M solution of nickel nitrate in milliQ water was 60.1 × 10⁴ ± 30 µS/cm, which is three orders of magnitude larger than that of the three percent yttria partially-stabilized zirconia (3YSZ) solution (58 ± 0.07 µS/cm), as discussed above. To reduce the solution’s conductivity, nickel nitrate was dissolved in other solvents at the same concentration. In ethanol and 2-ME, the conductivity reduced to 5.41 × 10³ ± 5 µS/cm and 3.28 × 10³ ± 58 µS/cm, respectively (Figure 4A). The lower conductivity results from the lower polarity of the latter solvents compared to water, which
Nanomaterials 2017, 7, 16
5 of 15
Nanomaterials 2017, 7, 16 5 of 15 reduces the degree of dissociation of metal salts, and the smaller acid dissociation constant of the respective solvents. Moreover, 2-ME is widely used as a complexing agent for the stabilization of respective solvents. Moreover, 2-ME is widely used as a complexing agent for the stabilization of metal ions and metal alkoxide precursors [26,27]. Complexing agents can reduce the concentration metal ions and metal alkoxide precursors [26,27]. Complexing agents can reduce the concentration of of unbound ions in the solution and, consequently, lower the conductivity. Here, citric acid (CA) unbound ions in the solution and, consequently, lower the conductivity. Here, citric acid (CA) was was used as additional complexing agent. Figure 4B shows a linear decrease of conductivity with used as additional complexing agent. Figure 4B shows a linear decrease of conductivity with increasing molar ratio of CA to Ni. The conductivity in 2-ME decreased from 3.28 × 10³ 3± 58 µS/cm increasing molar ratio of CA to Ni. The conductivity in 2-ME decreased from 3.28 × 10 ± 58 µ S/cm without CA to 1.17 × 1033 ± 3 µS/cm at a CA-to-Ni molar ratio of 6. without CA to 1.17 × 10 ± 3 µ S/cm at a CA-to-Ni molar ratio of 6.
Figure 3. Dynamic Dynamicviscosity viscositydata data standard solution. Precursor concentration, 0.65PVP M; Figure 3. of of thethe standard solution. Precursor concentration, 0.65 M; PVP concentration, 10 mg/mL. concentration, 10 mg/mL.
We also also investigated investigated the the influence influence of of the PVP concentration on the conductivity and viscosity of We the nickel nitrate solution in 2-ME (without additional complexing agents), see Figure 4C. Increasing concentration resulted resulted in in aa decrease decrease of ofconductivity conductivitytoto1.13 1.13×× 10 1033 ± ± 4 µS/cm µ S/cm at the PVP concentration at a PVP mg/mL. However, to 100 100 mg/mL, mg/mL, concentration of 70 mg/mL. However, upon upon further increase of the polymer content to the conductivity conductivity increased increasedto to2.27 2.27×× 1033 ± 2 µ S/cm. This inversion of the trend can be understood ± 2 µS/cm. This inversion of the trend can be understood by considering that thatPVP PVP acts a complexing forat ions at low concentrations [28]. Hence, a considering acts as aascomplexing agentagent for ions low concentrations [28]. Hence, a decreasing decreasing conductivity is expected withpolymer increasing polymer content due degree to increasing degree of conductivity is expected with increasing content due to increasing of complexation. complexation. ionscomplex are partwith of PVP somebeyond complex with concentration PVP beyond threshold, a certain However, most However, Ni ions aremost part ofNisome a certain concentration threshold, andissince the polymer itself itiscontributes also ionically charged, it contributeswhen to the and since the polymer itself also ionically charged, to the total conductivity it total conductivity when it is in the solution in unbound form. Any further addition of PVP will thus is in the solution in unbound form. Any further addition of PVP will thus result in a conductivity result in[29]. a conductivity increase [29]. ThePVP viscosity increased with 4D), PVPsimilar concentration (Figure 4D), increase The viscosity increased with concentration (Figure to the 3YSZ solution. similar to theoxide 3YSZfibers solution. Nickel were successfully spun using a solution of 0.21 M nickel nitrate in 40:60 Nickel oxide (by fibers were successfully using of a solution 0.21 M nickel in 40:60 isopropanol:2-ME volume), with a molar spun ratio CA:Ni 6, and 70 of mg/mL PVP. The nitrate phase-purity of isopropanol:2-ME volume),using with X-ray a molar ratio CA:Ni of 6,The andresults 70 mg/mL The phase-purity the NiO fibers were(by confirmed diffraction (XRD). of thePVP. experiments in which of the NiO fibers were confirmed using diffraction (XRD). results of theby experiments in the polymer concentration was varied wereX-ray in good accordance withThe a model reported Shenoy et al., the polymer concentration was varied were in good accordance with a model reported by which was used to calculate the optimal polymer concentration for electrospinning [30]. Good results Shenoy al., which wasobtained used to calculate the optimalorpolymer concentration for electrospinning [30]. for NiO et have also been with acetylacetone N,N-dimethyl formamide as solvents and/or Good resultsagents for NiO have also been obtained with acetylacetone or N,N-dimethyl formamide as complexing [31,32]. solvents complexing agents The and/or ceramic microfibers after[31,32]. collection and thermal annealing are shown in Figure 4E. The ceramic microfibers after collection thermal are shown Figure The conductivity and viscosity of the nickel and solution wereannealing significantly higher in than those4E. of The the conductivity and viscosity of the nickel solution were significantly higher than those of the 3YSZ 3YSZ solution (Table 1). As modeled by Thompson et al. [33], the jet’s momentum can be considered solution (Table 1). As modeled by Thompson et al. [33], the momentum can be Feng considered as a as a balance of electrical force counteracted by viscoelastic andjet’s surface tension forces. reported balance of electrical force counteracted by viscoelastic and surface tension forces. Feng reported a force balance of the jet as expressed by Equation 1 [23]: force balance of the jet as expressed by Equation 1 [23]: −p + τ = tee - γ/R, (1) −p + τ = t – γ/R, (1) e where p is the the pressure pressure drop drop related related to to the the setup’s setup’s pump, pump, ττ the the viscous viscous stress, stress, tte the tension caused by the electrical field, γ γ the surface tension of the solution and R the jet radius. radius. The electric force is governed by electrostatic charges in the solution, which can be correlated to the solution conductivity. The viscoelastic forces (τ) are correlated to the solution viscosity.
Nanomaterials 2017, 7, 16
6 of 15
governed by electrostatic charges in the solution, which can be correlated to the solution conductivity. Nanomaterials 2017,forces 7, 16 (τ) are correlated to the solution viscosity. 6 of 15 The viscoelastic
Figure 4.4.(A) ofaa0.21 0.21MM Ni(NO )2 solution in various solvents; (B) conductivity Figure (A)Conductivity Conductivity of Ni(NO 3) 2 3 solution in various solvents; (B) conductivity of a 0.21of a 0.21 M Ni(NO in at 2-ME at different molar ratios citric acid (CA):Ni; (C) conductivity M Ni(NO 3)2 solution in 2-ME different molar ratios citric acid (CA):Ni; (C) conductivity of a 0.21 Mof 3 )2 solution a 0.21 M 3Ni(NO 2-ME with different polymer concentrations; (D)ofviscosity a 0.21 Ni(NO )2 solution in 2-ME in with different polymer concentrations; (D) viscosity a 0.21 M of Ni(NO 3)2M 3 )2 solution solution in 2-ME with different polymer concentrations. The conductivity of the final 0.21 M Ni(NO 3)2 Ni(NO ) solution in 2-ME with different polymer concentrations. The conductivity of the final 3 2 solution and 3the standardand 3YSZ also plotted reference; and as (E)reference; electrospun NiO 0.21 M Ni(NO )2 solution theare standard 3YSZas are also plotted and (E)microfibers electrospun from a 0.21 M Ni(NO solution in 2-ME 70 mg/mL of PVP ratio NiO microfibers from 3a)20.21 M Ni(NO solution in 2-ME withat70a molar mg/mL of CA:Ni PVP atofa 6:1. molar ratio 3 )2 with CA:Ni of 6:1. Table 1. Solution properties of three percent yttria partially-stabilized zirconia (3YSZ) and NiO precursor solutions. 3YSZ solution has percent a precursor concentration of 0.65 M and PVP concentration of Table 1. Solution properties of three yttria partially-stabilized zirconia (3YSZ) and NiO 10 mg/mL. NiO precursor solutionhas hasa aprecursor precursorconcentration concentration of of 0.65 0.21 M M and in 2-ME 70 mg/mLof precursor solutions. 3YSZ solution PVPwith concentration PVP and citric acid in 6:1 CA:Nihas molar ratio. 10 of mg/mL. NiO precursor solution a precursor concentration of 0.21 M in 2-ME with 70 mg/mL of PVP and citric acid in 6:1 CA:Ni molar ratio.
3YSZ NiO 46 ± 0.15 325 ± 2 3YSZ NiO 58 ± 0.07 397 ± 5 46 ± 0.15 325 9.45 ± 0.07 9.58±±20.05 σ (µS/cm) 58 ± 0.07 397 ± 5 We observed comparable values for surface tension and a similar ratio between the viscosity and γ (mN/m) 9.45 ± 0.07 9.58 ± 0.05 conductivity for both the nickel oxide precursor solution and the 3YSZ solution; looking at Equation (1), both solutions, therefore, experience an almost equal force contribution from surface tension and maintain a similar balance between viscosity- and conductivity-associated forces. The comparable η (mPa·s) σ (μS/cm) η (mPa·s) γ (mN/m)
Nanomaterials 2017, 7, 16
7 of 15
We observed comparable values for surface tension and a similar ratio between the viscosity and conductivity for both the nickel oxide precursor solution and the 3YSZ solution; looking at Equation (1), both solutions, therefore, experience an almost equal force contribution from surface tension and maintain a similar balance between viscosity- and conductivity-associated forces. The comparable electrospinning performance of these two solutions further corroborates the theory described by Equation (1) that a stable cone and jet are the result of a balance between viscoelastic, surface tension and electric forces [11,12,23,33], irrespective of their absolute magnitudes. 2.2. Process Parameters It has been reported that a decrease of flow rate results in smaller polymeric fiber diameters [19]. Conversely, an increased flow rate has been thought to reduce the charge density in the jet [10,34], thus stabilizing the rectilinear jet region [10,11]. A longer stable jet implies a short whipping region and, thus, less fiber thinning [11], resulting in thicker fibers. We, therefore, investigated the influence of the flow rate on the rectilinear jet length and compared it with the final ceramic nanofiber diameter after collection. Indeed we observed that the rectilinear jet was longer when the flow rate was higher (Figure 5A,B), and the fiber diameter and rectilinear jet length followed the same trend. The effect of the electric field strength on fiber diameter and jet length is presented in Figure 5C. The potential difference between spinneret and collector plate was varied between 5 and 25 kV, i.e., field strengths between 250 and 1250 V/cm, see Figure 5D. At 250 V/cm the solution was not fully electrified, and droplet formation was dominant. Between 500 and 1000 V/cm the solution was fully electrified and a stable jet was observed. At 1250 V/cm the solution was over-electrified, which resulted in an unstable jet that eventually sprayed (Figure 5D). The fiber diameter did not change within the voltage range where a stable jet was found (600 ± 100 nm). At field strengths < 500 V/cm, the fiber diameter was 430 ± 75 nm. We attribute the smaller diameter to the lower speed of the jet at a constant evaporation rate, which results in a shorter rectilinear jet and, thus, to a longer whipping region. At a 1250 V/cm field strength the fiber diameter was also reduced to 450 ± 150 nm. This can be understood by considering that, at very high voltages, the field strength stretches the jet and makes it whip even more, reducing the fiber diameter [18]. This phenomenon was confirmed by the observation of a highly unstable jet with a very short rectilinear jet length. A convection oven and a microwave oven were employed to thermally treat YSZ nanofibers. Phase analysis using XRD confirmed the formation of phase-pure YSZ. The total mass loss was about 45% according to thermogravimetric analysis (Figure 5E). However, the surface morphology varied considerably with the mode of heating and the heating rate (Figure 5F), while the fiber diameter did not vary significantly (Figure 5G). Rougher surfaces were observed for samples annealed in a convection oven, which can be explained in terms of the heating mechanism [35–37]. Microwave heating has been reported to produce denser and smoother ceramic thin films than when prepared in a convection oven [36–42]. The precise mechanism of sintering using microwave radiation is not well understood [36,43], but the smoothness of the fibers is attributed to sudden shrinkage and densification, decreased step-bunching mechanism, and/or enhanced oxygen mobility resulting from the effect of microwave radiation on the polar solvents [36,40,41]. The sample heat-treated by rapid thermal annealing showed the smallest crystallite size, 9.5 ± 0.1 nm, whereas the sample with a slow heating rate of 1 ◦ C/min had the largest size, 24 ± 1.0 nm. See Figure 5H. The differences can be attributed to the effective annealing time. At lower heating/cooling rates, a sample will remain longer at a temperature where grain growth can occur. However, the difference in grain size between two of the samples heated and cooled at 5 ◦ C/min can only be attributed to differences in heating mechanism. Xie et al. reported smaller and more uniform grain sizes when zirconia was sintered in a microwave oven [37], and the nanofibers presented here may have undergone a similar process.
Nanomaterials 2017, 7, 16 Nanomaterials 2017, 7, 16
8 of 15
8 of 15
Figure (A) Influenceofofflow flowrate rateon onelectrospinning electrospinning process. Flow Fiber diameter Figure 5. 5. (A) Influence Flow rate rate0.05–1 0.05–1mL/h. mL/h. Fiber diameter (black squares) and rectilinearjet jetlength length(blue (blue circles) circles) at (B)(B) rectilinear (black squares) and rectilinear at different differentflow flowrates ratesare areshown; shown; rectilinear length flow ratesofof0.05–1 0.05–1mL/h; mL/h; (C) and collector plate. jet jet length at at flow rates (C) influence influenceof ofpotential potentialbetween betweenspinneret spinneret and collector plate. Fiber diameter at voltages between 5 and 25 kV are shown; (D) electrospinning jet at voltages of 5–25kV; Fiber diameter at voltages between 5 and 25 kV are shown; (D) electrospinning jet at voltages of 5–25 (E) thermogravimetic analysis differential scanning calorimetry(5(5◦°C/min surface (E)kV; thermogravimetic analysis and and differential scanning calorimetry C/minininair); air);(F)(F) surface morphology of ceramic fibers after different annealing procedures; (G) fiber diameters after different morphology of ceramic fibers after different annealing procedures; (G) fiber diameters after different annealing procedures;and and(H) (H)crystallite crystallitesize sizeof of ceramic ceramic fibers fibers after annealing procedures; after different differentannealing annealingprocedures. procedures.
2.3. Hollow Fibers 2.3. Hollow Fibers Ceramic hollow fibers were made using a spinneret with two concentric needles (Figure 6a). The Ceramic hollow fibers were made using a spinneret with two concentric needles (Figure 6a). 3YSZ precursor solution was pumped through the outer needle and an immiscible polymer solution The 3YSZ precursor was pumped throughterephthalate the outer needle and an through immiscible poly(ethylene oxidesolution terephthalate)/poly(butylene (PEOT/PBT) the polymer inner solution poly(ethylene oxide terephthalate)/poly(butylene terephthalate (PEOT/PBT) through needle. The outer flow rate was kept constant at 1 mL/h and the inner flow rate was varied from 0.2the inner needle. The At outer was0.4 kept constant 1 mL/h innerasflow rate was varied mL/h to 1 mL/h. flowflow ratesrate below mL/h hollow at fibers couldand not the be made the inner polymer from 0.2 mL/h to 1 mL/h. At flow rates below 0.4 mL/h hollow fibers could not be made as the inner content was not enough to maintain a hollow fiber geometry, see Figure 6b. Dense fibers with isolated polymer content wasCeramic not enough to maintain a hollow fiber geometry, see Figure 6b. Dense with porosity formed. hollow fibers were only formed at inner flow rates between 0.4fibers and 0.6 isolated formed. hollowregime fibers were onlyflow formed inner betweenon0.4 and mL/h porosity (Figure 6c). In thisCeramic rather narrow the inner rateat did not flow have rates an influence the diameter error. regime The annealed fibers had outer of influence 530 ± 128 on nmthe 0.6final mL/h (Figurewithin 6c). Inexperimental this rather narrow the inner flow rate did diameters not have an and inner diameters of 230 ± 93 error. nm (Figure 6d,e). Above two immiscible solutions final diameter within experimental The annealed fibers 0.6 hadmL/h, outer the diameters of 530 ± 128 nm and inner diameters of 230 ± 93 nm (Figure 6d,e). Above 0.6 mL/h, the two immiscible solutions formed
Nanomaterials 2017, 7, 16
9 of 15
Nanomaterials 2017, 7, 16
9 of 15
an emulsion and the jet became unstable. Spinning of hollow NiO nanofibers was not successful, formed an be emulsion andtothe becamehigh unstable. Spinning of salt hollow NiO nanofibers was not which may attributed the jet relatively conductivity of the solution. successful, which may be attributed to the relatively high conductivity of the salt solution.
Figure 6. (a) porous fibers. fibers. Inner flow rate is is 0.2 0.2 mL/h mL/h (a) Coaxial Coaxial spinneret; spinneret; (b) coaxial spinning of porous PolyActive solution; Outer flow flow rate rate is 1 mL/h mL/h of of3YSZ 3YSZprecursor precursor solution; solution; no no hollow hollow fibers fibers are formed; (c) hollow fiber made by coaxial electrospinning. electrospinning. Inner Inner flow flow rate rateis is 0.6 0.6 mL/h mL/h of of the the PolyActive PolyActive solution; the outer flow rate rete is 1 mL/h mL/hof of3YSZ 3YSZsolution; solution;(d) (d)frequency frequencydistribution distribution of of the the inner inner hollow hollow fiber fiber diameter outer flow rate is is 1 diameter at at inner inner flow flow rates rates of of 0.4 0.4 and and 0.6 0.6 mL/h mL/hofofthe thePolyActive PolyActivesolution. solution.The The outer flow rate 1 mL/h 3YSZ precursor solution;and and(e) (e)frequency frequencydistribution distributionofofthe theouter outerhollow hollow fiber fiber diameter diameter mL/h of of 3YSZ precursor solution; The fibers fibers shown were thermally treated at 850 ◦°C. C. under the same conditions. The
2.4. Nanofiber Nanofiber Alignment Experiments Experiments were were carried carried out out to align the as-synthesized nanofibers by electric field-driven alignment (Figure 7A) and by mechanically-driven and by mechanically-driven alignment alignment (Figure (Figure 7B). 7B). We We recently recently demonstrated demonstrated the use of of array-like array-like structures structures to to fabricate fabricate aa UV UV sensor sensor and and aa field field effect effect transistor transistor(FET) (FET)device device[44]. [44]. In field-driven field-driven alignment, two connected connected ground ground electrodes electrodes with aa gap gap in inbetween betweenthem themisisemployed. employed. The gap distance distance and flow rate were varied and the influence on the degree of alignment alignment was was investigated. investigated. Earlier Earlierstudies studieson on polymers polymersshowed showedan an influence influence of of gap gap distance distance on on the the degree degree of alignment of ofthe thefibers fibers [13,45]. Simulations indicated thatlateral the lateral force by the field electric field [13,45]. Simulations indicated that the force by the electric increases increases with gap distance, favors alignment. The results ofusing an experiment using YSZ with gap distance, which favorswhich alignment. The results of an experiment YSZ precursor in which precursor in which flowand ratethe was mL/h and gapfrom distance from 1.0 to 7.5 cm is the flow rate was 0.5the mL/h gap0.5 distance wasthe varied 1.0 towas 7.5 varied cm is shown in Figure 7C,D. shown in Figure 7C,D. The degree of alignment was lower at shorter gap distances than at larger gap The degree of alignment was lower at shorter gap distances than at larger gap distances, in agreement distances, in agreement with previously reportedwith datapreviously [13,45]. reported data [13,45]. The The influence influence of flow rate was studied by keeping the gap distance distance constant constant at at 2.0 cm while varying the flow rate from from 0.05 0.05 mL/h mL/h to to 11 mL/h. mL/h.The Theresults resultsare arepresented presentedin inFigure Figure7E,F. 7E,F. At At very very low low flow rates, e.g., 0.05 mL/h, mL/h, the the alignment alignmentwas was nearly nearly perfect, perfect, but but the the packing packing density density of of wires was low (Figure 7F). The degree of alignment decreased with the increasing flow rate. It is known that the electrical potential at the gap center plays a crucial role in the alignment process [13,45]. A near-zero potential at the gap gap center center favors favors the the lateral lateral electrostatic electrostatic forces forces that thatdrive drivethe thefiber fiberalignment alignmentprocess. process. In our experiments we observed that the electrical potential at the gap center increased with the our experiments we observed that the electrical potential at the gap center increased withflow the rate, thus thus obstructing fiberfiber alignment. Under steady-state conditions, there flow rate, obstructing alignment. Under steady-state conditions, thereshould shouldbe beaa balance between charges arriving from the jet and charges flowing to the electrode. The main cause of charge charge buildup in our experiments is probably the low conductivity of the hybrid fibers, preventing fast buildup in experiments is probably conductivity of discharge to the electrodes. Nanofiber alignment alignment was was also alsolimited limitedtotoshort shortdeposition depositiontimes times[7,15]. [7,15].We We observed a decrease observed a decrease of of alignment in the course of time (Figure 7F,G). probably occurred formation of thicker alignment in the course of time (Figure 7F,G). This This probably occurred upon upon formation of thicker layers layers of fibers, where the bottom layer is thought to prevent new fibers from depositing on the
Nanomaterials 2017, 7, 16
10 of 15
Nanomaterials 2017, 7, x FOR PEER REVIEW
10 of 15
of fibers, where the bottom layer is thought to prevent new fibers from depositing on the electrodes, and hinder their discharge, so that the jet becomes unstable and starts to whip, leading to loss of electrodes, and hinder their discharge, so that the jet becomes unstable and starts to whip, leading to alignment. An example is shown in Figure 7G. loss of alignment. An example is shown in Figure 7G.
Figure alignment: two two ground electrodes with with an insulating gap; gap; (B) Figure 7. 7. (A) (A)Electrically‐driven Electrically-driven alignment: ground electrodes an insulating mechanically‐driven alignment: rotating mandrel as the electrode. (C,D) (C,D) Influence of gap (B) mechanically-driven alignment: rotating mandrel asground the ground electrode. Influence of distance on the degree of alignment of thermally‐annealed fibers after 15 s of deposition. The flow gap distance on the degree of alignment of thermally-annealed fibers after 15 s of deposition. The flow rate is 0.25 mL/h; (C) degree of alignment versus gap distance; (D) SEM pictures of the samples spun rate is 0.25 mL/h; (C) degree of alignment versus gap distance; (D) SEM pictures of the samples spun with gap distances of 1.0 and 7.5 cm. (E,F) Influence of the flow rate of the 3YSZ precursor solution with gap distances of 1.0 and 7.5 cm. (E,F) Influence of the flow rate of the 3YSZ precursor solution on thethe degree of alignment of fibers after 15 s of15 deposition. Gap distance is 2.0 cm;is (E) degree of degree alignment Gap distance 2.0 cm; (E) of on degree of alignment of fibers after s of deposition. and voltage versus ground at the gap center flow rate; (F)flow SEMrate; pictures of thepictures samplesof spun alignment and voltage versus ground at the versus gap center versus (F) SEM the with flow rateswith of 0.05 mL/h 1 mL/h. of deposition time on directionality of samples spun flow rates and of 0.05 mL/h (G,H). and 1 Influence mL/h. (G,H). Influence of deposition time on a sample spun at 0.25 mL/h of the 3YSZ precursor solution and a gap of 2.0 cm; (G) degree of alignment directionality of a sample spun at 0.25 mL/h of the 3YSZ precursor solution and a gap of 2.0 cm; (G) and voltage at the gap center versus time; (H) SEM image of a samples spun for 90 s. (I,J) Mechanical degree of alignment and voltage at the gap center versus time; (H) SEM image of a samples spun for alignment of nanofibers with a rotating mandrel;with (I) degree of alignment vs (I) linear speed the mandrel; degree of ofalignment vs 90 s. (I,J) Mechanical alignment of nanofibers a rotating mandrel; (J) Sample spun for 30 min. All samples were spun at a flow rate of 1 mL/h of 3YSZ solution and linear speed of the mandrel; (J) Sample spun for 30 min. All samples were spun at a flow rate of 1 thermally treated. mL/h of 3YSZ solution and thermally treated.
Mechanical alignment presents an alternative method to align nanofibers (Figure 7B). We utilized a rotating mandrel as grounded electrode and a flow rate of 1 mL/h. The rotating speed of
Nanomaterials 2017, 7, 16
11 of 15
Mechanical alignment presents an alternative method to align nanofibers (Figure 7B). We utilized a rotating mandrel as grounded electrode and a flow rate of 1 mL/h. The rotating speed of the mandrel was varied and the influence on alignment was quantified. The degree of alignment vs. linear velocity of the mandrel is plotted in Figure 7H. It can be seen that the alignment is better at higher speeds. This method allowed higher flow rates and longer deposition times to form thicker layers without influencing the alignment process negatively. Figure 7I shows a sample spun for 30 min at 1 mL/h. However, the alignment achieved with the gap method, which can easily reach 90–95%, is considerably better than the mechanical alignment, which is in the range of 70–90%. 3. Materials and Methods 3.1. Chemicals Zirconium(IV) n-propoxide (Zr[(OC3 H7 )]4 ), 70 w/w % in propanol) and yttrium(III) acetate hexahydrate (Y(CH3 COO)3 ·6H2 O, purity 99.9%) were purchased from Alfa Aesar GmbH (Karlsruhe, Germany). 2-methoxyethanol (2-ME; 99.3%) and 1-propanol (99.9%) were acquired from Sigma-Aldrich (Zwijndrecht, Netherlands). Ethanol (99.8%) was purchased from Atlas and Assink Chemie bv (Enschede, Netherlands). Nickel(II) nitrate hexahydrate (Ni(NO3 )2 ·6H2 O) was acquired from Merck (Darmstadt, Germany), polyvinyl pyrrolidone (PVP, Mw 1,300,000) from Sigma-Aldrich (Zwijndrecht, Netherlands) and citric acid monohydrate (CA; 99.5%) from Alfa Aesar (Karlsruhe, Germany). All chemicals were used as received. A poly(ethylene oxide terephthalate)/poly(butylene terephthalate) (PEOT/PBT) copolymer was purchased from PolyVation BV. It consists of 45 wt % polyethylene oxide terephthalate and 55 wt % of polybutylene terephthalate. Chloroform (≥99%) was acquired from Sigma-Aldrich (Zwijndrecht, Netherlands) and 1,1,1,3,3,3-hexafluoro-2-propanol (HFIP) from Biosolve (Valkenswaard, Netherlands). 3.2. Electrospinning Solutions Three percent yttria partially-stabilized zirconia (3YSZ) was taken as the model composition and was prepared using a metal alkoxide precursor. Solution preparation was done in a nitrogen atmosphere. Briefly, zirconium n-propoxide and yttrium acetate were dissolved in n-propanol at a molar ratio of 97:6, respectively. Then, 5–20 mg/mL of PVP was added to the solution and the solution was left stirring overnight to complete dissolution. Finally, it was placed into a syringe connected to the electrospinning setup. The standard solution consisted of a 0.45–0.65 M solution of metal precursor and 10 mg/mL PVP. The polymer concentration was varied from 5 to 20 mg/mL PVP. We also investigated the formation of nickel oxide fibers from nickel salt solutions. A 3 M (stock) solution of Ni(NO3 )2 in 2-ME was made and stirred overnight in air to allow complete dissolution. Additional isopropanol was added to bring the total volume fraction of 2-ME in the final solution to 0.4. Citric acid (CA) was added in a 6:1 molar ratio to nickel. 50 mg/mL PVP was added and the solution was diluted with n-propanol to bring the total concentration of Ni(NO3 )2 to 0.21 M (taking the volume of PVP into account). Similar 0.21 M nickel solutions were made using ethanol, 2-ME and water. Solutions in 2-ME with CA in molar ratios CA:Ni of 2:1, 4:1 and 6:1 were also made. Finally, solutions in 2-ME containing 50, 70, or 100 mg/mL PVP were prepared. We also performed coaxial electrospinning for the preparation of hollow ceramic fibers. Two immiscible solutions were spun using two concentric needles. The outer solution was the 3YSZ precursor solution, the inner solution was a polymeric solution consisting of 200 mg/mL PEOT/PBT in a 30:70 v/v % solution of chloroform:HFIP. After spinning, the inner sacrificial polymer was removed by thermal annealing, as further explained below.
Nanomaterials 2017, 7, 16
12 of 15
3.3. Fabrication Parameters An electrospinning setup equipped with a 0.8 mm spinneret was used. The standard parameters for 3YSZ were as follows: precursor flow rate, 1 mL/h; voltage 15 kV; spinneret to collector distance, 20 cm; relative humidity, 30%; temperature, 25 ◦ C. We varied the flow rate from 0.05 to 1 mL/h and the voltage difference between the spinneret and collector plate from 5 kV to 25 kV. We kept the distance from the spinneret to the collector, humidity, and temperature constant to obtain and maintain a stable electrospinning process. In addition to the flat collector, we also used a grounded split electrode with an insulating gap between the electrode parts in order to obtain self-aligned fibers. The insulating gap varied from 2.0 to 7.5 cm width and the fibers were deposited on a silicon substrate. Instead of a split electrode we also used a rotating mandrel with a radius of 3 cm and a speed of 1000–4000 rpm to collect and orient the fibers. The annealing process was carried out in a convection oven at 850 ◦ C for 2 h using heating and cooling rates of 5 ◦ C/min. Samples were also annealed in a convection oven at 1 ◦ C/min, or in a microwave oven at 5 ◦ C/min, or by rapid thermal annealing. The rapid thermal annealing process involves placing the sample in a preheated microwave oven up to 850 ◦ C. The electrospinning parameters for the nickel oxide precursor solution were as follows: flow rate, 0.6 mL/h; voltage difference, 15 kV; spinneret to collector distance, 15 cm; relative humidity, 30%; temperature, 25 ◦ C. Coaxial spinning was performed using a spinneret from SpinBow. The inner needle had a diameter of 0.3 mm and the outer needle had a diameter of 0.8 mm. 3.4. Characterization Static viscosity measurements were performed using an AMVn microviscometer (Anton Paar, Graz, Austria) at 25 ◦ C, using a 3 mm capillary with matching 2.5 mm steel ball (1.4034 g/cm3 ) under an 80◦ angle. Dynamic viscosity measurements, performed on an Anton Paar Physica MCR 501 (Anton Paar, Graz, Austria), were done to prove the thinning behavior of the solutions at high shear rates. Conductivity measurements were performed using a home-made two-point probe, consisting of two parallel Pt wires inserted perpendicularly to a gap in an alumina tube. The wires were fixed with a Torr Seal® epoxy resin to prevent the solution to penetrate into the tube and ensure contact with the parallel region of the wires only. The probe was connected to an Autolab PGSTAT128N potentiostat/galvanostat (Metrohm Autolab, Utrecht, Netherlands). The data were collected using NOVA 1.9.16 software. A frequency sweep measurement was done between 10 kHz and 1 Hz with an amplitude of 10 mV. The solution was kept at 25 ◦ C. The conductivity was calibrated with standard KCl solutions with known conductivities [46–48]. Scanning electron microscope (SEM) pictures to investigate the microstructure were taken with a Merlin Scanning Electron Microscope (Carl Zeiss, Jena, Germany). Pictures of the electrospinning jet were taking utilizing a Nikon D500 camera (ISO 5000 and shutter speed of 1/200 s) (Nikon Nederland, Amsterdam, Netherlands) equipped with a Carl Zeiss 100 mm lens. The surface tension of the precursor solutions was measured with the pendent droplet method using a contact angle system OCA (DataPhysics Instruments GmbH, Filderstadt, Germany). The results were analyzed with SCA20 software (DataPhysics Instruments GmbH, Filderstadt, Germany). We quantified the alignment of the fibers with Fiji ImageJ software [49]. We used a Nikon Eclipse ME600 optical microscope (Nikon Nederland, Amsterdam, Netherlands) and scanning electron microscopy (SEM) for the electrically- and mechanically-aligned fibers. The directionality tool of Fiji ImageJ provides a histogram with a preferred orientation and dispersion (standard deviation) over 180◦ . We defined the degree of alignment as follows: Degree of alignment = 1 − dispersion/90
(2)
We measured the charge buildup of the electrically-driven alignment by monitoring the voltage between one of the ground electrodes and a platinum electrode at the center of the gap using a Keithley 197 Voltmeter. Phase analysis was done using powder X-ray diffraction (XRD) with a Bruker D2 Phaser
Nanomaterials 2017, 7, 16
13 of 15
(Cu Kα radiation λ = 0.15405 nm) (Bruker Nederland bv, Leiderdorp, Netherlands). Thermogravimetric analysis and differential scanning calorimetry were performed in a Netzsch STA 449 F3 Jupiter Thermal analyzer (Netzsch, Selb, Germany). The sample was heated with a rate of 5 ◦ C/min in air to 900 ◦ C. 4. Conclusions This study demonstrated that electrospinning allows the fabrication of dense and hollow ceramic fibers with controlled dimensions. The fiber diameter can be varied from hundreds of nanometers to more than a micrometer. The upper and lower limits to the fiber diameter are governed by the properties of the precursor solution used in the spinning process. Electrospinning also allows a considerable degree of control in the fabrication of arrays of aligned fibers and hollow fibers. A limitation of the technique appears to be that the inner and outer diameters of the hollow fiber cannot be modified independently. With respect to field-driven fiber alignment, there is a limit to the number of fibers that can be aligned, while the degree of alignment is intrinsically poorer when it is mechanically driven. Nevertheless, electrospinning has been proven to be a useful technique to produce ceramic nanofibers, with the possibility to control their microstructure and properties. It offers a unique combination of control over fiber structure at relatively high production rates, which makes it a promising tool to produce dedicated nanofiber materials with unique properties. Acknowledgments: The authors thank the ADEM Programme for financial support. Mathijs van Gorcum is thanked for carrying out the surface tension measurements. Author Contributions: Gerard Cadafalch Gazquez, Bernard A. Boukamp, Lorenzo Moroni and Johan E. ten Elshof conceived and designed the experiments; Gerard Cadafalch Gazquez, Vera Smulders, Sjoerd A. Veldhuis and Paul Wieringa performed the experiments; Gerard Cadafalch Gazquez and Johan E. ten Elshof wrote the paper. Conflicts of Interest: The authors declare no conflict of interest.
References 1. 2. 3. 4. 5.
6. 7. 8.
9. 10. 11.
Li, D.; McCann, J.T.; Xia, Y.; Marquez, M. Electrospinning: A Simple and Versatile Technique for Producing Ceramic Nanofibers and Nanotubes. J. Am. Ceram. Soc. 2006, 89, 1861–1869. [CrossRef] Wu, H.; Pan, W.; Lin, D.; Li, H. Electrospinning of Ceramic Nanofibers: Fabrication, assembly and applications. J. Adv. Ceram. 2012, 1, 2–23. [CrossRef] Kim, H.W.; Kim, H.E.; Knowles, J.C. Production and Potential of Bioactive Glass Nanofibers as a Next-Generation Biomaterial. Adv. Funct. Mater. 2006, 16, 1529–1535. [CrossRef] Vasita, R.; Katti, D.S. Nanofibers and Their Applications in Tissue Engineering. Int. J. Nanomed. 2006, 1, 15–30. [CrossRef] Pillay, V.; Dott, C.; Choonara, Y.E.; Tyagi, C.; Tomar, L.; Kumar, P.; du Toit, L.C.; Ndesendo, V.M.K. A Review of the Effect of Processing Variables on the Fabrication of Electrospun Nanofibers for Drug Delivery Applications. J. Nanomater. 2013, 2013, 789289. [CrossRef] Reneker, D.H.; Yarin, A.L.; Zussman, E.; Xu, H. Electrospinning of Nanofibers from Polymer Solutions and Melts. Adv. Appl. Mech. 2007, 41, 43–346. Teo, W.E.; Ramakrishna, S. A Review on Electrospinning Design and Nanofibre Assemblies. Nanotechnology 2006, 17, R89–R106. [CrossRef] [PubMed] Collins, G.; Federici, J.; Imura, Y.; Catalani, L.H. Charge Generation, Charge Transport, and Residual Charge in the Electrospinning of Polymers: A Review of Issues and Complications. J. Appl. Phys. 2012, 111, 044701. [CrossRef] Huang, Z.-M.; Zhang, Y.Z.; Kotaki, M.; Ramakrishna, S. A Review on Polymer Nanofibers by Electrospinning and Their Applications in Nanocomposites. Compos. Sci. Technol. 2003, 63, 2223–2253. [CrossRef] Agarwal, S.; Greiner, A.; Wendorff, J.H. Functional Materials by Electrospinning of Polymers. Prog. Polym. Sci. 2013, 38, 963–991. [CrossRef] Reneker, D.H.; Yarin, A.L.; Fong, H.; Koombhongse, S. Bending Instability of Electrically Charged Liquid Jets of Polymer Solutions in Electrospinning. J. Appl. Phys. 2000, 87, 4531–4547. [CrossRef]
Nanomaterials 2017, 7, 16
12. 13. 14. 15. 16. 17.
18. 19. 20. 21. 22. 23. 24. 25. 26. 27. 28. 29. 30.
31. 32. 33. 34. 35. 36. 37.
14 of 15
Yarin, A.L.; Koombhongse, S.; Reneker, D.H. Taylor Cone and Jetting from Liquid Droplets in Electrospinning of Nanofibers. J. Appl. Phys. 2001, 90, 4836–4846. [CrossRef] Lihua, L.; Yuris, A.D. Analysis of the Effects of the Residual Charge and Gap Size on Electrospun Nanofiber Alignment in a Gap Method. Nanotechnology 2008, 19, 355307. Kalayci, V.E.; Patra, P.K.; Kim, Y.K.; Ugbolue, S.C.; Warner, S.B. Charge Consequences in Electrospun Polyacrylonitrile (PAN) Nanofibers. Polymer 2005, 46, 7191–7200. [CrossRef] Li, D.; Wang, Y.; Xia, Y. Electrospinning of Polymeric and Ceramic Nanofibers as Uniaxially Aligned Arrays. Nano Lett. 2003, 3, 1167–1171. [CrossRef] Ramaseshan, R.; Sundarrajan, S.; Jose, R.; Ramakrishna, S. Nanostructured Ceramics by Electrospinning. J. Appl. Phys. 2007, 102, 111101. [CrossRef] Dai, Y.; Liu, W.; Formo, E.; Sun, Y.; Xia, Y. Ceramic Nanofibers Fabricated by Electrospinning and Their Applications in Catalysis, Environmental Science, and Energy Technology. Polym. Adv. Technol. 2011, 22, 326–338. [CrossRef] Jacobs, V.; Anandjiwala, R.D.; Maaza, M. The Influence of Electrospinning Parameters on the Structural Morphology and Diameter of Electrospun Nanofibers. J. Appl. Polym. Sci. 2010, 115, 3130–3136. [CrossRef] Tan, S.H.; Inai, R.; Kotaki, M.; Ramakrishna, S. Systematic Parameter Study for Ultra-Fine Fiber Fabrication via Electrospinning Process. Polymer 2005, 46, 6128–6134. [CrossRef] Pelofsky, A.H. Surface Tension-Viscosity Relation for Liquids. J. Chem. Eng. Data 1966, 11, 394–397. [CrossRef] Schonhorn, H. Surface Tension-Viscosity Relationship for Liquids. J. Chem. Eng. Data 1967, 12, 524–525. [CrossRef] Liu, Y.; He, J.-H.; Yu, J.-Y.; Zeng, H.-M. Controlling Numbers and Sizes of Beads in Electrospun Nanofibers. Polym. Int. 2008, 57, 632–636. [CrossRef] Feng, J.J. The Stretching of an Electrified Non-Newtonian Jet: A Model for Electrospinning. Phys. Fluids 2002, 14, 3912–3926. [CrossRef] Hohman, M.M.; Shin, M.; Rutledge, G.; Brenner, M.P. Electrospinning and Electrically Forced Jets. I. Stability Theory. Phys. Fluids 2001, 13, 2201–2220. Brinker, C.J.; Scherer, G.W. Sol-Gel Science: The Physics and Chemistry of Sol-Gel Processing; Academic Press: San Diego, CA, USA, 1990. Kiss, K.; Magder, J.; Vukasovich, M.S.; Lockhart, R.J. Ferroelectrics of Ultrafine Particle Size: I, Synthesis of Titanate Powders of Ultrafine Particle Size. J. Am. Ceram. Soc. 1966, 49, 291–295. [CrossRef] Stawski, T.M.; Veldhuis, S.A.; Göbel, O.F.; ten Elshof, J.E.; Blank, D.H.A. Effects of Reaction Medium on the Phase Synthesis and Particle Size Evolution of BaTiO3 . J. Am. Ceram. Soc. 2010, 93, 3443–3448. [CrossRef] Valero, M.; Tejedor, J.; Rodríguez, L.J. Encapsulation of Nabumetone by Means of -Drug: (β-Cyclodextrin)2 :Polyvinylpyrrolidone Ternary Complex Formation. J. Lumin. 2007, 126, 297–302. [CrossRef] Theron, S.A.; Zussman, E.; Yarin, A.L. Experimental Investigation of the Governing Parameters in the Electrospinning of Polymer Solutions. Polymer 2004, 45, 2017–2030. [CrossRef] Shenoy, S.L.; Bates, W.D.; Frisch, H.L.; Wnek, G.E. Role of Chain Entanglements on Fiber Formation during Electrospinning of Polymer Solutions: Good Solvent, Non-Specific Polymer–Polymer Interaction Limit. Polymer 2005, 46, 3372–3384. [CrossRef] Macdonald, T.J.; Xu, J.; Elmas, S.; Mange, Y.J.; Skinner, W.M.; Xu, H.; Nann, T. NiO Nanofibers as a Candidate for a Nanophotocathode. Nanomaterials 2014, 4, 256–266. [CrossRef] Ercolano, G.; Farina, F.; Cavaliere, S.; Jones, D.J.; Rozière, J. Nickel Based Electrospun Materials with Tuned Morphology and Composition. Nanomaterials 2016, 6, 236. [CrossRef] Thompson, C.J.; Chase, G.G.; Yarin, A.L.; Reneker, D.H. Effects of Parameters on Nanofiber Diameter Determined from Electrospinning Model. Polymer 2007, 48, 6913–6922. [CrossRef] Fridrikh, S.; Yu, J.; Brenner, M.; Rutledge, G. Controlling the Fiber Diameter during Electrospinning. Phys. Rev. Lett. 2003, 90, 144502. [CrossRef] [PubMed] Kappe, C.O.; Dallinger, D.; Murphree, S.S. Practical Microwave Synthesis for Organic Chemists: Strategies, Instruments, and Protocols; Wiley-VCH: Weinheim, Germany, 2009; pp. 1–299. Wang, J.; Binner, J.; Vaidhyanathan, B.; Joomun, N.; Kilner, J.; Dimitrakis, G.; Cross, T.E. Evidence for the Microwave Effect during Hybrid Sintering. J. Am. Ceram. Soc. 2006, 89, 1977–1984. [CrossRef] Xie, Z.; Yang, J.; Huang, X.; Huang, Y. Microwave Processing and Properties of Ceramics with Different Dielectric Loss. J. Eur. Ceram. Soc. 1999, 19, 381–387. [CrossRef]
Nanomaterials 2017, 7, 16
38.
39.
40. 41. 42. 43. 44.
45.
46.
47. 48. 49.
15 of 15
Bhaskar, A.; Chang, T.H.; Chang, H.Y.; Cheng, S.Y. Low-Temperature Crystallization of Sol–Gel-Derived Lead Zirconate Titanate Thin Films Using 2.45 GHz Microwaves. Thin Solid Films 2007, 515, 2891–2896. [CrossRef] Sundaresan, S.; Rao, M.; Tian, Y.; Schreifels, J.; Wood, M.; Jones, K.; Davydov, A. Comparison of Solid-State Microwave Annealing with Conventional Furnace Annealing of Ion-Implanted SiC. J. Electron. Mater. 2007, 36, 324–331. [CrossRef] Sundaresan, S.G.; Rao, M.V.; Tian, Y.-L.; Ridgway, M.C.; Schreifels, J.A.; Kopanski, J.J. Ultrahigh-Temperature Microwave Annealing of Al+ - And P+ -Implanted 4H-SiC. J. Appl. Phys. 2007, 101, 073708. [CrossRef] Goldstein, A.; Travitzky, N.; Singurindy, A.; Kravchik, M. Direct Microwave Sintering of Yttria-Stabilized Zirconia At 2.45 GHz. J. Eur. Ceram. Soc. 1999, 19, 2067–2072. [CrossRef] Veldhuis, S.A.; Brinks, P.; ten Elshof, J.E. Rapid densification of sol–gel derived yttria-stabilized zirconia thin films. Thin Solid Films 2015, 589, 503–507. [CrossRef] Wroe, R.; Rowley, A.T. Evidence for a Non-Thermal Microwave Effect in The Sintering of Partially Stabilized Zirconia. J. Mater. Sci. 1996, 31, 2019–2026. [CrossRef] Cadafalch Gazquez, G.; Lei, S.; George, A.; Gullapalli, H.; Boukamp, B.A.; Ajayan, P.M.; ten Elshof, J.E. Low-Cost, Large-Area, Facile, and Rapid Fabrication of Aligned ZnO Nanowire Device Arrays. ACS Appl. Mater. Interfaces 2016, 8, 13466–13471. [CrossRef] [PubMed] Chaurey, V.; Chiang, P.-C.; Polanco, C.; Su, Y.-H.; Chou, C.-F.; Swami, N.S. Interplay of Electrical Forces for Alignment of Sub-100 nm Electrospun Nanofibers on Insulator Gap Collectors. Langmuir 2010, 26, 19022–19026. [CrossRef] [PubMed] Wu, Y.C.; Koch, W.F.; Arvay, E.; Feng, D.; Holland, L.A.; Juhasz, E. A DC Method for the Absolute Determination of Conductivities of the Primary Standard KCl Solutions from 0 ◦ C to 50 ◦ C. J. Res. Natl. Inst. Stand. Technol. 1994, 99, 241–246. [CrossRef] Wu, Y.C.; Koch, W.F.; Pratt, K.W. Proposed New Electrolytic Conductivity Primary Standards for KCl Solutions. J. Res. Natl. Inst. Stand. Technol. 1991, 96, 191–201. [CrossRef] Pratt, K.W.; Koch, W.F.; Wu, Y.C.; Berezansky, P.A. Molality-Based Primary Standards of Electrolytic Conductivity. Pure Appl. Chem. 2001, 73, 1783–1793. [CrossRef] Schindelin, J.; Arganda-Carreras, I.; Frise, E.; Kaynig, V.; Longair, M.; Pietzsch, T.; Preibisch, S.; Rueden, C.; Saalfeld, S.; Schmid, B.; et al. Fiji: An Open-Source Platform for Biological-Image Analysis. Nature Methods 2012, 9, 676–682. [PubMed] © 2017 by the authors; licensee MDPI, Basel, Switzerland. This article is an open access article distributed under the terms and conditions of the Creative Commons Attribution (CC-BY) license (http://creativecommons.org/licenses/by/4.0/).