micromachines Article
Effect of Process Parameters on Flow Length and Flash Formation in Injection Moulding of High Aspect Ratio Polymeric Micro Features Abdelkhalik Eladl 1,2 , Rania Mostafa 2 , Aminul Islam 1 , Dario Loaldi 1 , Hassan Soltan 2 , Hans N. Hansen 1 and Guido Tosello 1, * ID 1
2
*
Department of Mechanical Engineering, Technical University of Denmark, Produktionstorvet, DTU Building 427A, DK-2800 Kongens Lyngby, Denmark;
[email protected] (A.E.);
[email protected] (A.I.);
[email protected] (D.L.);
[email protected] (H.N.H.) Faculty of Engineering, Production Engineering and Mechanical Design Department, Mansoura University, Elgomhouria St., Mansoura City 35516, Egypt;
[email protected] (R.M.);
[email protected] (H.S.) Correspondence:
[email protected]
Received: 14 December 2017; Accepted: 29 January 2018; Published: 31 January 2018
Abstract: This paper reports an investigation of the effects of process parameters on the quality characteristics of polymeric parts produced by micro injection moulding (µIM) with two different materials. Four injection moulding process parameters (injection velocity, holding pressure, melt temperature and mould temperature) were investigated using Polypropylene (PP) and Acrylonitrile Butadiene Styrene (ABS). Three key characteristics of the mouldings were evaluated with respect to process settings and the material employed: part mass, flow length and flash formation. The experimentation employs a test part with four micro fingers with different aspect ratios (from 21 up to 150) and was carried out according to the Design of Experiments (DOE) statistical technique. The results show that holding pressure and injection velocity are the most influential parameters on part mass with a direct effect for both materials. Both parameters have a similar effect on flow length for both PP and ABS at all aspect ratios and have higher effects as the feature thickness decreased below 300 µm. The study shows that for the investigated materials the injection speed and packing pressure were the most influential parameters for increasing the amount of flash formation, with relative effects consistent for both materials. Higher melt and mould temperatures settings were less influential parameters for increasing the flash amount when moulding with both materials. Of the two investigated materials, PP was the one exhibiting more flash formation as compared with ABS, when corresponding injection moulding parameters settings for both materials were considered. Keywords: micro injection moulding; design of experiments; part mass; flow length; flash formation
1. Introduction For the mass production of micro products, micro injection moulding (µIM) represents one of the most important manufacturing processes because it matches the capabilities of a low-cost process and the requirements of micro products, such as dimensions in the sub-millimetre range and low tolerances (in the order of few micrometres down to the sub-micrometre range). Components manufactured successfully by micro injection moulding find applications into the following main sectors: medical and biomedical, automotive industry, telecommunication area, IT components and aerospace. In all these applications, the replication of component micro features is a key issue which determines the reliability of the selected manufacturing route. Replication fidelity depends greatly on the feature size, aspect ratio and surface area. Quality characteristics in µIM are usually associated with the ability to completely fill the micro scale features in the mould cavity during processing. To improve the quality of injection moulded Micromachines 2018, 9, 58; doi:10.3390/mi9020058
www.mdpi.com/journal/micromachines
Micromachines 2018, 9, 58
2 of 19
micro components many research groups worldwide have investigated in recent years different factors affecting the replication capabilities of the process. In particular, this includes research in process optimization, material rheology, design and manufacture of tools and development of new tooling technologies [1]. Micro cantilevers are one of the key elements in micro sensors (e.g., biochemical sensors, calorimetry sensors, humidity sensors, accelerometers, atomic force microscopes, etc.) because they are sensitive to small changes in mass and temperature. Polymeric micro cantilever structures with high aspect ratios (i.e., the ratios between the length and thickness of a cantilever finger), can be fabricated by filling with polymer melt the micro cantilever/fingers cavities. While the cross-sectional area decreases, the flow length becomes increasingly limited because the melt cools and solidifies rapidly in the cavities. This is caused by the increased surface-to-volume ratio and is common for other micro scale parts. The filling process in micro injection moulding is more complex because of peculiar phenomena happening at the micro scale such as high heat transfer at the melt-mould wall interface, presence of wall slip, influence of surface tension, compressibility of the melt and pressure-dependent viscosity. All the aspects that have been reported are affecting µIM at levels that are different from those encountered in injection moulding of conventionally-sized components [2]. Many experimental and theoretical studies have been conducted to determine the most influential factors for improving filling performance in micro injection moulding. Most studies tried to find the relationship between the process parameters and the achievable filling length, or the replication quality. The main factors investigated by researchers have been: melt and mould temperature, injection velocity, hold pressure and holding time. Their direct effect on the melt flow property and flow status is proven in conventional injection moulding. The importance of those factors has been assessed for different applications, including microfluidic systems [3,4], micro channel moulding optimization [5–7], replication of micro ribs and micro features [8–20] and the effects of the processing parameters on micro cantilever using micro fingers dimensions as output response [1,2,21,22]. In literature, the filling mechanism of micro injection moulding appeared to be still not fully understood. The main conclusions from these studies show little agreement among them. In particular, there is a limited accordance with respect to which parameters have the most influence on the quality of the part. Each study has found a different set of significant parameters. This is probably due to the fact that different experimental investigations have employed tools with different mould design features (i.e., sprue and runner dimensions, gate design, cooling/heating layout, etc.) as well as different cavity geometry design. Further causes for limited agreement lie on the fact that different materials have been used. Therefore, the process windows employed are not only set at different levels but have different extensions, i.e., the same parameters investigated in different studies are varied within different intervals. Last but not least, also data treatment may have an influence, particularly for multi-variate analysis and in presence of interactions among parameters. For examples, in some of the studies found in literature, e.g., [1,6,7,9,11,21,22], research is carried out either by using the DOE technique or by using the one-factor-at-the-time approach to study the effect of a set of process parameters on a response. Nevertheless, a shared result among the recent research trends [3,11,17,19,21,22], indicates that one of the major factor influencing both process significance factors and the replication quality of micro injected components is the aspect ratio, intended as the height/length ratio, of the designed and replicated features. The purpose of this study is to improve the understanding of the behaviour of polymer melt filling through micro cantilever/fingers cavities and to study the correlation between flow length and flash formation using a unified DOE approach for both an amorphous polymer (Acrylonitrile Butadiene Styrene) and a semi-crystalline polymer (Polypropylene). Both materials could be moulded using the same process window, therefore allowing for an understanding of replication and flash formation behaviour related to the actual material properties. The experiments examined the effects of
Micromachines 2018, 9, 58
3 of 19
Micromachines 2018, 9, x FOR PEER REVIEW
3 of 19
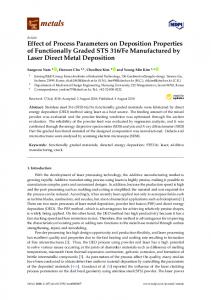
four process parameters and four different aspect ratioaspect 21, 30,ratio 50, 150 micro fingers with effects of four process parameters and four different 21, in 30,replicating 50, 150 in replicating micro both polymer materials using part mass, flow length and flash formation as part quality outputs fingers with both polymer materials using part mass, flow length and flash formation as part quality in order to identify which process parameters the mostare influential the during filling stage of thestage micro outputs in order to identify which process are parameters the most during influential the filling injection moulding process. of the micro injection moulding process. 2. Materials and Methods 2. Materials and Methods 2.1.2.1. Polymeric Materials Polymeric Materials Two commercially used in in conventional conventionalinjection injectionmoulding moulding (IM) Two commerciallyavailable availableunfilled unfilled materials materials used (IM) such as Polypropylene (PP,(PP, tradetrade namename 400-GA05), manufactured by INEOS Olefins Polymers Europe such as Polypropylene 400-GA05), manufactured by INEOS Olefins Polymers Europe UK) (London, UK) and Acrylonitrile Butadiene Styrene name Terluran GR35), (London, and Acrylonitrile Butadiene Styrene (ABS, trade (ABS, name trade Terluran GR35), manufactured manufactured by BASF (Ludwigshafen, Germany), were selected for the experiments. Figure 1 shows by BASF (Ludwigshafen, Germany), were selected for the experiments. Figure 1 shows the viscosity the viscosityand characteristics and pvT data (pressure, volume and for temperature) for the two characteristics pvT data (pressure, specific volumespecific and temperature) the two polymers. Each polymers. polymer wentdrying through dryingcycles and dehumidifying cycles before the polymer wentEach through desiccant anddesiccant dehumidifying before the injection moulding trials, injectionany moulding to remove any surface or absorbed moisture. to remove surfacetrials, or absorbed moisture. 10000
PP [240°C] PP [270°C] ABS [240°C]
1000
ABS [270°C]
Viscosity [ Pa.s]
100
10
1
1
10
100 1000 Shear rate [1/s]
10000
100000
(a) Viscosity characteristics
(b) pvT data Figure 1. (a) viscosity characteristics and (b) pvT data of the two polymers [23]. Figure 1. (a) viscosity characteristics and (b) pvT data of the two polymers [23].
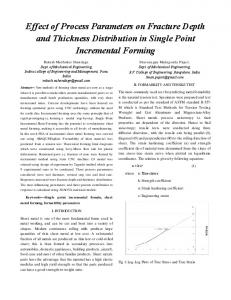
2.2. Part Geometry and Tooling The main body of the part had a rectangular shape (20 mm × 10 mm × 1.5 mm) with four cantilever/fingers. The four fingers had the same length, 15 mm, the same width, 3 mm and different thicknesses: 700 μm, 500 μm, 300 μm, 100 μm. Figure 2 illustrates all the dimensions of the Micromachinesmicro-fingers 2018, 9, 58 and the test structure. The main body adjoining the four cantilever/fingers had a depth 4 of 19 of 1.5 mm. This is where the melted polymer expanded after passing through the gate and homogenized before entering into the cantilevers. Four venting channels were placed at the end of each cantilever to improve air evacuation. The outside dimensions of the mould insert were 2.2. Part Geometry and Tooling 85 mm × 85 mm × 4 mm and the material was pre-hardened tool steel. A single open gate design was used. body The gate samehad depthaasrectangular the cross-sectional thickness of the×main reducing The main ofhad thethepart shape (20 mm 10 body, mm thus × 1.5 mm) with four the flow resistance and premature freeze-off of the gate. The test geometry was designed in such a cantilever/fingers. The four fingers had the same length, 15 mm, the same width, 3 mm and way that it facilitated a relatively simple measurement procedure of the moulded cantilevers thus different thicknesses: 700source µm, coming 500 µm, µm, 100strategy. µm. Figure 2 illustrates all the dimensions reducing any error from300 the measuring of the micro-fingers and the test structure. The main body four cantilever/fingers had A high-speed precision milling process was used to adjoining generate thethe cavities. Afterwards, a polishing was appliedthe to the cavity walls in order to obtain a surface roughnessthrough in the range a depth of 1.5 mm.process This is where melted polymer expanded after passing the gate and of 40–110 nm (see Figure 2). Such level of roughness ensured that the polymer flow was not affected homogenized before entering into the cantilevers. Four venting channels were placed at the end of by the presence of surface topography, even for very thin cavities as in the case of the cantilevers each cantilever to improve air evacuation. outside of the insert were considered in this study. Recent studiesThe on the effect ofdimensions surface roughness onmould the polymer flow on 85 mm × have shown that mould surface topography the flow length the was used. 85 mm × 4micro mm cavities and the material wasthe pre-hardened tool steel.affects A single open gatewhen design average surface roughness in in the range of 500 nm to 10 μm for thicknesses of 50 μm, 100 μm, The gate had the same depth as the cross-sectional thickness of the main body, thus reducing the flow 200 μm, 250 μm, 1000 μm, corresponding to a roughness-to-thickness ratio of 0.25% up to 4.0% resistance and premature freeze-off the roughness gate. Theintest geometry designed a way that it [24–26]. On the contrary, mould of surface the range betweenwas 40 nm and 170 nmin onsuch cavities facilitated awith relatively measurement procedure the moulded thus reducing any thicknesssimple in the range between 250 μm to 1000 μm,ofcorresponding to acantilevers roughness-to-thickness of 0.01% up to 0.02% has shown to have no influence and no statistical significance on the error sourceratio coming from the measuring strategy. polymer flow length [25,26].
(a) CAD model of part
(b) Part and micro cantilever dimensions
(d) Surface topography (e) Surface topography of 700 μm measurements on cantilever thick cantilever cavity (Pos. A) Micromachines 2018, 9, x FOR PEER REVIEW mould cavities
(c) Mould insert
(f) Surface topography of 500 μm thick cantilever cavity (Pos. B) 5 of 19
Average surface roughness measurement results on Pos. A, B, C, D (thickness = 100, 300, 500, 700 μm respectively) (*) Sa (Pos. A) = 76 ± 10 nm Sa (Pos. B) = 94 ± 10 nm Sa (Pos. C) = 113 ± 11 nm Sa (Pos. D) = 43 ± 10 nm
(g) Surface topography of 300 μm thick cantilever cavity (Pos. C)
(h) Surface topography of 100 μm thick cantilever cavity (Pos. D)
Figure 2. Model, dimensions, mould insert, cavity surface topographies and roughness of the micro
Figure 2. Model, mould insert,area cavity topographies and roughness of the micro finger dimensions, test structure. Surface scanning = 644surface μm × 644 μm (4096 × 4096 pixels), acquisitions obtained with laser confocal microscope apertureacquisitions = finger test structure. Surface scanning area using = 644a 20× µmmagnification × 644 µm objective (4096 ×(numerical 4096 pixels), 0.60). (*) Interval indicates estimated measurement uncertainty including repeatability, resolution and obtained with laser confocal microscope using a 20× magnification objective (numerical aperture = 0.60). instrument calibration. (*) Interval indicates estimated measurement uncertainty including repeatability, resolution and instrument calibration. 2.3. Experimentation Injection moulding experiments were carried out on an Arburg (Loßburg, Germany) Allrounder 370A injection moulding machine which has a maximum clamping force of 600 KN and a screw diameter of 18 mm. The investigated parameters were injection velocity (Vi), holding pressure (Ph), melt temperature (Tb) and mould temperature (Tm). These parameters were considered as factors affecting the optimization of the micro injection moulding process. The criteria used for selecting the maximum and minimum values of these process parameters took into account the equipment
Micromachines 2018, 9, 58
5 of 19
A high-speed precision milling process was used to generate the cavities. Afterwards, a polishing process was applied to the cavity walls in order to obtain a surface roughness in the range of 40–110 nm (see Figure 2). Such level of roughness ensured that the polymer flow was not affected by the presence of surface topography, even for very thin cavities as in the case of the cantilevers considered in this study. Recent studies on the effect of surface roughness on the polymer flow on micro cavities have shown that the mould surface topography affects the flow length when the average surface roughness in in the range of 500 nm to 10 µm for thicknesses of 50 µm, 100 µm, 200 µm, 250 µm, 1000 µm, corresponding to a roughness-to-thickness ratio of 0.25% up to 4.0% [24–26]. On the contrary, mould surface roughness in the range between 40 nm and 170 nm on cavities with thickness in the range between 250 µm to 1000 µm, corresponding to a roughness-to-thickness ratio of 0.01% up to 0.02% has shown to have no influence and no statistical significance on the polymer flow length [25,26]. 2.3. Experimentation Injection moulding experiments were carried out on an Arburg (Loßburg, Germany) Allrounder 370A injection moulding machine which has a maximum clamping force of 600 KN and a screw diameter of 18 mm. The investigated parameters were injection velocity (Vi ), holding pressure (Ph ), melt temperature (Tb ) and mould temperature (Tm ). These parameters were considered as factors affecting the optimization of the micro injection moulding process. The criteria used for selecting the maximum and minimum values of these process parameters took into account the equipment characteristics, process feasibility and materials characteristics. The process parameters levels were as follows:
•
Melt temperature: -
•
Mould temperature: -
•
(Min) 20 ◦ C was the lowest temperature allowing micro finger replication and complete filling of the cavity. (Max) 60 ◦ C was selected as the highest melt temperature following the recommendation of the material supplier, in order to allow successful demoulding of the part from the cavity.
Holding pressure: -
•
(Min) 240 ◦ C was selected as the lowest melt temperature following the recommendation of the material supplier. (Max) 270 ◦ C was selected as the highest melt temperature following the recommendation of the material supplier.
(Min) 10 MPa for PP materials and 20 MPa for ABS materials, which provided acceptable shrinkage compensation and dimensional accuracy. (Max) 60 MPa for PP materials and 70 MPa for ABS materials were the maximum values allowing automatic demoulding without distortion.
Injection velocity: -
(Min) 140 mm/s was selected based on experimentation. This was the minimum injection speed that allowed the part to fill completely. (Max) 220 mm/s was selected based on experimentation. This was the highest injection speed at which a continuous injection moulding process could be achieved.
Micromachines 2018, 9, 58
6 of 19
The design of experiment (DOE) approach was applied to assess the effects of four parameters, each varying between a maximum and minimum value. This approach allowed all investigated process parameters to be taken into account simultaneously, in assessing their main effects. In this way, it was possible to systematically investigate process and/or product related variables that influenced the product and/or process quality, respectively. In particular, process conditions and part characteristics that affect product quality and cost could be identified, in order to improve the product manufacturability, quality, reliability and production quantities [27]. Factorial design is frequently used in experiments involving several factors and when it is necessary to study the factors main effects and interactions on various responses. Two different approaches can be distinguished when implementing DOE studies: full-factorial design, widely used when it is necessary to investigate the joint effects of several factors on a response and fractional factorial designs that are applied to reduce experimental efforts of large DOE studies, mostly for screening purposes. In this research, a two-level four-factor full-factorial design with resolution V (24 ) was applied, scheduling 16 treatments, which were carried out as shown in Table 1. The 16 treatments were executed following a randomly ordered succession. For each run, the machine was run to firstly complete 50 continuous cycles in order to stabilize the process, then the following 21 parts were collected and numbered for subsequent inspection. Figure 3 shows a photograph of the 21 moulded samples from one of the DOE settings that were used for the analyses. Given that two different materials were considered, two DOE full-factorial designs with resolution V (24 ) were applied for both materials. In addition, 21 trials were performed for each combination of controlled parameters. Thus, in total 21 × 16 × 2 = 672 experimental trials were carried out. The mass of each moulded part and the runner mass were measured using a sensitive scale with a resolution of 0.01 mg and the averages of the measured masses were recorded and analysed. The flow lengths were measured for the different aspect ratio features using an optical quality control CNC coordinate measuring machine (CMM) having a resolution of 0.5 µm and an accuracy 4 µm. Table 1. Two-level four-factor full-factorial design. Standard Order 1 2 3 4 5 6 7 8 9 10 11 12 13 14 15 16
Vi
−(140 mm/s) +(220 mm/s) −(140 mm/s) +(220 mm/s) −(140 mm/s) +(220 mm/s) −(140 mm/s) +(220 mm/s) −(140 mm/s) +(220 mm/s) −(140 mm/s) +(220 mm/s) −(140 mm/s) +(220 mm/s) −(140 mm/s) +(220 mm/s)
Ph (PP/ABS)
−(10/20 MPa) −(10/20 MPa) +(60/70 MPa) +(60/70 MPa) −(10/20 MPa) −(10/20 MPa) +(60/70 MPa) +(60/70 MPa) −(10/20 MPa) −(10/20 MPa) +(60/70 MPa) +(60/70 MPa) −(10/20 MPa) −(10/20 MPa) +(60/70 MPa) +(60/70 MPa)
Tb
Tm ◦ C)
−(240 −(240 ◦ C) −(240 ◦ C) −(240 ◦ C) +(270 ◦ C) +(270 ◦ C) +(270 ◦ C) +(270 ◦ C) −(240 ◦ C) −(240 ◦ C) −(240 ◦ C) - (240 ◦ C) +(270 ◦ C) +(270 ◦ C) +(270 ◦ C) +(270 ◦ C)
−(240 ◦ C) −(240 ◦ C) −(240 ◦ C) −(240 ◦ C) −(240 ◦ C) −(240 ◦ C) −(240 ◦ C) −(240 ◦ C) +(270 ◦ C) +(270 ◦ C) +(270 ◦ C) +(270 ◦ C) +(270 ◦ C) +(270 ◦ C) +(270 ◦ C) +(270 ◦ C)
Micromachines 2018, 9, 58
7 of 19
Micromachines 2018, 9, x FOR PEER REVIEW
7 of 19
Figure 3. 21 moulded samples from one DOE configuration. Figure 3. 21 moulded samples from one DOE configuration.
3. Analysis of the Results 3. Analysis of the Results 3.1. Factors Affecting Part Mass 3.1. Factors Affecting Part Mass Complete mould filling and process stability are among the most important quality criteria for Complete mould filling and process stability are among the most important quality criteria for process quality assessment and are here represented by part mass. Figure 4 shows the effect of process process quality assessment and are here represented by part mass. Figure 4 shows the effect of process parameters in the 16 DOE combinations on average part mass for both materials. It shows that the parameters in the 16 DOE combinations on average part mass for both materials. It shows that the average mass of both materials had the same trends across the 16 treatments. Maximum mass for average mass of both materials had the same trends across the 16 treatments. Maximum mass for both materials was obtained at treatments 4, 8, 12, 16 which had a high level of processing parameters. both materials was obtained at treatments 4, 8, 12, 16 which had a high level of processing parameters. On the other hand, minimum mass for both materials was obtained at 1, 5, 9 and 13, which had a low On the other hand, minimum mass for both materials was obtained at 1, 5, 9 and 13, which had a low level of the processing parameters. ABS materials yielded a larger mass than PP materials for all the level of the processing parameters. ABS materials yielded a larger mass than PP materials for all the 16 treatments due to the difference in specific volume, as clearly indicated by the pvT plot represented 16 treatments due to the difference in specific volume, as clearly indicated by the pvT plot represented in Figure 1b. in Figure 1b. Figure 5 shows the Pareto charts of the standardized effect on the average mass for ABS Figure 5 shows the Pareto charts of the standardized effect on the average mass for ABS (Figure 5a) (Figure 5a) and PP (Figure 5b) considering a significance of α = 0.05. The effect of holding pressure and PP (Figure 5b) considering a significance of α = 0.05. The effect of holding pressure was the larger was the larger on the results for both materials. A remarkable effect was given also by injection on the results for both materials. A remarkable effect was given also by injection velocity and its velocity and its second order interaction with holding pressure, also common to both materials. In second order interaction with holding pressure, also common to both materials. In Figure 6 are also Figure 6 are also represented the main effect plots corresponding to part mass as responses for ABS represented the main effect plots corresponding to part mass as responses for ABS and PP materials and PP materials respectively. The effect of holding pressure on part mass was expected, since respectively. The effect of holding pressure on part mass was expected, since increasing the holding increasing the holding pressure allowed for more material to fill the mould cavity and to compensate pressure allowed for more material to fill the mould cavity and to compensate for shrinkage before for shrinkage before complete freezing, hence increasing its mass. complete freezing, hence increasing its mass. Increased injection velocity was shown to be a source of increasing part mass. This is due to the Increased injection velocity was shown to be a source of increasing part mass. This is due to the fact that higher velocity led to an increase in shear rate, which in turn decreased the viscosity of the fact that higher velocity led to an increase in shear rate, which in turn decreased the viscosity of the polymer and allows for improved flow inside the mould cavity. Furthermore, higher injection polymer and allows for improved flow inside the mould cavity. Furthermore, higher injection velocity velocity implied higher maximum injection pressure, which increased the quantity of material implied higher maximum injection pressure, which increased the quantity of material injected due to injected due to material compressibility (also visible in the pvT plot represented in Figure 1b). material compressibility (also visible in the pvT plot represented in Figure 1b).
Micromachines 2018, 9, 58 Micromachines 2018, 9, x FOR PEER REVIEW Micromachines 2018, 9, x FOR PEER REVIEW
8 of 19 8 of 19 8 of 19
Figure 4. 4. Average each experimental runrun for for bothboth materials ABS ABS and PP. 1: error Figure Averagepart partmass massforfor each experimental materials andNote PP. Note 1: Figure 4. Average part mass for each experimental run for both materials ABS and PP. Note 1: error bars on histograms indicate standard deviation (SD). Note 2: Coefficient of Variation COV% error bars on histograms indicate standard deviation (SD). Note 2: Coefficient of Variation= bars on histograms indicate standard deviation (SD). Note 2: Coefficient of Variation COV% = average/SD·100. COV% = average/SD × 100%. average/SD·100.
For these reasons, the effect of injection velocity on the average mass was an increase of 3.6% For ofof injection velocity on on thethe average mass waswas an increase of 3.6% and Forthese thesereasons, reasons,the theeffect effect injection velocity average mass an increase of 3.6% and 3.3% for ABS and PP parts respectively. 3.3% for ABS and PP parts respectively. and 3.3% for ABS and PP parts respectively. Higher process settings resulted on higher repeatability with the same trends and dependency Higher Higher process process settings settings resulted resulted on onhigher higher repeatability repeatability with with the the same same trends trendsand anddependency dependency on the four parameters for both materials. A low level of injection velocity also reduced the process on onthe thefour fourparameters parametersfor forboth bothmaterials. materials. A A low low level level of ofinjection injectionvelocity velocity also also reduced reducedthe theprocess process stability. In Figure 6c and especially Figure 6d the main effects plots of the measured mass samples stability. stability.In InFigure Figure6c 6cand andespecially especiallyFigure Figure6d 6dthe themain maineffects effectsplots plotsof ofthe themeasured measuredmass masssamples samples show that the process standard deviation is reduced from 1.4 mg to 0.2 mg for PP and from 0.4 mg to show deviation is is reduced reducedfrom from1.4 1.4mg mgtoto0.2 0.2mg mgfor forPP PPand andfrom from mg show that that the the process process standard standard deviation 0.40.4 mg to 0.3 mg in the case of ABS. Optimal process conditions could lead to a relative standard deviation (i.e. to 0.3 mg in the case of ABS. Optimal process conditions could lead to a relative standard deviation 0.3 mg in the case of ABS. Optimal process conditions could lead to a relative standard deviation (i.e. coefficient of variation = average/standard deviation) of 0.1% or below, as shown in Figure 6 e,f. (i.e., coefficient of variation = average/standard deviation) of 0.1% or below, as shown in Figure coefficient of variation = average/standard deviation) of 0.1% or below, as shown in Figure 6 e,f.6e,f. Term Term B AB A AB AB C BCC BC AC AC CD CD BD BD AD AD D D
2.57 2.57
Factor Name Name AFactor Inj V [mm/s] BA CB C D D
0 2 4 6 8 10 0 2 4 6 Effect 8 10 Standardized Standardized Effect
Inj V [mm/s] Holding P [MPa] Holding P [MPa] Melt T [°C] Melt T T[°C] Mould [°C] Mould T [°C]
Term Term B AB A AB AB BC BC AC AC C BDC BD AD AD CD CD D D
2.57 2.57
Factor Name Name AFactor Inj V [mm/s]
BA CB C D D
0 1 2 3 4 5 0 1 2 3 Effect 4 5 Standardized Standardized Effect
Inj V [mm/s] Holding P [MPa] Holding P [MPa] Melt T [°C] Melt T T[°C] Mould [°C] Mould T [°C]
(a) (b) (a) (b) Figure 5. Pareto chart of the Standardized Effects for ABS (a) and PP (b), on average Part Mass (α = 0.05). Figure 5. 5. Pareto of of thethe Standardized Effects for ABS and(a) PPand (b), on MassPart (α = 0.05). Figure Paretochart chart Standardized Effects for(a) ABS PPaverage (b), on Part average Mass (α = 0.05).
Micromachines 2018, 9, 58
9 of 19
Micromachines 2018, 9, x FOR PEER REVIEW
9 of 19
0.38
0.37 Av.
0.37
0.38
0.38
0.36
0.36
0.36
Part mass [g]
0.34
0.34
0.34
0.34
0.32
0.32 0.31 Av.
0.30
0.30 140
20 70 Packing P [MPa]
220
Inj V [mm/s]
Part mass St. Dev. [mg]
1.5
1.0
1.0
0.5
0.5
0.37
0.37
0.0
140 220 Inj V [mm/s]
0.0
20 70 Packing P [MPa]
10 60 Holding P [MPa]
0.31
240 270 Melt T [°C]
20 60 Mould T [°C]
(b) PP mass average
1.5
1.0 0.81
0.81
0.81
0.5
0.37
240 270 Melt T [°C]
20 60 Mould T [°C]
0.0
140 220 Inj V [mm/s]
10 60 Holding P [MPa]
(c) ABS mass SD
0.75%
240 270 Melt T [°C]
20 60 Mould T [°C]
(d) PP mass SD 0.75%
0.50%
0.50%
0.50%
0.25% 0.10%
0.00%
0.31
0.30
2.0
2.0
1.5
0.32
140 220 Inj V [mm/s]
20 60 Mould T [°C]
(a) ABS mass average
2.0
C.o.V. on Part Mass [%]
240 270 Melt T [°C]
C.o.V. on Part Mass [%]
Part mass [g]
0.36
Part mass St. Dev. [mg]
0.38 0.37
0.50%
0.50%
0.27% 0.25%
0.27%
0.27%
0.10%
140 220 Inj V [mm/s]
20 70 240 270 Packing P [MPa] Melt T [°C]
(e) ABS mass COV [%]
20 60 Mould T [°C]
0.00%
140 220 Inj V [mm/s]
10 60 Holding P [MPa]
240 270 Melt T [°C]
20 60 Mould T [°C]
(f) PP mass COV [%]
Figure 6. Main effects plot of: average part mass for ABS (a) and PP (b), standard deviation of part Figure 6. Main effects plot of: average part mass for ABS (a) and PP (b), standard deviation of part mass for ABS ABS (c) (c) and and PP PP (d), (d), coefficient coefficient of of variation variation for for ABS ABS (e) (e) and and PP PP(f). (f). mass for
3.2. Factors Affecting Finger Filling Flow Length 3.2. Factors Affecting Finger Filling Flow Length Flow length is one of the most important quality criteria in injection moulding and it is Flow length is one of the most important quality criteria in injection moulding and it is particularly particularly critical with micro scale geometries with thin walls and high aspect ratios. Flow length critical with micro scale geometries with thin walls and high aspect ratios. Flow length was used in was used in this research to evaluate the filling capacity of the moulding system, especially with this research to evaluate the filling capacity of the moulding system, especially with respect to the respect to the aspect ratio (A/R), i.e. the ratio between the length of the finger and its thickness. The aspect ratio (A/R), i.e., the ratio between the length of the finger and its thickness. The different aspect different aspect ratios studied were 21, 30, 50 and 150 respectively. Figures 7 and 8 show a histogram ratios studied were 21, 30, 50 and 150 respectively. Figures 7 and 8 show a histogram chart of the four chart of the four fingers average filled length in each experimental run for ABS and PP respectively. fingers average filled length in each experimental run for ABS and PP respectively. Figure 9 shows the Figure 9 shows the main effect plots for filled lengths with respect to processing parameters and main effect plots for filled lengths with respect to processing parameters and fingers thickness for both fingers thickness for both ABS and PP materials. ABS and PP materials. From Figures 7 and 8 it can be seen that the length of finger No. 1 (thickness = 700 μm) and finger From Figures 7 and 8 it can be seen that the length of finger No. 1 (thickness = 700 µm) and No. 2 (thickness = 500 μm) was approximately the same for the both polymer materials ABS and PP. finger No. 2 (thickness = 500 µm) was approximately the same for the both polymer materials However, there are clearly differences in finger No. 3 (thickness = 300 μm) length especially in ABS and PP. However, there are clearly differences in finger No. 3 (thickness = 300 µm) length treatments 1, 5, 9 and 13 where holding pressure and injection velocity were at the minimum level: especially in treatments 1, 5, 9 and 13 where holding pressure and injection velocity were at the the finger length was very short compared to finger No. 1 and finger No. 2 for the same treatments, minimum level: the finger length was very short compared to finger No. 1 and finger No. 2 for the for both polymer materials ABS and PP. In addition, for ABS in treatment 2 and 10, where holding same treatments, for both polymer materials ABS and PP. In addition, for ABS in treatment 2 and pressure and melt temperature were at the minimum level the finger length is shorter compared to 10, where holding pressure and melt temperature were at the minimum level the finger length is finger No. 1 and finger No. 2 for the same treatments. For finger number 4 (thickness = 100 μm), the shorter compared to finger No. 1 and finger No. 2 for the same treatments. For finger number 4 polymer flow was in fact obstructed so the finger length was very short for all 16 treatments, as shown (thickness = 100 µm), the polymer flow was in fact obstructed so the finger length was very short for in Figures 7 and 8: the maximum flow length was approximately 5.5 mm (A/R = 55). Figures 7 and 8 all 16 treatments, as shown in Figures 7 and 8: the maximum flow length was approximately 5.5 mm show also that PP yielded a flow length longer than with ABS; this was due to the different viscosities, (A/R = 55). Figures 7 and 8 show also that PP yielded a flow length longer than with ABS; this was particularly at higher processing temperatures. These observations are summarized in Figure 9, due to the different viscosities, particularly at higher processing temperatures. These observations where Pareto charts show the significant factors for all the treatments, considering also the finger thickness and the materials. In particular, the finger thickness is the parameter with the highest effect
Micromachines 2018, 9, 58
10 of 19
are summarized Figure 9,REVIEW where Micromachines 2018, 9,in x FOR PEER
Pareto charts show the significant factors for all the treatments, 10 of 19 considering also the finger thickness and the materials. In particular, the finger thickness is the parameter with(case the highest effect (case (a) 100 µm and 300 µm), for thin fingers (a) = 100 μm for andthin 300 fingers μm), whereas for= thick fingers (case (b) =whereas 500 μmfor andthick 700 fingersthe (case (b) = 500 µmlower and 700 µm),than the thickness lower effect than injection moulding process μm), thickness had effect injection had moulding process parameters such as holding pressure, injection and melt temperature. The and fact that parameterThe ‘Material’ had low effect parameters such asspeed holding pressure, injection speed meltthe temperature. fact that thea parameter means that thea low two effect materials have statistically similar behaviour as far as thebehaviour flow length is ‘Material’ had means thatathe two materials have a statistically similar as far concerned. This is is particularly thicker fingers, ‘Material’ waswhere the parameter as the flow length concerned.true Thisfor is particularly truewhere for thicker fingers, ‘Material’with was the the lowest effect (seethe Figure 9b). parameter with lowest effect (see Figure 9b). When the main main effects effects are are considered, considered, for for finger finger No. No. 11 (thickness (thickness == 700 700 µm, μm, A/R A/R == 21) When the 21) no no parameters had the finger finger length length than than another, another, for for either either material; material; finger parameters had any any more more influence influence on on the finger length processing parameters, length increased increased with with the the increase increase of of all all processing parameters, as as shown shown on on the the main main effect effect plot plot in in Figure 10a,b. This No. 11 is Figure 10a,b. This was was due due to to the the fact fact that that thickness thickness of of finger finger No. is relatively relatively high high so so the the polymers polymers could easily along along its its whole whole length. length. could flow flow easily
Figure flowflow length of ABS the four fingers each DOE run. Note 1: error Figure 7.7.Average Average length ofon ABS on the fourforfingers for experimental each DOE experimental run. bars on histograms indicate standard deviation (SD). Note 2: Coefficient of Variation COV% = Note 1: error bars on histograms indicate standard deviation (SD). Note 2: Coefficient of Variation average/SD × 100%. × 100%. COV% = average/SD
With decreasing finger thickness, as in finger No. 2 (thickness = 500 μm, A/R = 30), the polymer With decreasing finger thickness, as in finger No. 2 (thickness = 500 µm, A/R = 30), the polymer flow became more difficult and a significant effect of process parameters appear. Holding pressure flow became more difficult and a significant effect of process parameters appear. Holding pressure followed by injection velocity were the most influential parameters increasing finger length, for both followed by injection velocity were the most influential parameters increasing finger length, for both materials, as shown in Figure 10c,d. The holding pressure applied at a switch over point before the materials, as shown in Figure 10c,d. The holding pressure applied at a switch over point before the no-flow temperature is reached allowed more material to fill the mould cavity before complete no-flow temperature is reached allowed more material to fill the mould cavity before complete freezing freezing of the melt. Furthermore, increasing velocity led to an increase in shear rate, which in turn of the melt. Furthermore, increasing velocity led to an increase in shear rate, which in turn decreased decreased the viscosity of the polymer due to shear thinning, increasing the flow inside the mould the viscosity of the polymer due to shear thinning, increasing the flow inside the mould cavity. With a cavity. With a further decrease in finger thickness, as in finger No. 3 (thickness = 300 μm, A/R = 50), further decrease in finger thickness, as in finger No. 3 (thickness = 300 µm, A/R = 50), the flow of the flow of polymer became more critical and therefore the optimal processing window was reduced. polymer became more critical and therefore the optimal processing window was reduced. Specific Specific processing parameters must be set, particularly with materials having higher viscosity, as for processing parameters must be set, particularly with materials having higher viscosity, as for ABS in ABS in this case. For the ABS material, holding pressure, injection velocity and melt temperature this case. For the ABS material, holding pressure, injection velocity and melt temperature were the were the most influential parameters increasing finger No. 3 length, as shown in Figure 10e. The effect most influential parameters increasing finger No. 3 length, as shown in Figure 10e. The effect of melt of melt temperature is caused by the different viscosity characteristics of ABS at 270 °C (see Figure temperature is caused by the different viscosity characteristics of ABS at 270 ◦ C (see Figure 1a): higher 1a): higher temperature decreased the viscosity and allowed the polymer to flow into the thinner features. For PP, which has a lower viscosity, holding pressure followed by injection velocity were the most influential parameters that increased finger length, as shown in Figure 10f. PP could flow in average 1.1 mm longer than ABS across the whole DOE, corresponding to a 10.0% longer flow length.
Micromachines 2018, 9, 58
11 of 19
temperature decreased the viscosity and allowed the polymer to flow into the thinner features. For PP, which has a lower viscosity, holding pressure followed by injection velocity were the most influential parameters2018, that9,increased length, as shown in Figure 10f. PP could flow in average 1.1 mm Micromachines x FOR PEERfinger REVIEW 11 of 19 longer than ABS across the whole DOE, corresponding to a 10.0% longer flow length. For finger No. 4, Micromachines 2018, 9, x FOR PEER REVIEW 11 of 19 For finger No. 4, (thickness = 100A/R μm = thickness, 150), the flow length was short for both polymer (thickness = 100 µm thickness, 150), the A/R flow=length was short for both polymer materials and materials and the maximum achieved aspect ratio was in average 15 for ABS and 32 for PP. The flow theFor maximum aspect was in average 15 for 32was for short PP. The flowpolymer inside the finger No.achieved 4, (thickness = 100ratio μm thickness, A/R = 150), theABS flow and length for both inside the very thin finger was very limited, especially for ABS, which has a higher viscosity. Holding very thin finger was very limited, especially for ABS, which has a higher viscosity. Holding pressure, materials and the maximum achieved aspect ratio was in average 15 for ABS and 32 for PP. The flow pressure, injection velocity and melt temperature were the most influential parameters increasing injection velocity andfinger melt was temperature wereespecially the mostfor influential parameters increasing No. 4 inside the very thin very limited, ABS, which has a higher viscosity.finger Holding finger No. 4injection length ABS and as shown in respectively. Figure respectively. average could flow length for ABS and for PP as shown inmelt Figure 10g,h In average PP In could flow PP 1.7 mm longer pressure, velocity andPP temperature were10g,h the most influential parameters increasing 1.7 mm longer than across the DOE, to flow a 112% longer flowPP length. finger No. 4 length for ABS and PPwhole as shown in corresponding Figure 10g,h respectively. In average could flow than ABS across theABS whole DOE, corresponding to a 112% longer length. experiments have demonstrated that for finger thicknesses 500 μm and above both 1.7The mmexperiments longer than ABS across the whole DOE, to aof 112% longer length. The have demonstrated that for corresponding finger thicknesses 500of µm andflow above both materials Thecould experiments have demonstrated for finger thicknesses of 500 μm and above materials the same flow length that inwithin average the experimental process variability. could reach the reach same flow length in average thewithin experimental process variability. Forboth finger materials could the300 same length in PP average within the experimental variability. For finger thicknesses of μmflow and below, could flow longer than ABSprocess with an increasing thicknesses of 300 reach µm and below, PP could flow longer than ABS with an increasing performance over For finger thicknesses of 300 μm and below, PP could flow longer than ABS with an increasing performance over ABS for increasingly thinner cavities. ABS for increasingly thinner cavities. performance over ABS for increasingly thinner cavities.
Figure 8. Average flowlength lengthofofPP PPon onthe the four four fingers fingers for DOE experimental run. Note 1: error Figure for each each DOEDOE experimental run. Note error1: Figure 8. 8.Average Averageflow flow length of PP on the four fingers for each experimental run. 1: Note bars on histograms indicate standard deviation (SD). Note 2: Coefficient of Variation COV% = = bars on histograms indicate standard deviation (SD). Note 2: Coefficient of Variation COV% error bars on histograms indicate standard deviation (SD). Note 2: Coefficient of Variation average/SD·× 100%. average/SD·× 100%. × 100%. COV% = average/SD Term 2.02 Term F2.02 B F A B AB A BF AB AF BF E AF C E BC C BE BC D BE AE D CF AE BD CF EF BD DF EF CE DF CD CE AC CD DE AC AD DE 0 5 AD
0
Factor Factor A AB BC CD DE EF
F
10
15
20
Standardized 5 10 15 Effect 20
Standardized Effect
Name Name Inj V Inj V Holding P Holding Melt T P Melt T T Mould Material Mould T Finger Thickness Material
Finger Thickness
Term
Term B ABB A AB AC BCA AC C BC F AFC BFF AF BD BF AD BD D CF AD CD D EF CF BE CD AE EF CE BE DE AE DF CE E DE DF 0 E
0
2.01
2.01
Factor Name
A Factor InjName V Inj V P BA Holding Holding P CB Melt T Melt TT DC Mould ED Material Mould T Finger Thickness FE Material
F
1
2
3
4
5
6
Standardized Effect 1 2 3 4 5 6
Finger Thickness
7
Standardized Effect
7
(a) (b) (a) (b) Figure 9. Pareto chart of the Standardized Effects for short Finger Thickness (100–300 μm) (a) and Figure 9. Pareto chart of the Standardized Effects for short Finger Thickness (100–300 µm) (a) and long long Finger Thickness μm) (b), on Effects averagefor Flow length (α = Thickness 0.05). Figure 9. Pareto chart of(500–700 the Standardized short Finger (100–300 μm) (a) and Finger Thickness (500–700 µm) (b), on average Flow length (α = 0.05). long Finger Thickness (500–700 μm) (b), on average Flow length (α = 0.05).
Micromachines 2018, 9, 58 Micromachines 2018, 9, x FOR PEER REVIEW Inj V
Holding P
Mellt T
Mould T
16 14 12 10 8
18
Flow length [mm]
Flow length [mm]
18
12 of 19
12 of 19
140
220
20
70
240
270
20
Holding P [MPa]
12 10 140
220
10
Mellt T
Mould T
16 14 12 10 8
220
140
20
70
18
240
270
20
12 10 8 140
220
20
70
Holding P [MPa]
240
270
20
140
220
10
4 2 220
20
70
(g)
60
240
270
20
60
Inj V [mm/s]
Holding P [MPa]
Melt T [°C]
Mould T [°C]
14 12 10 8
10
Mould T
6
140
Mould T [°C]
140
220
10
60
240
270
20
60
(f) Mellt T
8
0
Melt T [°C]
10
6
60
Flow length [mm]
Flow length [mm]
10
Holding P
60
12
(e) Inj V
20
14
16
Mould T
14
6
270
(d) Mellt T
Flow length [mm]
Flow length [mm]
16
240
16
8
60
Inj V [mm/s]
(c) Holding P
Inj V
60
(b)
Holding P
Flow length [mm]
Flow length [mm]
18
Mould T [°C]
14
(a) Inj V
Melt T [°C]
16
8
60
Inj V [mm/s]
240
270
20
60
Inj V [mm/s]
Holding P [MPa]
Melt T [°C]
Mould T [°C]
8 6 4 2 0
140
220
10
60
240
270
20
60
(h)
Figure 10. Main effect plot for the filling flow length of ABS and PP materials for the four different Figure 10. Main effect plot for the filling flow length of ABS and PP materials for the four different fingers. (a) Main effect plot ABS finger No. 1 (thickness = 700 μm); (b) Main effect plot PP finger No. fingers. (a) Main effect plot ABS finger No. 1 (thickness = 700 µm); (b) Main effect plot PP finger No. 1 1 (thickness = 700 μm); (c) Main effect plot ABS finger No. 2 (thickness = 500 μm); (d) Main effect plot (thickness = 700 µm); (c) Main effect plot ABS finger No. 2 (thickness = 500 µm); (d) Main effect plot PP PP finger No. 2 (thickness = 500 μm); (e) Main effect plot ABS finger No. 3 (thickness = 300 μm); (f) finger No. 2 (thickness = 500 µm); (e) Main effect plot ABS finger No. 3 (thickness = 300 µm); (f) Main Main effect plot PP finger No. 3 (thickness = 300 μm); (g) Main effect plot ABS finger No. 4 (thickness effect plot PP finger No. 3 (thickness = 300 µm); (g) Main effect plot ABS finger No. 4 (thickness = 100 µm); = 100 μm); (h) Main effect plot PP finger No. 4 (thickness = 100 μm). (h) Main effect plot PP finger No. 4 (thickness = 100 µm).
Micromachines 2018, 9, 58 Micromachines 2018, 9, x FOR PEER REVIEW
13 of 19 13 of 19
Forboth bothmaterials, materials,the therelative relativeimportance importanceofofthe theprocess processparameters parameterswas wasconsistent consistentininboth both For amount of effect and trend across the whole DOE and for the four different thicknesses of the fingers. amount of effect and trend across the whole DOE and for the four different thicknesses of the fingers. particularit ithas hasbeen been demonstratedthat thatfor for decreasingthicknesses thicknessesthe theeffect effectofofinjection injectionspeed speedand and InInparticular demonstrated decreasing packingpressure pressureincreased increasedwith withrespect respecttotothe theeffect effectofofmould mouldand andmelt melttemperature temperaturesettings, settings,that thatinin packing factremained remainedrelatively relativelyconstant constantwhile whilethe thefinger fingerthicknesses thicknessesdecreased. decreased.This Thistrend trendwas wasverified verifiedfor for fact bothPP PPand andABS, ABS,for forallallfour fourprocessing processingparameters parametersand andfour fourfinger fingerthicknesses. thicknesses.This Thismeans meansthat thatinin both ordertotoextend extendthe thefilling fillingflow flowlength, length,the themain mainprocess processparameters parametersofofinfluence influenceare areinjection injectionspeed speed order andpacking packingpressure, pressure,while while increasing increasing melt melt and within the and and mould mouldtemperature temperatureshould shouldbebemaintained maintained within recommended levels for the as to avoid degradation, long cyclelong time, cycle deformation the recommended levels formaterial the material as topolymer avoid polymer degradation, time, at ejection. at This result This is valid forisdifferent this case long as as they are deformation ejection. result valid formaterials different(in materials (inABS this and casePP), ABSasand PP), long within thewithin same process window moulding the same geometry. asprocessed they are processed the same processand window and moulding the same geometry. 3.3.Factors FactorsAffecting AffectingFlash FlashFormation Formation 3.3. Flashisisdefined definedasasadditional additionalunwanted unwantedmaterial materialononthe thefinished finishedpart, part,typically typicallyforming formingatatthe the Flash edgeofofinjection injectionmoulded mouldedparts partswhere wheremelt meltflows flowsfrom fromthe thecavity cavityinto intothin thingaps gapsbetween betweenparting parting edge surfaces of the injection moulding tool. Flash formation was investigated by Chen et al. in [28]. Flash surfaces of the injection moulding tool. Flash formation was investigated by Chen et al. in [28]. Flash wascharacterized characterized terms length, closure time pressure. However, the considered part considered was inin terms of of length, closure time andand pressure. However, the part in thein the experiments was a polycarbonate plate produced by conventional injection moulding experiments was a polycarbonate plate produced by conventional injection moulding having having fairly fairlydimensions large dimensions 120 mm, 40 mm, thickness = 1.73 mm). Scientificresearch research large (length(length = 120 =mm, widthwidth = 40 =mm, thickness = 1.73 mm). Scientific regardingflash flashformation formationisisininfact factstill stillrather ratherlimited limitedand andininparticular particularit ithas hasnot notbeen beenperformed performedfor for regarding miniaturized or micro moulded parts. miniaturized or micro moulded parts. the present research, flash formation investigated for both andInPP. In Figure InInthe present research, flash formation waswas investigated for both ABSABS and PP. Figure 11 the11 the squared regions on sample the sample design indicated locations where flash occurred.Flash Flashwas was squared regions on the design indicated thethe locations where flash occurred. measured on the portion designed with letter A, on all moulded parts produced in the DOE, to analyse measured on the portion designed with letter A, on all moulded parts produced in the DOE, to the influence of moulding materialmaterial and process parameters on the amount flash produced during the analyse the influence of moulding and process parameters on the of amount of flash produced trials. An optical quality control CNC CMM was used to capture calibrated microscopic photographs during the trials. An optical quality control CNC CMM was used to capture calibrated microscopic for evaluating amount of formation in formation the same corresponding position of theposition moulded photographs forthe evaluating theflash amount of flash in the same corresponding of parts the for each parts experimental run for both materials (seematerials Figure 12). The optical equipped moulded for each experimental run for both (see Figure 12).CNC The CMM opticalwas CNC CMM with a 2× magnification lens and had alens field of view 3111ofµm × 2327 µm μm in the X and Y directions was equipped with a 2× magnification and had aoffield view of 3111 × 2327 μm in the X respectively, with 768 × 576 pixels of 4 µm × 4 µm in size. and Y directions respectively, with 768 × 576 pixels of 4 μm × 4 μm in size.
Figure 11.11. Flash formation inspection area with respect Figure Flash formation inspection area with respecttotosample sampledesign. design.
Micromachines 2018, 9, 58 Micromachines 2018, 9, x FOR PEER REVIEW
14 of 19 14 of 19
Figure flash area area measuring measuring procedure. procedure. Figure 12. 12. Workflow Workflow flash
The measurement uncertainty of the optical CMM when measuring areas was estimated to be The measurement uncertainty of the optical CMM when measuring areas was estimated to be 2, the uncertainty is 0.06 mm2. This 0.6%, meaning that for example when measuring an area of 1 mm 2 0.6%, meaning that for example when measuring an area of 1 mm , the uncertainty is 0.06 mm2 . This is is considered to be sufficiently low with respect to the moulding process variability in terms of flash considered to be sufficiently low with respect to the moulding process variability in terms of flash formation (see Figure 13) and its repeatability, which is at least one order magnitude higher. The area formation (see Figure 13) and its repeatability, which is at least one order magnitude higher. The area of the formed flash was measured by identifying on the calibrated images the contrast difference on of the formed flash was measured by identifying on the calibrated images the contrast difference on the image due to the flash portion (steps A and B in Figure 12). With an image processing software the image due to the flash portion (steps A and B in Figure 12). With an image processing software (SPIP© by Image Metrology A/S, Hørsholm, Denmark), it was than possible to inscribe the flash (SPIP© by Image Metrology A/S, Hørsholm, Denmark), it was than possible to inscribe the flash section in a defined polygon (step C in Figure 12). At last the calculation of the area was possible as section in a defined polygon (step C in Figure 12). At last the calculation of the area was possible as area of the defined polygon based on pixel counting and calibrated pixel area (step D in Figure 12). area of the defined polygon based on pixel counting and calibrated pixel area (step D in Figure 12). The robustness of the method was verified by replicating ten measurements of the same flash area. The robustness of the method was verified by replicating ten measurements of the same flash area. Afterwards, five independent measurements on five different parts for each of the 16 DOE process Afterwards, five independent measurements on five different parts for each of the 16 DOE process conditions were performed. An experimental relative standard deviation between 2% and 15% was conditions were performed. An experimental relative standard deviation between 2% and 15% was observed in more than 95% of the cases (see Figure 13). observed in more than 95% of the cases (see Figure 13). Before assessing the DOE results, a preliminary optical imaging inspection showed that flash Before assessing the DOE results, a preliminary optical imaging inspection showed that flash formation for the PP material was higher than for the ABS material for all 16 DOE treatments (see formation for the PP material was higher than for the ABS material for all 16 DOE treatments Figure 14). As shown in the Pareto charts in Figure 15a, the factors significance (consisting of a (see Figure 14). As shown in the Pareto charts in Figure 15a, the factors significance (consisting p-value lower than 5%) on the average flash formation for ABS was observed for injection velocity, of a p-value lower than 5%) on the average flash formation for ABS was observed for injection velocity, holding pressure and melt temperature. These three process parameters were those with the highest holding pressure and melt temperature. These three process parameters were those with the highest main effect also for PP (see Figure 16b). Both factorial models were validated from a statistical point main effect also for PP (see Figure 16b). Both factorial models were validated from a statistical point of of view after a standardised residuals checking and the verification of an R-squared adjusted for the view after a standardised residuals checking and the verification of an R-squared adjusted for the ABS ABS model of 91.2% and 95.0% for the PP model was carried out. model of 91.2% and 95.0% for the PP model was carried out. All the main effects of the full factorial design are reported in Figure 16. The most important All the main effects of the full factorial design are reported in Figure 16. The most important results can be seen from the difference in flash formation by changing the material from ABS to PP. results can be seen from the difference in flash formation by changing the material from ABS to PP. Despite in Figure 10g,h an average higher finger replication was detected when using PP, Figure 16 Despite in Figure 10g,h an average higher finger replication was detected when using PP, Figure 16 shows that at the same time PP led to higher flash formation. In particular, the overall average flash shows that at the same time PP led to higher flash formation. In particular, the overall average area for PP was 3.3 times that the flash area for parts moulded with ABS (see Figure 16a,b). This flash area for PP was 3.3 times that the flash area for parts moulded with ABS (see Figure 16a,b). variation can be explained by the different rheology of the two materials. As shown in Figure 1 ABS This variation can be explained by the different rheology of the two materials. As shown in Figure 1 has a higher viscosity especially at high temperature setting which decreased the flowability (as ABS has a higher viscosity especially at high temperature setting which decreased the flowability shown in the flow length analysis) but in turn led to lower flash formation. (as shown in the flow length analysis) but in turn led to lower flash formation.
Micromachines 2018, 9, 58 Micromachines 2018, 2018, 9, 9, xx FOR FOR PEER PEER REVIEW REVIEW Micromachines
15 of 19
15 of of 19 19 15
1,1 1,1 1,0 1,0
ABS Flash Flash area area ABS
0,9 0,9
PP Flash Flash area area PP
0,8 0,8
Flash Flasharea area[mm [mm2]2]
0,7 0,7 0,6 0,6 0,5 0,5 0,4 0,4 0,3 0,3 0,2 0,2 0,1 0,1 0,0
0,0 Vi Vi (mm/s) (mm/s) Ph (MPa) Ph ABS (MPa) ABS Ph (MPa) Ph (MPa) PP PP Tb (°C) Tb (°C) Tm (°C) Tm (°C) Av. Area Av. Area [mm2] [mm2] ABS ABS C.o.V C.o.V [%] ABS [%] ABS Av. Area Av. Area [mm2] PP [mm2] PP C.o.V [%] C.o.V PP[%] PP
140 140
220 220
140 140
220 220
140 140
220 220
140 140
220 220
140 140
220 220
140 140
220 220
140 140
220 220
140 140
220 220
20 20
20 20
70 70
70 70
20 20
20 20
70 70
70 70
20 20
20 20
70 70
70 70
20 20
20 20
70 70
70 70
10 10
10 10
60 60
60 60
10 10
10 10
60 60
60 60
10 10
10 10
60 60
60 60
10 10
10 10
60 60
60 60
240 240 20 20 0,03 0,03
240 240 20 20 1,05 1,05
240 240 20 20 0,87 0,87
240 240 20 20 1,83 1,83
270 270 20 20 0,51 0,51
270 270 20 20 2,59 2,59
270 270 20 20 1,28 1,28
270 270 20 20 2,75 2,75
240 240 60 60 0,46 0,46
240 240 60 60 1,88 1,88
240 240 60 60 0,66 0,66
240 240 60 60 2,36 2,36
270 270 60 60 0,43 0,43
270 270 60 60 2,20 2,20
270 270 60 60 1,34 1,34
270 270 60 60 3,12 3,12
14% 14%
12% 12%
13% 13%
10% 10%
25% 25%
8% 8%
11% 11%
11% 11%
13% 13%
9% 9%
13% 13%
7% 7%
9% 9%
11% 11%
13% 13%
5% 5%
0,45 0,45
5,98 5,98
3,28 3,28
6,01 6,01
0,63 0,63
7,66 7,66
4,00 4,00
7,55 7,55
0,07 0,07
5,34 5,34
4,72 4,72
7,20 7,20
0,53 0,53
8,20 8,20
8,56 8,56
9,96 9,96
15% 15%
9% 9%
13% 13%
7% 7%
13% 13%
6% 6%
9% 9%
4% 4%
13% 13%
4% 4%
8% 8%
3% 3%
12% 12%
5% 5%
2% 2%
5% 5%
Figure 13.13. Average flash area for both both materials materialsABS ABSand andPP. PP.Note Note1:1: error Figure Average flash areafor foreach eachexperimental experimental run run for error Figure 13. Average flash area for each experimental run both materials ABS and PP. Note 1: error bars on histograms indicate experimental standard deviation (SD). Note 2: Coefficient of Variation bars on on histograms histograms indicate indicate experimental experimental standard standard deviation deviation (SD). (SD). Note Note 2: 2: Coefficient Coefficient of of Variation Variation bars COV% = average/SD × 100%. COV% = average/SD·× 100%. COV% = average/SD·× 100%.
Figure 14.14. Images ofof PPPP(right) andABS ABS(right) (left) flash formation in different differentprocess processconditions conditionsatat all the Figure 14. Images of (left) and and ABS flash formation formation in in different all the the Figure Images PP (left) (right) flash process conditions at all 16 DOE treatments. The gap between the left and right edges of the polymer features is 2.0 mm. 16 DOE DOE treatments. treatments. The The gap gap between between the the left left and and right right edges edges of of the the polymer polymer features features is is 2.0 2.0 mm. mm. 16
Micromachines 2018, 2018, 9, FOR PEER PEER REVIEW REVIEW Micromachines 2018,9, 9,xx58FOR Micromachines
16 of of 19 19 16 of 19 16
The same same discussion discussion is is valid valid with with respect respect to to the the high high effect effect on on the the Injection Injection Velocity. Velocity. By By directly directly The The same discussion is valid with respect to the high effect on the Injection Velocity. By directly affecting the the shear shear rate rate and and the the viscosity, viscosity, an an injection injection velocity velocity variation variation from from 140 140 to to 220 220 mm/s mm/s at at least least affecting affecting the shear rate and the viscosity, an injection velocity variation fromclearly 140 to 220 mm/s at least doubled the average flash area as shown by both Figure 16a,b and indicated by the doubled the average flash area as shown by both Figure 16a,b and clearly indicated by the doubled the average flash area as shown by both Figure 16a,b and clearly indicated by the micrographs micrographs in Figure 13. micrographs in Figure 13. in Figure The 13. effect of of both both the the holding holding pressure pressure and and melt melt temperature temperature was was due due once once again again in in the the The effect The effect of both the holding pressure andinmelt temperature was due once again inpolymer the reduction reduction of the viscosity of the part and applying higher pressure with the in reduction of the viscosity of the part and in applying higher pressure with the polymer in aa of the viscosity the partstate. and in applying higher pressure with the polymer in a particularly low particularly lowof viscosity particularly low viscosity state. viscosity state. Despite the the relatively relatively higher higher effect effect of of process process parameters parameters on on flash flash formation formation by by PP PP than than by by ABS, ABS, Despite Despite the relatively higher effect of process parameters on flash (namely formation byfact PPthat thanthe byeffect ABS, it is worth noticing that the relative importance among the parameters the it is worth noticing that the relative importance among the parameters (namely the fact that the effect it is worth noticing that the relative importance among the parameters (namely the fact that the effect of injection injection speed speed is is higher higher than than that that of of packing packing pressure, pressure, which which is is higher higher than than the the effect effect of of melt melt of of injection speed is higher than that of packing pressure, which is higher than the effect of melt temperature and eventually of that of mould temperature) is consistent for both materials, for the temperature and eventually of that of mould temperature) is consistent for both materials, for the temperature and eventually of that of mould temperature) isPareto consistent for both materials, for the considered geometry (see Figure 16a,b) and confirmed by the analysis (see Figure 15a,b). considered geometry (see Figure 16a,b) and confirmed by the Pareto analysis (see Figure 15a,b). considered geometry Figure 16a,b) andfilling confirmed byhigh the Pareto (see speed Figureand 15a,b). Therefore, while (see to enhance enhance high flow flow length settingsanalysis of injection injection packing Therefore, while to high filling length high settings of speed and packing Therefore, while to enhance high flow filling length high settings of injection speed and packing pressure are to be preferred, it must be considered in the moulding process design phase that those pressure are to be preferred, it must be considered in the moulding process design phase that those pressure are to be preferred, it must be considered in the moulding process design phase that those are are the the process process parameters parameters that that at at the the same same time time also also promote promote high high flash flash formation. formation. are the process parameters that at the same time also promote high flash formation.
(a) ABS ABS (a)
(b) PP PP (b)
Figure 15. 15. Pareto Pareto chart chart of of the the Standardized Standardized Effects Effects on on average average Flash Flash Area Area (α (α == 0.05) 0.05) for for (a) (a) ABS ABS and and Figure Figure 15. Pareto chart of the Standardized Effects on average Flash Area (α = 0.05) for (a) ABS and (b) PP PP material. material. (b) (b) PP material. 0.8 0.8
0.8 0.8
Flash Flasharea areafor forABS ABS[mm2] [mm2]
0.7 0.7
Flash Flasharea areafor forPP PP[mm2] [mm2]
0.6 0.6 0.5 0.5
0.4 0.4
0.3 0.3 0.2 0.2
0.15 0.15 0.1
0.15
0.1
0.0 0.0
0.15
0.15
0.15 0.10 0.10 0.05
140 220 140 220 Inj V [mm/s] Inj V [mm/s]
20 70 20 70 Holding P [MPa] Holding P [MPa]
240 270 240 270 Melt T [°C] Melt T [°C]
(a) ABS ABS (a)
0.05
20 60 20 60 Mould T [°C] Mould T [°C]
0.8 0.8
0.7 0.7
0.7 0.7
0.6 0.6
0.6 0.6
0.5 0.5
0.5
0.5
0.4 0.4
0.5
0.5
0.5
0.5
0.4 0.4
0.3 0.3
0.3 0.3
0.2 0.2
0.2 0.2
0.1 0.1
0.0 0.0
140 220 140 220 Inj V [mm/s] Inj V [mm/s]
10 60 10 60 Holding P [MPa] Holding P [MPa]
(b) PP PP (b)
20 60 20 60 Mould T [°C] Mould T [°C]
240 270 240 270 Melt T [°C] Melt T [°C]
Figure 16. Main effect plot for Flash section area on (a) ABS ABS and and (b) (b) PP. PP. Figure Figure 16. 16. Main Main effect effect plot plot for for Flash Flash section section area area on on (a) (a) ABS and (b) PP.
4. Conclusions 4. 4. Conclusions Conclusions Micro injection moulding moulding is an an important process process in micro micro production engineering engineering due to to its low low Micro Micro injection injection moulding is is an important important process in in micro production production engineering due due to its its low cost and high high manufacturing manufacturing volume. volume. Manufacturing parts parts with high high accuracy and and quality is is very cost cost and and high manufacturing volume. Manufacturing Manufacturing parts with with high accuracy accuracy and quality quality is very very important in polymer parts micro manufacture due to their high precision applications. The purpose important due to to their important in in polymer polymer parts parts micro micro manufacture manufacture due their high high precision precision applications. applications. The The purpose purpose of this this study study was was to to investigate investigate the the effect effect of of several several process process parameters parameters on on multiple multiple quality quality criteria criteria of of this study was to investigate the effect of several process parameters on multiple quality criteria for for the resulting resulting parts. parts. In In this this work, work, the the quality quality criteria criteria considered considered were were the the part part mass, mass, the the flow flow length length for the the resulting parts. In this work, the quality criteria considered were the part mass, the flow length and flash amount amount using using micro micro fingers fingers test test structures. structures. and and flash flash amount using micro fingers test structures. Experimental results and statistical analysis showed that: that: Experimental results and statistical analysis showed • •
Among the the four four process process parameters parameters considered considered in in this this research research (injection (injection velocity, velocity, holding holding Among
Micromachines 2018, 9, 58
17 of 19
Experimental results and statistical analysis showed that:
•
•
•
Among the four process parameters considered in this research (injection velocity, holding pressure, melt temperature and mould temperature), results showed that the holding pressure and injection speed were the most effective on mass and flow length for both the used materials (ABS and PP) and the for all considered micro cantilever geometries. Flow length was inversely proportional to the thickness of the fingers high aspect ratio features. However, a non-linear behaviour was observed across the micro geometries analysed. For finger having thickness of 500 µm and above, both ABS and PP had similar flow length across the entire process window with similar filling behaviours. For finger thickness of 300 µm and below, PP had an increasingly better filling performance than ABS as the thickness decreased down to 100 µm. ABS flowability was severely challenged due to its higher viscosity with respect to PP. The decreasing of thickness gave raise to higher effect of injection speed and packing pressure in increasing the flow length, both for PP and ABS. The flash amount created when moulding the PP material was generally larger than the flash amount for the ABS material when considering corresponding processing conditions. Injection speed and holding pressure had higher effects than melt and mould temperature and revealed to be the most affective parameters on increasing the amount of flash for both material when set at high levels. The area of flash generated when moulding PP was in average 3.3 larger than that of ABS. However, the relative importance of the four process parameters in promoting flash formation was the same for ABS and PP, indicating similarity among the two materials in their relative sensitivity to changes in moulding parameters settings.
In conclusion, in order to replicate high quality parts with sub-mm thickness and high aspect ratio features, correct adjustment of the process parameters is crucial. In particular, holding pressure and injection velocity proved to be very important for part mass and flow length accuracy. Conversely, injection velocity and holding pressure had an undesirable effect on the amount of flash formation. Indeed, the choice of the polymer material had a large effect on the quality of the part in terms of flow length and flash formation, particularly for the smallest thicknesses (300 µm and 100 µm in this research). In spite of the fact that a less viscous polymer such as PP can replicate features with higher aspect ratio, it also promotes higher flash formation. For this reason, especially when the geometrical aspect ratio increases, it is crucial to identify the optimum set of moulding parameters to produce a high-quality part in relation to the corresponding selected polymer. Acknowledgments: The research reported in this paper was jointly funded by the Department of Mechanical Engineering, Technical University of Denmark and the Egyptian Cultural Affairs and Mission Sector. Author Contributions: A.E., G.T. and A.I. conceived and designed the experiments; A.E. performed the experiments; A.E. and D.L. performed the measurements; A.E., G.T. and D.L. analyzed the data; A.E., G.T. and D.L. wrote the paper; G.T., A.I., H.N.H., R.M. and H.S. revised the paper. Conflicts of Interest: The authors declare no conflict of interest.
References 1. 2.
3. 4.
Hansen, H.N.; Hocken, R.J.; Tosello, G. Replication of micro and nano surface geometries. CIRP Ann.-Manuf. Technol. 2011, 60, 695–714. [CrossRef] Kim, W.W.; Gang, M.G.; Min, B.K.; Kim, W.B. Experimental and numerical investigations of cavity filling process in injection moulding for microcantilever structures. Int. J. Adv. Manuf. Technol. 2014, 75, 293–304. [CrossRef] Calaon, M.; Hansen, H.N.; Tosello, G.; Garnaes, J.; Nørregaard, J.; Li, W. Microfluidic chip designs process optimization and dimensional quality control. Microsyst. Technol. J. 2013, 21, 561–570. [CrossRef] Packianather, M.; Griffiths, C.; Kadir, W. Micro injection moulding process parameter tuning. Procedia CIRP 2015, 33, 400–405. [CrossRef]
Micromachines 2018, 9, 58
5.
6. 7. 8. 9. 10. 11. 12.
13. 14.
15.
16. 17. 18. 19. 20.
21.
22.
23. 24. 25. 26.
18 of 19
Fu, G.; Tor, S.B.; Hardt, D.E.; Loh, N.H. Effects of processing parameters on the micro-channels replication in microfluidic devices fabricated by micro injection molding. Microsyst. Technol. 2011, 17, 1791–1798. [CrossRef] Yang, D.; Liu, C.; Xu, Z.; Wang, J.Z.; Wang, L.D. Effect of microinjection molding process parameters for various micro-channels. Key Eng. Mater. 2011, 483, 53–57. [CrossRef] Mani, M.R.; Surace, R.; Ferreira, P.; Segal, J.; Fassi, I.; Ratchev, S. Process Parameter Effects on Dimensional Accuracy of Microinjection Moulded Part. J. Micro- Nano-Manuf. 2013, 1, 031003-1–031003-8. [CrossRef] Attia, U.M.; Alcock, J.R. Optimising process conditions for multiple quality criteria in microinjection moulding. Int. J. Adv. Manuf. Technol. 2010, 50, 533–542. [CrossRef] Yang, C.; Li, L.; Huang, H.; Castro, J.M.; Yi, A.Y. Replication Characterization of Microribs Fabricated by Combining Ultraprecision Machining and Microinjection Molding. Polym. Eng. Sci. 2010. [CrossRef] Bellantone, V.; Surace, R.; Trotta, G.; Fassi, I. Replication capability of micro injection moulding process for polymeric parts manufacturing. Int. J. Adv. Manuf. Technol. 2013, 67, 1407–1421. [CrossRef] Metwally, K.; Barriere, T. Replication of micronic and submicronic structured surfaces using micro-injection and micro-injection compression moulding. Int. J. Adv. Manuf. Technol. 2013, 83, 779–789. [CrossRef] Zhang, N.; Browne, D.J.; Gilchrist, M.D. Characterization of Micro Injection Molding Process for the Replication of Micro/Nano Features Using Bulk Metallic Glass Insert. IACSIT Int. J. Eng. Technol. 2013, 5, 198. [CrossRef] Lee, J.G.; Lee, B.K.; Kang, T.G.; Kwon, T.H. Experimental and Numerical Investigation of Injection Molding with Microribs Patterns. Polym. Eng. Sci. 2010, 5, 1186–1198. [CrossRef] Rodgers, J.W.; Casey, M.E.; Jedlicka, S.S.; Coulter, J.P. Effect of Micro-Injection Molding Processing Conditions on the Replication and Consistency of a Dense Network of High Aspect Ratio Microstructures. J. MicroNano-Manuf. 2014, 2, 011006-1–011006-8. [CrossRef] Qiu, Z.J.; Ma, Z.; Gao, S. Effects of process parameters on the molding quality of the micro-needle array. In Proceedings of the Global Conference on Polymer and Composite Materials, Hangzhou, China, 20–23 May 2016; Volume 137. [CrossRef] Matschuk, M.; Larsen, N.B. Injection molding of high aspect ratio sub-100 nm nanostructures. J. Micromech. Microeng. 2013, 23, 1–10. [CrossRef] Baruffi, F.; Calaon, M.; Tosello, G. Effects of micro-injection moulding process parameters on accuracy and precision of thermoplastic elastomer micro rings. Precis. Eng. 2018, 51, 353–361. [CrossRef] Stormonth-Darling, J.M.; Pedersen, R.H.; How, C.; Gadegaard, N. Injection moulding of ultra-high aspect ratio nanostructures using coated polymer tooling. J. Micromech. Microeng. 2014, 24, 075019. [CrossRef] Han, S.; Kim, W. Microinjection moulding of miniaturised polymeric ortho-planar springs. Microsyst. Technol. 2016, 22, 1991–1999. [CrossRef] Yang, C.; Huang, H.X.; Castro, J.M.; Yi, A.Y. Replication Characterization in Injection Molding of Microfeatures with High Aspect Ratio: Influence of Layout and Shape Factor. Polym. Eng. Sci. 2011, 51, 959–968. [CrossRef] Packianather, M.; Chana, F.; Griffiths, C.; Dimov, S.; Pham, D.T. Optimizations of micro injection moulding process through design of experiments. In Proceedings of the 8th CIRP Conference on Intelligent Computation in Manufacturing Engineering, Munich, Germany, 6–9 October 2013. [CrossRef] Pina-Estany, J.; Colominas, C.; Fraxedas, J.; Llobet, J.; Perez-Murano, F.; Puigoriol-Forcada, J.M.; Ruso, D.; Garcia-Granada, A.A. A statistical analysis of nanocavities replication applied to injection moulding. Int. Commun. Heat Mass Transf. 2016, 81, 131–140. [CrossRef] Autodesk Moldflow Insight®. Database, 2016, Autodesk: San Rafael, CA, USA, 2016. Bellantone, V.; Surace, R.; Modica, F.; Fassi, I. Evaluation of mold roughness influence on injected thin micro-cavities. Int. J. Adv. Manuf. Technol. 2017, 1–11. [CrossRef] Zhang, H.L.; Ong, N.S.; Lam, Y.C. Mold surface roughness effects on cavity filling of polymer melt in micro injection molding. Int. J. Adv. Manuf. Technol. 2008, 37, 1105–1112. [CrossRef] Stanek, M.; Manas, M.; Manas, D.; Senkerik, V. How Surface Roughness Influence the Polymer Flow. RECENT ADVANCES IN MECHANICAL ENGINEERING and MECHANICS. In Proceedings of the 2014 International Conference on Theoretical Mechanics and Applied Mechanics (TMAM ‘14) and the 2014 International Conference on Mechanical (ME ’14), Venice, Italy, 15–17 March 2014; Volume 10.
Micromachines 2018, 9, 58
27. 28.
19 of 19
Griffiths, C.A.; Dimov, S.S.; Scholz, S.; Hirshy, H.; Tosello, G. Process Factors Influence on Cavity Pressure Behavior in Microinjection Moulding. J. Manuf. Sci. Eng. 2011, 133, 031007-1–031007-10. [CrossRef] Chen, Z.; Giacomin, A.J.; Turng, L.-S. Flash. Polym. Eng. Sci. 2006, 46, 235–383. [CrossRef] © 2018 by the authors. Licensee MDPI, Basel, Switzerland. This article is an open access article distributed under the terms and conditions of the Creative Commons Attribution (CC BY) license (http://creativecommons.org/licenses/by/4.0/).