Influence of wave exposure and habitat complexity in determining spatial variation of the sea urchin Diadema aff. antillarum (Echinoidea: Diadematidae) populations and macroalgal cover (Canary Islands - Eastern Atlantic Ocean) S. Clemente1,2 & J.C. Hernández1,2 1. 2.
Dpto. Biología Animal (Ciencias Marinas), Universidad de La Laguna, Islas Canarias;
[email protected] Biology Department, Villanova University, Villanova, Pennsylvania, USA;
[email protected] Received 06-X-2007.
Corrected 31-i-2008.
Accepted 17-ix-2008.
Abstract: Diadema aff. antillarum performs a key role in organizing and structuring rocky macroalgae assemblages in the Canary Islands; increased sea urchin population density can result in the formation of rocky grounds covered with crustose algae. In the Canary Islands this type of system alternates with non-crustose macroalgal systems. However, understanding of the process controlling formation, persistence and alternation between states is still poor. Moreover, knowledge of spatial and temporal variations of this key herbivore populations are scarce. Here an extensive study of D. aff. antillarum populations throughout the Canarian Archipelago were presented, with particular emphasis on two main themes: firstly the influence of sea urchin population on non-crustose macroalgal assemblages. Secondly, the spatial variation of adult sea urchin populations at different scales: both on a large scale (between islands and sites with different wave exposure) and on a medium-small scale (between depths and habitats with different characteristics), and including comments regarding human influence on the observed spatial pattern between the studied islands. The main results were: (1) densities of D. aff. antillarum higher than 4 ind.m-2 drastically reduce non-crustose macroalgal cover to under 30%; (2) Tenerife Island comprises the highest urchin densities while El Hierro has been found to have the lowest; (3) wave exposure is a factor determining sea urchin density: more highly exposed sites present lower urchin density and vice versa; (4) rocky grounds covered with crustose algae can be found at greater depth in more highly exposed sites and at shallower depths in lesser exposed sites; (5) when sand percentage over the rocky substrate exceeds 20%, urchin density is limited to under 1 ind.m-2 and (6) high relief rocky substrate present higher urchin densities and hence a lower non-crustose macroalgal cover. Rev. Biol. Trop. 56 (Suppl. 3): 229-254. Epub 2009 January 05. Key words: Canary Islands, Diadema aff. antillarum, non-crustose macroalgae, wave exposure, habitat complexity.
The importance of herbivorous sea urchins in structuring marine algal assemblages is well known (Lawrence 1975, Lawrence and Sammarco 1982, Dayton and Tegner 1984, Harrold and Pearse 1987). At moderate population densities, sea urchins may alter plant species composition and promote species diversity through selective feeding (Sammarco et al. 1974, Sammarco 1982). However, at high densities they can dramatically reduce
the non-crustose macroalgae beds of the rocky reefs resulting in formation of ‘sea urchindominated barren grounds’ (Lawrence 1975). The occurrence of such areas has been reported along temperate coastlines (North and Pearse 1970, Estes and Palmisiano 1974, Mann 1977, Scheibling and Stephenson 1984, Miller 1985, Duggins 1989, McShane and Naylor 1991, Vadas and Elner 1992, Andrew 1993, Sala et al. 1998, Steneck et al. 2002, Guidetti et al.
Rev. Biol. Trop. (Int. J. Trop. Biol. ISSN-0034-7744) Vol. 56 (Suppl. 3): 229-254, December 2008
229
2003) and subtropical coastlines (Aguilera et al. 1994, Alves et al. 2003, Brito et al. 2004, Tuya et al. 2004a, 2004b, Hernández 2006), as well as in tropical regions (Ogden et al. 1973, Sammarco 1982, Hay 1984, John et al. 1992, McClanahan 2000). In the eastern Atlantic oceanic islands, and particularly in the Canary Islands, the density of the b-form of Diadema antillarum Philippi, 1845 (Lessios et al. 2001) can often reach more than 12 ind.m-² and it is spread throughout the entire Archipelago (Aguilera et al. 1994, Brito et al. 2001, Tuya et al. 2004a, Hernández 2006). As in other sites around the globe, loss of macroalgal beds due to urchin grazing activity produces lower species diversity (Herrera 1998, Garrido 2003) and lack of habitat suitable for feeding and breeding fish (Brito et al. 2004, Tuya et al. 2005). Therefore, urchin barrens are unproductive habitats, where primary productivity is more than two orders of magnitude lower than at reefs dominated by algal beds in temperate regions (see Chapman 1981). At the latitude where the Canary Islands lies, between tropical and temperate waters, macroalgae are the main biological engineers on rocky reefs and no coral reef formations occur. Consequently, high macroalgal cover is a well-known indicator of good benthic conservation status (Hernández et al. 2007a). On temperate and subtropical rocky coasts world wide, subtidal habitats are often characterized by one of two community states: algae bed/kelp forest or sea urchin barren (Estes and Palmisiano 1974, Lawrence 1975, Sala and Zabala 1996, Guidetti et al. 2003, Folke et al. 2004, Tuya et al. 2004a, Hernández et al. 2007a). When urchins are abundant in barrens their intense grazing denudes the seabed of all but encrusting red coralline algae such as Hydrolithon and Neogonolithon, and brown encrusting algae Pseudolithoderma adriaticum (Sangil et al. 2006a, 2006b, Sangil unpublished data). In spite of the high densities of this keystone sea urchin throughout the Canary Islands, relatively large areas that remain without urchins or where urchins are found in very low densities have been discovered (Brito et 230
al. 1984, 2004, Bacallado et al. 1987, Garrido 2003, Tuya et al. 2004a, Tuya and Haroun 2006, Hernández et al. 2007a). In such areas, the algal beds are characterized by brown algae and dominated by the unbranched brown algae Lobophora variegata, that occupies 80% of the substrate and can reach 50 m depth (Tuya and Haroun 2006, Sangil et al. 2006a, 2006b, Hernández et al. 2007a). Habitat complexity is an important factor influencing Diadema grazing (Ogden 1976, Lee 2006), as also holds true for other sea urchin species (Andrew 1993), since complex habitats provide urchins with refuge from predation (Ebling et al. 1966, Ogden 1976, Levitan and Genovese 1989, McClanahan and Kurtis 1991). The availability of refuges and the urchins’ so called cryptic behavior seems to help promote survival of recruits in complex rocky areas (Carpenter 1984, Verlaque 1984, Bak 1985, Hunte and Younglao 1988, Levitan and Genovese 1989, Sala and Zabala 1996, Tomas et al. 2004) and probably contributes to the high adult population density typically found in these habitats (Hernández 2006, Hernández et al. 2006, Clemente et al. 2007). Therefore, the availability of shelter can be viewed as a major factor influencing the distribution of urchin barrens (Andrew 1993). Gradients in the physical environment may produce variability in the abundance and distribution of urchin populations simply as a consequence of the space available or of the different physiological tolerances of the species (Ogden 1976, Levitan and Genovese 1989, Andrew 1993). This kind of segregation often occurs at relatively large spatial scales (Gaines and Lubchenco 1982, Barry and Dayton 1991, Dunson and Travis 1991). At smaller scales (within habitats), physical factors may play an important role in regulating the intensity of biological interactions which define invertebrate abundance (Hawkins 1981, Hawkins and Hartnoll 1983, Lubchenco 1983, Sousa 1984, 1985, Connell and Keough 1985). Consequently, environmental conditions play an important role in spatial heterogeneity of marine assemblages at different scales,
Rev. Biol. Trop. (Int. J. Trop. Biol. ISSN-0034-7744) Vol. 56 (Suppl. 3): 229-254, December 2008
from local patchiness to variation along biogeographic gradients (Levin 1992, Menge and Sutherland 1987, Hixon and Menge 1991, Menge 2000, Fraschetti et al. 2005). The mechanisms that bring about patchiness have been studied in other regions of the world (Lubchenco 1983, Hawkins and Hartnoll 1983, Connell and Keough 1985, Hay 1991, Bennedetti-Cechi and Cinelli 1995) but few studies concerning habitat complexity have been carried out with urchins in subtidal marine environments (McClanahan 1994, Lee 2006, Clemente et al. 2007). Since depth, wave exposure and habitat complexity are believed to affect D. aff. antillarum distribution and abundance (Alves et al. 2001, Hernández 2006, Clemente et al. 2007, Tuya et al. 2007), any deductions made by urchin population studies must be made knowing the species’ basic variation in relation to these environmental variables. Here we present a data set, recorded throughout the Canarian Archipelago over a six year study period and 125 sites, which aims to promote a better understanding of spatial variation at different scales. This study assesses D. aff. antillarum populations (density); cover of urchin barrens versus macroalgae; and habitatcomplexity. Variation is studied at different spatial scales (amongst islands, and amongst areas of different wave exposure, depth, and habitat complexity). MATERIALS AND METHODS Study site: oceanographic features of the Canary Islands. The Canary Islands are situated between 27.68° - 29.58° N and 18.28° - 14.58° W on the eastern border of the North Atlantic subtropical gyre. Emerging from the oceanic basin as a result of successive overlays of volcanic material to form an independent set of islands with a water depth of around 2000 m between them, the Canarian Archipelago comprises seven major islands and four islets called the ‘Archipelago Chinijo’ located at its northeastern side.
The eastern boundary of the archipelago is separated 90 km from the coast of African and it extends about 400 km further west. This geographical location between the cool, nutrientrich water from the north-west African coastal upwelling, and the warmer, nutrient-poor open ocean waters, means that the Canary Islands are considered a ‘Coastal Transition Zone’ (Barton et al. 1998). In addition, the archipelago itself acts as an obstacle to both the Canary Current, which flows NNE to SSW through the archipelago, and to the Trade Winds; thus giving rise to a variety of mesoscale phenomena that have strong implications for the productivity of the region (Molina and Laatzen 1986, Barton 1994, Arístegui et al. 1997). This particular geographical situation creates an oceanographic gradient across the archipelago, where differences in sea water temperature (≈ 2ºC), nutrients and primary productivity are found between its eastern and western boundaries (Barton et al. 1998, Davenport et al. 2002). Therefore, the islands marine assemblages consist of a combination of tropical and temperate species which varies according to its location within the oceanographic gradient (algae: Sansón et al. 2001; invertebrates: Moro-Abad et al. 2003; vertebrates: Brito et al. 2001). Exposure to wave action is a strong force in segregating urchin species at the scale between islands (Tuya et al. 2007). Differences between coastal orientations and seasons are found amongst islands. The shape of the island and orientation against the waves create different degrees of wave exposure along the different islands coastlines, which present different susceptibility to the incidence of storms, both linked to swell and sea wave events. The normal wave pattern consists of sea waves from a NNE direction, which have an annual average height of 1.4 m and a frequency of 9.5 s between waves. Sea waves are more frequent from late autumn until early spring. NNE sea swells are abundant throughout the year, also associated with 18 to 22 km/h NNE and NE winds. However, stronger swells, originated in the Northern Atlantic, become more frequent
Rev. Biol. Trop. (Int. J. Trop. Biol. ISSN-0034-7744) Vol. 56 (Suppl. 3): 229-254, December 2008
231
between October and March and approach the islands from NNW and NW with an annual wave height ranging between 2 and 3 m and a frequency of 18 s between waves (Yanes et al. 2006). According to the different spatial behavior of the swell, differences in terms of average annual height between the northern, western and eastern-southeastern coasts are found. There are also spatial differences between average wave height and frequency along the northern and western coastlines which are exposed to non local swells. Eastern, southeastern and southern coasts of the islands are sheltered from strong swells; these coastlines face waves which are on average smaller than those in coastlines with other orientations (e.g. Tenerife: Pérez et al. 2003, Yanes et al. 2006). Sampling methods Sea urchins and algal assemblages. At each locality the belt transect method was used, in which a continuous area along a line transect is surveyed to count all D. aff. antillarum individuals, providing estimates of sea urchin population density. In the Mediterranean Sea, this simple technique has been successfully carried out to estimate population density of the sea urchins Arbacia lixula and Paracentrotus lividus (Harmelin et al. 1980, Turón et al. 1995, Sala and Zabala 1996). However, in the present study certain modifications have made this technique more suitable for the benthic communities investigated (Hernández et al. 2007a). Shorter transects of 10 x 2 m were used, allowing for more replicates; at least eight randomly placed replicates were carried out at each site with a minimum distance of 10 m between replicates. Transects were run parallel to the coast line using a metric tape at a depth range preestablished between 0.5 m and 25 m. The percentage of non-crustose macroalgal cover was visually determined in each 20 m2 transect. Dominant algal assemblage was recorded in all sampled sites and five separate morpho-functional algal groups were considered following Guidetti (2006) ((a)
232
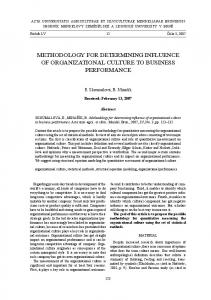
algal turf; (b) unbranched-erect macroalgae; (c) branched-erect macroalgae; (d) calcified-erect macroalgae) and modifications by Hernández et al. (2007) ((e) crustose macroalgae) (Table 1)). These groupings facilitate the ecological interpretation of algal assemblages influenced by D. aff. antillarum, since species with similar morphotype and phenology tend to react similarly (Dethier 2001). Experimental design and data analysis Influence of sea urchin population density on algal assemblages. The influence of sea urchin populations on algae assemblage was determined using data from 125 sites (one survey and at least eight replicates per site) around the Canarian Archipelago (Fig. 1; Table 2) over the period between 2001 and 2006. Log-linear relationships between sea urchin D. aff. antillarum density (ind.m-²) and noncrustose macroalgal cover (%) were assessed. Regression models were performed using the SPSS-14 statistical package. To assess the effect of urchin density on non-crustose macroalgal cover, a one-way Permutational ANOVA was performed with ‘Sea Urchin Density’ as the factor with 6 density categories (1: 0-2 ind. m-2; 2: 2-4 ind. m-2; 3: 4-6 ind. m-2; 4: 6-8 ind. m-2; 5: 8-10 ind. m-2; 6: >10 ind. m-2), using PRIMER 6 & PERMANOVA + software. Large scale spatial variation: Influence of archipelagic gradient and wave exposure. To assess spatial variation over a scale of kilometers, a total of 125 sites were sampled between 2001 and 2006 throughout the entire archipelago: 28 in La Palma, 20 in El Hierro, 13 in La Gomera, 24 in Tenerife, 10 in Gran Canaria, 9 in Fuerteventura and 21 in Lanzarote and the islets (La Graciosa, Montaña Clara, Alegranza and Roque del Este) (Fig. 1; Table 2). Sites were chosen from two different wave exposure categories and sampling was done in a depth band between 0.5 m and 25 m. A variety of different degrees of exposure can be found on an island due to its local topography.
Rev. Biol. Trop. (Int. J. Trop. Biol. ISSN-0034-7744) Vol. 56 (Suppl. 3): 229-254, December 2008
TABLE 1 List of algae species surveyed at the sampling sites in the Canary Islands Non-crustose macroalgae Turf
Unbranched erect
Branched erect
Calcified erect
Amphiroa spp.
Colpomenia sinuosa
Asparagopsis taxiformis
Corallina elongata
Asparagopsis taxiformis (tetrasporofite)
Hydroclathrus clathratus
Cystoseira abies-marina
Liagora ceranoides
Ceramium echionotum
Lobophora variegata
Cystoseira compressa
Liagora tetrasporifera
Cottoniella filamentosa
Padina pavonica
Cystoseira foeniculacea
Cianophytes (unidentified)
Cystoseira sp.
Caulerpa webbiana
Dasya baillouviana
Filaments (unidentified)
Dictyota cervicornis
Gelidiopsis intricata
Dictyota crenulata
Herposiphonia secunda
Dictyota dichotoma
Jania adhaerens
Dictyota fasciola
Jania pumila
Dictyota pfaffii
Lophocladia trichoclados
Dictyota sp1.
Polysiphonia furcellata
Dictyota sp2.
Psedochlorodesmis furcellata
Galaxaura rugosa
Pseodotetraspora marina
Hypnea spinella
Sphacelaria cirrosa
Laurencia spp.
Spyridia hypnoides
Pterosiphonia pennata
Wrangelia penicillata
Sargassum desfontainesii Sargassum sp. Stypocaulon scoparium Stypopodium zonale Crustose macroalgae
Crutose coralline algae (unidentified) Lithothamnium coralloides Mesophyllum canariense Pseudolithoderma adriaticum
However to make the analysis simpler, these were grouped in two main levels of wave exposure. As described above in section 2.1, following criteria set out by Pérez et al. (2003) and Yanes et al. (2006), this simplification facilitates the ecological interpretation of results: -
High exposure: sites located on the north and northwest side of the islands and islets, affected by trade winds and swells
from NNE-NE and frequently affected by NNW-NW swells, as well as sites only affected by NNW-NW swells. This exposure is characterized by an annual average wave height of about 3 m. -
Low exposure: sites located on the east, south or southeast side of the islands and islets, normally affected by trade winds waves and sometimes by swells from
Rev. Biol. Trop. (Int. J. Trop. Biol. ISSN-0034-7744) Vol. 56 (Suppl. 3): 229-254, December 2008
233
125 123
Islas Canarias
122 121
Lanzarote 29º
La Palma
46 47 48 45 22 21 44 23 24 25 43 26 27 42 28 41 29 30 31 40 32 33 35 39 34 36 37 38
El Hierro 19 20 18 1 17 23 16 4 5 15 6 7 10 14 8 9 11 12 13
Tenerife 81 80
La Gomera
85 84
62 60 595857 56 6364 61 55 54 65 66 67 53 68 49 50
51 52
Fuerteventura
83 82
69 70
71 72 73
124 120
118 117 105 116 107 115 106 114 113 103 102 110 111 112 109 104 108 101 100
96
79 78 77 76 75
119
86
Gran Canaria
88 87 89 90
99 97
98
74 95 91 92 93
16º
94
10 0 10 20 km
Fig. 1. Study sites across the Canary Islands including Marine Protected Areas (MPAs). Numbers correspond to the different sites listed in Table 2. [Mar Calmas-MPA from 6 to 14; La Palma-MPA from 28 to 37; La Graciosa-MPA from 119 to 125].
NNE-NE but not affected by NNW-NW swells. This exposure is characterized by an annual average wave height of about 1.4 m. In order to contrast sea urchin density and barren cover among islands (I) and degrees of wave exposure (E), we performed distancebased permutational ANOVAs (Anderson 2001) rather than carrying out a traditional univariate ANOVA. In these analyses the F-statistics are calculated but p-values are obtained by permutation, thus avoiding any assumption about the nature of the distribution of the original variables (Anderson 2001, Anderson and ter Braak 2003). A three-way design was performed when analysing urchin density and noncrustose macroalgal cover, in which ‘I, island’ was treated as a fixed factor with seven levels (1: El Hierro; 2: La Palma; 3: La Gomera; 4: Tenerife; 5: Gran Canaria; 6: Fuerteventura; 7: Lanzarote and islets); ‘E, exposure’ as a fixed factor with two levels (1: High exposure and 2: Low exposure); and ‘Site’ as a random factor nested in the interaction ‘I x E’. All analyses were based on Euclidean distances of the original raw data, with all p-values obtained using 4 999 permutations of the appropriate 234
exchangeable units (Anderson and ter Braak 2003). Significant terms in the full model were examined individually using appropriate a posteriori pairwise comparisons. The computer programme PRIMER 6 & PERMANOVA+ (www.primer-e.com) was used to perform the analyses described above. Medium-small scale spatial variation: Influence of depth, sedimentation, rugosity, slope and substratum diversity. To assess spatial variation at a scale of meters, depth and main habitat-complexity variables which recur in the bibliography were identified: (1) sedimentation (Alves et al. 2001, Díez et al. 2003, Erikson and Bergström 2005), (2) topographic complexity or rugosity of the substrate (Luckhurst and Luckhurst 1978, Robert and Ormond 1987, Jennings et al. 1996 McClanahan 1994), (3) slope (Alves et al. 2001, Díez et al. 2003), (4) substratum diversity (Gratwicke and Speight 2005). The effect of each variable on D. aff. antillarum density was tested using field data collected in 1112 belt transects (of 20 m2 each, totaling 22240 m2 of surveyed area) from the 125 sites performed throughout the entire Canarian Archipelago
Rev. Biol. Trop. (Int. J. Trop. Biol. ISSN-0034-7744) Vol. 56 (Suppl. 3): 229-254, December 2008
TABLE 2 List of the surveyed sites in the Canary Islands including wave exposure and mean values and range of Diadema aff. antillarum densities
Mar de Las Calmas-MPA
MPA
La Palma-MPA
LA PALMA
EL HIERRO
Island
Site #
Site name
Wave exposure*
D. aff. antillarum Mean density (N/m2)
Range (N/m2)
1
Baja de Anacón
1
0.13
0.00-0.60
2
Laja de Orchilla
2
0.16
0.00-0.50
3
Punta La Palometa
2
0.01
0.00-0.05
4
Punta de Los Mozos
2
0.07
0.00-0.25
5
Punta de Los Lances
2
0.22
0.05-0.40
6
Punta de Tecorón
2
0.36
0.05-0.95
7
Cueva del Diablo
2
0.20
0.05-0.45
8
Punta de Las Lapillas
2
0.08
0.00-0.35 0.10-0.40
9
Punta de Las Cañas
2
0.21
10
Roque Chico
2
0.03
0.00-0.10
11
La Gabarra
2
0.08
0.00-0.25
12
Punta de Los Frailes
2
0.05
0.00-0.30
13
Cueva de Los Frailes
2
0.03
0.00-0.15
14
La Herradura
2
0.09
0.00-0.25
15
Muelle de La Restinga
2
0.04
0.00-0.15
16
Los Joraditos
1
0.10
0.00-0.30
17
Roque de La Bonanza
1
0.07
0.00-0.25
18
La Caleta
1
0.62
0.00-1.10
19
Tamaduste
1
0.04
0.00-0.15
20
Punta Grande
1
0.80
0.05-2.45
21
Punta Llanadas
1
0.12
0.05-0.20
22
Punta Gorda
1
2.97
0.75-4.10
23
Playa de Las Vinagreras
1
1.77
1.15-2.50
24
Callao Nuevo
1
1.78
0.50-3.40
25
El Roque
1
2.37
1.30-4.05
26
Morro Negro
2
2.55
1.05-3.50
27
La Bombilla
2
3.05
1.40-4.25
28
Punta Bogullos
2
2.96
0.40-5.60
29
El Faro
2
2.92
0.50-6.60
30
Playa de El Remo
2
1.11
0.20-1.80
31
Punta de El Remo
2
1.88
1.15-2.80
32
Punta Banco
2
2.09
0.80-3.45
33
Dos Hermanas
2
0.93
0.50-1.55
34
Los Andenes
2
0.56
0.30-0.85
35
Siete Islas
2
0.15
0.00-0.75
36
La Resbaladera
2
0.77
0.15-1.90
37
Punta Larga
2
0.07
0.00-0.25
38
Fuencaliente (Malpique)
2
6.40
6.40-10.05
39
El Faro de Fuencaliente
2
0.30
0.30-4.20
Rev. Biol. Trop. (Int. J. Trop. Biol. ISSN-0034-7744) Vol. 56 (Suppl. 3): 229-254, December 2008
235
TABLE 2 (Continued) List of the surveyed sites in the Canary Islands including wave exposure and mean values and range of Diadema aff. antillarum densities
TENERIFE
LA GOMERA
LA PALMA
Island
236
MPA
Site #
Site name
Wave exposure*
D. aff. antillarum Mean density (N/m2)
Range (N/m2)
40
Las Cabras
2
0.25
0.00-0.65
41
La Bajita
2
8.20
6.15-10.65
42
Los Cancajos
2
7.92
3.85-11.75
43
Puerto Trigo
2
4.89
1.60-6.85
44
Puerto Paja
1
4.35
0.04-11.60
45
Puerto Espíndola
1
3.32
2.00-4.45
46
La Fajana
1
0.07
0.00-0.20
47
Roque Santo Domingo
1
0.11
0.00-0.40
48
Lomada Grande
1
1.16
0.00-3-85
49
Roque de Iguala
2
2.04
0.55-3.50
50
Punta Narices
2
2.90
0.45-5.50
51
Punta Becerro
2
2.94
0.20-5.35
52
Playa de Suárez
2
3.18
0.05-7.10
53
Punta Los Canarios
1
5.71
1.75-10.60
54
Punta Majona
1
4.03
1.40-7.20
55
Roque de Agulo
1
3.33
3.00-3.95
56
Playa de San Marcos
1
2.57
1.75-3.70
57
Punta Sardina/La Sepultura
1
3.47
2.75-4.55
58
Punta de Los Órganos
1
2.01
1.50-2.80
59
Los Órganos
1
1.43
0.90-2.05
60
Roques de Arguamul
1
2.17
1.75-2.60
61
Playa de Santa Catalina
1
0.01
0.00-0.05
62
Teno
2
6.34
2.65-9.90
63
Masca
2
7.64
5.95-10.15
64
Los Gigantes
2
6.03
3.40-9.55
65
El Acuario
2
5.12
3.05-10.25
66
Cueva de Los Cerebros
2
5.65
1.35-10.35
67
La Tixera
2
5.84
4.55-8.35
68
La Caleta
2
6.46
3.75-11.50
69
El Balito
2
7.51
5.05-9.65
70
El Palm-Mar
2
5.62
3.50-8.15
71
Punta Rasca
2
3.95
2.65-5.50
72
Las Galletas
2
5.17
3.35-6.55
73
Agua Dulce
2
5.96
4.70-7.10
74
La Tejita
2
4.84
2.25-7.35
75
La Jaquita
2
13.57
6.35-17.45
76
Abades
2
9.07
4.60-12.20
77
El Porís de Abona
2
4.58
2.70-7.80
78
Punta Prieta
2
8.75
7.85-10.60
Rev. Biol. Trop. (Int. J. Trop. Biol. ISSN-0034-7744) Vol. 56 (Suppl. 3): 229-254, December 2008
TABLE 2 (Continued) List of the surveyed sites in the Canary Islands including wave exposure and mean values and range of Diadema aff. antillarum densities
LANZAROTE and ISLETS
FUERTEVENTURA
GRAN CANARIA
TENERIFE
Island
MPA
Site #
Site name
Wave exposure*
D. aff. antillarum Mean density (N/m2)
Range (N/m2)
79
Boca Cangrejo
2
6.06
3.24-8.20
80
Punta Hidalgo
1
0.00
0.00-0.00
81
Punta Hidalgo 2
1
4.21
2.00-5.60
82
Martiánez
1
8.48
6.10-11.25
83
La Rapadura
1
4.41
3.25-5.25
84
La Consolación
1
3.77
1.70-5.50
85
La Hondura
1
5.17
2.55-7.05
86
Punta El Cardonal
1
3.37
2.60-4.10
87
El Juncal
1
1.76
1.15-2.50
88
Punta del Tumas
1
0.97
0.75-1.35
89
Playa de Las Nieves
1
0.36
0.00-0.85
90
Muñón de Dios
1
1.06
0.15-2.30
91
Punta del Tarajalillo
2
0.30
0.10-0.40
92
Playa Corral del Espino
2
2.45
0.50-3.95
93
Puntilla de La Caleta
2
2.33
1.60-3.00
94
Playa de La Caleta
2
2.27
0.45-4.35
95
Las Casillas
2
0.73
0.10-1.15
96
Ajúi
1
0.06
0.00-0.15
97
Punta de Jandía
1
0.00
0.00-0.00
98
Jinijinamar
2
1.05
0.00-2.30
99
Jacomar
2
4.39
3.10-6.40
100
El Queso
2
0.02
0.00-0.15
101
El Marrajito
2
0.06
0.00-0.25
102
Baja de Fefo
2
5.79
3.20-9.65
103
El Calamareo
2
3.01
1.45-6.25
104
Veril del Morrajo
2
1.41
0.00-4.90
105
El Golfo
1
0.04
0.00-0.15
106
Punta Limones
2
4.31
2.80-6.00
107
Playa Flamingo
2
3.77
3.00-6.00
108
El Pasito
2
2.00
0.90-4.70
109
Puntagorda
2
3.54
2.60-4.60
110
Puerto Calero
2
2.97
1.10-5.25
111
Puerto del Carmen (sur)
2
6.98
2.00-13.30
112
Puerto del Carmen
2
5.78
3.65-8.60
113
Playa de Los Pocillos
2
3.86
3.30-4.25
114
Hoyas Hondas
2
1.07
0.50-1.80
115
Playa Matagorda
2
3.63
2.95-4.55
116
Playa Honda
1
3.18
2.50-4.00
117
Los Cocoteros
1
7.05
4.70-8.90
Rev. Biol. Trop. (Int. J. Trop. Biol. ISSN-0034-7744) Vol. 56 (Suppl. 3): 229-254, December 2008
237
TABLE 2 (Continued) List of the surveyed sites in the Canary Islands including wave exposure and mean values and range of Diadema aff. antillarum densities
MPA
La Graciosa-MPA
LANZAROTE and ISLETS
Island
Site #
Site name
Wave exposure*
D. aff. antillarum Mean density (N/m2)
Range (N/m2)
118
Mala
1
5.70
4.00-7.70
119
Punta Fariones
1
2.76
0.00-4.80
120
Caleta del Sebo
2
0.16
0.00-1.00
121
Montaña Amarilla
2
3.72
2.10-5.60
122
Cuevas Coloradas
2
6.19
3.90-10.30
123
Punta La Mareta
2
6.55
3.80-9.20
124
Roque del Este (sur)
2
1.12
0.00-4.40
125
Roque del Este (Norte)
1
0.03
0.00-0.15
*Wave exposure: 1 = highly exposed sites, always affected by waves and swell (NE-NNE) and periodically exposed to NNW swells; 2 = lesser exposed sites or thoses exposed only to NNE waves. At least 160 m2 of area sampled at each site. All sites were used in the analysis of small and large scale spatial variation.
(Fig. 1). The habitat-complexity variables were described as follows: -
-
-
-
Sedimentation: measured as the percentage of sand over the rocky substrate and categorized from 1 to 4: (1) 0%; (2) 1 to 10%; (3) 10 to 20%; and (4) more than 20%. Rugosity: measured as the ratio of actual surface area in relation to linear surface area (belt transect size: 20 m²): (1) flat surface; (2) less than 1m; (3) between 1 and 3m; and (4) high relief more than 3 m. Slope: measured as the inclination of the substrate in degrees. (1) 0˚; (2) from 0˚ to 45˚; (3) more than 45˚ and less than 90º; and (4) 90˚. Substrate diversity: evaluated as the substrate type or combination of substrata found in belt transects. We categorized them as: (1) bed rock substrate; (2) boulder substrate between 5 and 100 cm; (3) a combination of bed rock and boulder substrate.
In order to assess the influence of habitatcomplexity variables on sea urchin density, we performed distance-based permutational 238
ANOVAs (Anderson 2001). A three-way design was performed when analysing urchin density and biomass, in which ‘Island’ I was treated as a fixed factor with seven levels, grouped by geographic location from west to east (1: El Hierro; 2: La Palma; 3: La Gomera; 4: Tenerife; 5: Gran Canaria; 6: Fuerteventura; 7: Lanzarote and islets). Habitat complexity variables were treated as fixed factors with four levels each for ‘Sand’ (S), ‘Rugosity’ (R) and ‘Slope’ (S) and three levels for ‘Substrate diversity’ (SD). ‘Site’ was treated as a random factor nested within the interaction ‘Island x habitat complexity variable’. RESULTS Influence of sea urchin populations on algal assemblages throughout the Canary Islands A highly significant log-linear relationship was detected between sea urchin D. aff. antillarum density and non-crustose macroalgal cover (Fig. 2). The scatter plot of sea urchin density versus non-crustose macroalgal cover showed more variability in percentage
Rev. Biol. Trop. (Int. J. Trop. Biol. ISSN-0034-7744) Vol. 56 (Suppl. 3): 229-254, December 2008
Macroalgae cover (%)
100 Non-crustose macroalgae
80
Crustose macroalgae Turf Unbranched erect Branched erect Calcified erect
60 y = -7.871 In(x) + 28.216 R2 = 0.441 P