Information Embedding and Extraction for Electrophotographic Printing Processes Aravind K. Mikkilinenia , Pei-Ju Chiangb , Sungjoo Suha George T. C. Chiub , Jan P. Allebacha , Edward J. Delpa a School
of Electrical and Computer Engineering of Mechanical Engineering Purdue University, West Lafayette, Indiana USA b School
ABSTRACT In today’s digital world securing different forms of content is very important in terms of protecting copyright and verifying authenticity. One example is watermarking of digital audio and images. We believe that a marking scheme analogous to digital watermarking but for documents is very important. In this paper we describe the use of laser amplitude modulation in electrophotographic printers to embed information in a text document. In particular we describe an embedding and detection process which allows the embedding of 1 bit in a single line of text. For a typical 12 point document, 33 bits can be embedded per page. Keywords: document security, secure printing, printer identification
1. INTRODUCTION In today’s digital world securing different forms of content is very important in terms of protecting copyright and verifying authenticity.1–7 One example is watermarking of digital audio and images. We believe that a marking scheme analogous to digital watermarking but for documents is very important.1 Printed material is a direct accessory to many criminal and terrorist acts. Examples include forgery or alteration of documents used for purposes of identity, security, or recording transactions. In addition, printed material may be used in the course of conducting illicit or terrorist activities. Examples include instruction manuals, team rosters, meeting notes, and correspondence. In both cases, the ability to identify the device or type of device used to print the material in question would provide a valuable aid for law enforcement and intelligence agencies. We also believe that average users need to be able to print secure documents, for example boarding passes and bank transactions. There currently exist techniques to secure documents such as bank notes using paper watermarks, security fibers, holograms, or special inks.8, 9 The problem is that the use of these security techniques can be cost prohibitive. Most of these techniques either require special equipment to embed the security features, or are simply too expensive for an average consumer. Additionally, there are a number of applications in which it is desirable to be able to identify the technology, manufacturer, model, or even specific unit that was used to print a given document. We propose to develop two strategies for printer identification based on examining a printed document. The first strategy is passive. It involves characterizing the printer by finding intrinsic features in the printed document that are characteristic of that particular printer, model, or manufacturer’s products. We refer to this as the intrinsic signature. The intrinsic signature requires an understanding and modeling of the printer mechanism, and the development of analysis tools for the detection of the signature in a printed page with arbitrary content. The second strategy is active. We embed an extrinsic signature in a printed page. This signature is generated by modulating the process parameters in the printer mechanism to encode identifying information such as the printer serial number and date of printing. To detect the extrinsic signature we use the tools developed This research was supported by a grant from the National Science Foundation, under Award Number 0219893. Address all correspondence to E. J. Delp at
[email protected]
for intrinsic signature detection. We have successfully been able to embed information into a document with electrophotographic (EP) printers by modulating an intrinsic feature known as “banding”.10 We have previously reported techniques that use the print quality defect known as banding in electrophotographic (EP) printers as an intrinsic signature to identify the model and manufacturer of the printer.11–13 We showed that different printers have different sets of banding frequencies which are dependent upon brand and model. This feature is relatively easy to estimate from documents with large midtone regions. However, it is difficult to estimate the banding frequencies from text. The reason for this is that the banding is present in only the process direction and in printed areas. The text acts as a high energy noise source upon which the low energy banding signal is added. One solution which we have previously reported in14–16 is to find a feature or set of features which can be measured over smaller regions of the document such as individual text characters. If the print quality defects are modeled as a texture in the printed areas of the document then texture features can be used to classify the document. These types of features can be more easily measured over small areas such as inside a text character. A similar technique is also described in17 for identifying ink jet printers. Embedding extrinsic features into the document also requires knowledge of the specific print mechanism. During the past few years, many techniques to reduce banding artifacts have been successfully demonstrated by modulating various process parameters such as laser intensity/timing/pulse width (exposure modulation),18 motor control,19 and laser beam steering.20 These techniques can also be used to inject “artificial” banding signals that are not intrinsic to the printer. The technological understanding and capability to implement these techniques are not easily obtained meaning it will be difficult for someone to “hack” it. One issue with embedding extrinsic signatures is that the information should not be detectable by the human observer but needs to be detectable by suitable detection algorithms.10 This can be accomplished by exploiting the band-pass characteristics of the human visual system with regard to contrast sensitivity. An HP Color LaserJet 4500 is used as the experimental platform for this study. Although a color engine is used as the experimental system, we will be focused only on the monochrome results for this study. Previously we have demonstrated this ability to embed an extrinsic signature in documents which contain halftone images.10 In the following sections we will present our current work on embedding in documents containing only text. Some preliminary work on this topic has been presented in.21 Building upon those results we will present an embedding and detection scheme which allows us to realiably embed 1 bit in a line of text.
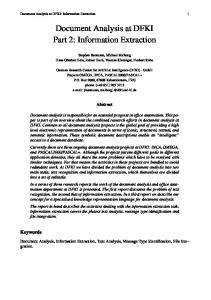
2. EP EMBEDDING TECHNIQUES Figure 1 shows a side view of a typical EP printer. The print process has six steps. The first step is to uniformly charge the optical photoconductor (OPC) drum. Next a laser scans the drum and discharges specific locations on the drum. This is the “exposure” step. The discharged locations on the drum attract toner particles which are then attracted to the paper which has an opposite charge. Next the paper with the toner particles on it passes through a fuser and pressure roller which melts and permanently affixes the toner to the paper. Finally a blade or brush cleans any excess toner from the OPC drum. In EP printing, artifacts are created in the printed output due to electromechanical imperfections in the printer such as fluctuations in the angular velocity of the OPC drum, gear eccentricity, gear backlash, and polygon mirror wobble. In previous work we have shown that these imperfections are directly related to the electromechanical properties of the printer. This property allows the corresponding fluctuations in the developed toner on the printed page to be treated as an intrinsic signature of the printer. The most visible print quality defect in the EP process is banding, which appears as cyclic light and dark bands most visible in midtone regions of the document. Many banding reduction techniques have been successfully demonstrated. These techniques, three of which are laser intensity/timing/pulse width,18 motor control,19 and laser beam steering,20 actively modulate certain process parameters. It is desirable to inject signals with high spatial frequency where the human visual system has relative low contrast sensitivity. Among the methods mentioned above, motor control has difficulty controlling the EP process at high spatial frequencies due to inherent electro-mechanical limitations. Laser beam steering requires additional
Charge Roller
Cleaning Blade
Laser Beam
A F B
Fuser Roller
Fused Toner Particles
OPC Drum E
Developer Roller C
D
Paper
Pressure Roller
Process Direction Transfer Roller
Figure 1. Diagram of the EP process: (A) charging, (B) exposure, (C) development, (D) transfer, (E) fusing, (F) cleaning
Laser Intensity
Modulation Signal
Laser
OPC Voltage
Exposure
Document
Contrast (Dot Size)
Figure 2. Process block diagram for embedding extrinsic banding signature using laser intensity modulation
process capability that is not found in typical EP engines. However, modulating various laser parameters to affect exposure, such as laser power, is common practice in typical EP process controls. As we have shown in,10 these techniques can be used to inject an “artificial” banding signal into the document. In particular, we presented a system shown in Figure 2 using laser intensity modulation which allowed per-scanline changes in laser intensity. The signals used for embedding include a set of sinusoids at various frequencies and amplitudes such that they lie below the human visual sensitivity threshold curve. If the embedded document has any large midtone gray patches, the signal is easily detectable using Fourier analysis techniques. See Figure 3. A similar technique can be used to embed information in text. In the next few sections, our embedding and detection techniques for text will be presented.
3. RELATIONSHIP BETWEEN LASER POWER AND EXPOSURE During the EP printing process, the image to appear on paper is first written onto an OPC drum by a laser. The intensity profile of the laser beam is modeled as a 2-D Gaussian envelope,22, 23 which is given by 2
y I(x, y, t) = I0 (t) exp(− 2α 2 −
x2 2β 2 )
W m2
(1)
where I0 (t) represents the laser power, and α and β are the standard deviations of the laser beam profile in the process y and scan x directions respectively. Assume the laser is switched on at time t = 0 and off at time
Modulation Signal
Document
Projection or Edge Analysis
Process Direction
Figure 3. Embedding and detecting extrinsic banding signal
Figure 4. Laser power profile
t = tof f and the rise and fall transition are modeled as an exponential function, see Figure 4. Then the laser power can be expressed as 0 , t tof f Imax (1 − e tr )e
where Imax is the maximum allowable laser power. This parameter, Imax , is directly related to and controlled by a voltage Vref on the driver chip of the laser and is not shown in the equations. Let the nominal values of the printed pixel width in the scan direction and process direction be X and Y , respectively. Assume the laser beam translates along the scan direction x at a velocity V which is extremely high compared with the motion of the photoconductor surface. Then the exposure energy at any arbitrary point (x, y) due to the pixel [m, n] being turned on is found by integrating Equation 2 with respect to time. Emn (x, y) =
Z
Ã
(x − (xm − X2 ) − V t)2 (y − yn )2 I0 (t) exp − − 2α2 2β 2
!
dt
J m2
(3)
Since the exposure of each printed pixel is additive, the overall exposure at any given point on the OPC is the sum of exposures contributed from each neighboring pixel. E(x, y) =
X
Emn (x, y)
(4)
m,n
The exposure can be controlled by adjusting Imax (amplitude modulation), or adjusting the duration of the laser pulses (pulse width modulation or PWM).18 Both methods control I0 (t), the laser power. In this study, we used amplitude modulation to control exposure. As shown in Figure 4, when Imax is increased, the laser power I0 (t) and the total exposure energy are also increased. After the photoconductor is exposed by the laser beam, a latent image is produced on the photoconductor surface. Charged toner particles are attracted to the latent image and then transferred and fused to the paper. Based on the discharged electric potential, the tone value adhered on the photoconductor can be estimated. Here the photoconductor surface voltage after exposure, the light voltage VL ,22 can be written as ³ ´ VL = Vsat + (VD − Vsat ) exp − EEa V olts (5)
where Vsat is the voltage obtained for very high exposure energy, VD is the dark voltage, E is the exposure energy, and Ea is the energy constant that describes the sensitivity of the photoconductor. By modulating the
(a) Dot profiles for different Vref
(b) Dot size versus Vref
Figure 5. Effect of Vref on dot size
laser power, the exposure energy and the associated photoconductor contrast voltage are modulated, with the results being varying dot sizes. As mentioned earlier in this section, modulation of the laser power is performed through modulation of the voltage Vref . For our test printer, the nominal value for Vref is 1.5V. The allowable range for Vref is from 1.0V to 2.0V. Figure 5(a) shows the average dot profile of 16 dots when Vref is held constant at 1.1, 1.3, 1.5 and 1.7 volts. Figure 5(b) shows relationship between the input voltages and dot sizes. The dot size is determined by counting the number of pixels with absorptance greater than 0.1 in one dot cell. As the input voltage increases, the dot size increases. However, as seen in Figure 5(b), instabilities in the EP process cause variations in the dot sizes developed on the paper. This behaviour can create the potential for ambiguity if the chosen detection technique relies heavily on particular embedding levels or dot sizes.
4. LASER MODULATION FOR TEXT In the following sections we will consider modulating Vref with sinusoidal functions. Because Vref has a DC bias of 1.5V, we will consider instead the voltage Vmod , such that Vref (y) = 0.5 ∗ Vmod (y) + 1.5
(6)
where y is the current scanline in the process direction. Using this notation we can consider signals of the type µ ¶ 2πf y Vmod (y) = Asin (7) Rp with amplitude Aǫ[0, 1], frequency f cycles/inch, and native printer resolution Rp cycles/inch, without worrying about the actual voltages being sent to the printer. In21 we derived relationships between embedding amplitude/frequency and human perceptibility for sinusoidal embedding in halftone images using this amplitude modulation technique. Because the printed area comprising a text character is already saturated, any slight variation in exposure will not make it perceptibly darker or lighter. On the other hand, certain turn on and turn off behaviours of the laser under different exposure settings cause a different artifact on the edges of the text characters which will be used to gague perceptibility of the embedded signal.
Determining R_60 Edge Location : Sample Points
BN Reflectance
0
Area of Interest
B
1.0 0.8 0.6
R60 0.4
Interpolate r(y)
0.2
B1
0
0
1
2
3
4
5
6
7
8
Pixel Position Figure 6. Large amplitude exposure modulation. 1st line no modulation, 2nd line 20 cycles/in, 3rd line 40 cycles/in
Figure 7. Determination of the R60 transition point
4.1. The Effects of Laser Intensity Modulation Figure 6 shows the effect of modulating laser intensity in different types of images. The first line is printed without any modulation, Vmod =0. The second is modulated with a sinusoidal signals of the form in Equation 6 with frequency 20 cycles/in and amplitude 1. The third line is also modulated with a sinusoidal signal, but with frequency 40 cycles/in and amplitude 1. These signals can be easily seen in the halftone patches of Figure 6. This is because the frequency/amplitude combination of the signals are above the threshold developed in21 below which human perceptibility is low. However, this same signal is not perceptible in the interior region of the text characters of Figure 6 because of the saturation. This is not true for the edges of the text characters, specifically the left and right edges where the existence of the embedded signal is clearly seen in the enlarged character ‘I’ from the third line. This is partially due to the small change in laser turn on and turn off time with respect to laser power as shown in Figure 4 as well as higher order behaviours of the laser control circuitry which are currently being investigated for inclusion into our model.
4.2. Modulation Parameters and Image Quality Some measure of image quality must be used to determine what embedding parameters will produce printed output in which the embedded signal is not easily visible. Since the visible distortion affects only the edges of the characters, the metric chosen is a “raggedness” measure defined by ISO-13660.24 This standard defines the edge contour of a line to be the 60% transition from substrate reflectance to the colorant reflectance, as given by the following equation: R60 = Rmax − 0.6(Rmax − Rmin )
(8)
where Rmax is the maximum reflectance of the substrate and Rmin is the minimum reflectance of the colorant. The edge contour r(y) is found by estimating the locations of these R60 transition points on a per scan line basis. To find r(y) for the region of interest (ROI) outlined in Figure 6, the R60 transition point for each scanline is estimated by linear interpolation between the two closest pixel values as shown in Figure 7. An ideal straight line is fitted in the least-squares sense to the contour of the printed edge. The raggedness is then defined as the geometric distortion of the edge profile from an ideal straight line defined as the standard deviation of the residuals of the R60 profile to the fitted straight line. To obtain the mapping between modulation amplitude A and the resulting raggedness, a test page composed of 8 letter ‘I’s with 12 pt Arial font, is designed and printed with modulation frequencies in the range of 20160 cycle/inch in 20 cycle/inch increments. For each frequency, each test page is printed with one modulation amplitude A from 0.2 to 1.0 volts. Additionally, one test page is printed with no modulation to provide a baseline measure of raggedness.
0
5
i
t
h
i
t
h
m
o
d
u
l
a
t
i
o
n
w
o
u
t
m
o
d
u
l
a
t
i
o
n
w
1
4
0
3
0
2
0
.
0
V
)
m
0
(
.
8
V
u
s
s
e
d
Modulation Signal
n
0
.
6
V
e
g
g
BN R
a
0
.
4
V
B
0
1
0
B1 0
.
2
BN
V
B0
0
2
0
4
0
6
0
8
0
1
0
0
1
2
0
1
4
0
1
6
0
B1 F
r
e
q
u
e
n
c
y
(
c
y
c
l
e
s
/
i
n
)
Figure 8. Relation between amplitude modulation parameters and raggedness
is fashion, you. I had a steps unlike patrongly upon his of an evidence.” ”It yebrown secrecy was hair suggested. morning. ”It is Sherlocked that them it, when yourself clearned it in the slipper name ever her on the leventual important,
Figure 9. Modulation scheme for text documents
Each page is scanned at 600dpi and edge segments of 60 samples are hand segmented from each character. The raggedness of each of these edges is found and averaged over the entire test page. These measurements are plotted in Figure 8 along with the baseline raggedness which is shown as a dashed line. If the modulation parameters are chosen such that the resulting raggedness is less than the baseline raggedness, then it should be difficult to visually distinguish an edge with embedding from one without. From Figure 8 we can see that if A ≤ 0.2, then a wide range of frequencies can be chosen while preserving edge quality.
5. EMBEDDING AND DETECTION Each line of text in a document is treated as a signaling period during which one of three symbols is transmitted. These symbols, Vmod = {BN , B0 , B1 }, are defined in Equations 9-11. In these equations, y is the current scan line number in the process direction relative to the first scanline in a line of text. Rp is the resolution of the printer in scanlines per inch. B0 and B1 , which can be considered 0 and 1 bits respectively, are square waves with frequencies f0 and f1 respectively defined in cycles/inch, and amplitude Aǫ[0, 1]. The periods of these signals are T0p and T1p scanlines respectively in terms of printer resolution Rp . BN is the null signal with which no laser modulation is performed. This will be used to allow the detector to estimate certain channel parameters. BN (y) = 0 ¶¶ µ µ 2πf0 y B0 (y) = A ∗ sign sin Rp µ µ ¶¶ 2πf1 y B1 (y) = A ∗ sign sin Rp
(9) (10) (11)
The reason for using a square instead of a sinusoidal signal is to escape the dot size instability shown in Figure 5(b). The dot size variations shown were measured for dots separated by a relatively large distance compared to the dot size, as would be the case in a halftone. On the edge of a text character these dots will be very close together, 1/600in for a 600dpi printer. At this distance, electrostatic forces may cause interaction between the toner particles which make up these dots. This interaction could affect the dot sizes before the toner is fixed to the paper in the fusing step. Figure 8 implies that a wide range of frequencies are available for embedding when A ≤ 0.2. This range is not fully usable and is bounded by other variables related to the document being printed, the printer, and the scanner used for detection. The font size of the document will impart a lower bound on the usable frequency
is fashion, you. I patrongly upon his yebrown secrecy w Scanned Text
Extract Vertical Edges
Extract Characters
Extract Textlines
0
1
Decoded Symbols
Decision Matrix
ρ
l
ρ l
Correlator Bank
rl,c (y)
Edge Projection or Profile
Figure 10. Process for extracting embedded information
range. If the document font size is f s points and the print process resolution is Rp , then the longest vertical edge possible on a character is Lmax = Rp f72s
scanlines inch
(12)
Since we want to be able to detect these signals from the edges of both upper and lowercase characters, this length is further reduced by 2/3. The lowest usable frequency to ensure at least one cycle is present in each character with a full vertical edge is then fmin =
Rp 1 3 Lmax
=3
³
72 fs
´
cycles inch
(13)
The embedding frequency is also upper bounded by the combined modulation transfer function (MTF) of the printer and scanner. The embedding scheme used will be BN Bx By , x, yǫ{0, 1}, as shown in Figure 9. Every three lines will carry one null symbol and two information symbols. The null symbol BN is important because the characteristics of our channel will change as a function of location in the process direction. This is due to various cyclic print quality defects such as low frequency banding and ghosting which can change the average graylevel value of each line of text and which may interfere with our chosen embedding frequencies and signal designs. Ghosting, in addition, can cause ghosts or attenuated copies of signals embedded in a text line to appear in subsequent lines further down the page. The decoding process to extract and decode the embedded signals is outlined in Figure 10. First the document is scanned at some scan resolution Rs . Individual lines of text are then extracted and processed individually in the following blocks to determine what symbol was embedded in it. All characters in the line of text are segmented out using techniques developed in.11 Each character is then filtered using a threshold edge detector and a morphological dilation operation to find all the left edges of the s characters. See Figure 11. Any vertical path which is marked as an edge and is less than αTmax is removed, s is the larger of T0s and T1s . Txs is the corresponding number of samples per inch for frequencies f0 where Tmax and f1 at the scan resolution Rs . What remains is every vertical edge which contains at least α periods of the s lowest frequency signal. Currently α is chosen such that αTmax is equal to the height of a lower case character for a given font size f s. This means 1 Lmax (14) α = 3s Tmax Rs If a character has at least one vertical edge, then an edge profile is estimated from the leftmost edge using the technique outlined in Section 4. The extracted signal is normalized to lie between −1 and 1. In the notation
O
C
r
h
a
i
g
i
r
a
n
a
c
l
t
e
C
r
h
a
M
r
a
a
c
s
t
e
r
e
L
k
E
d
f
g
t
e
S
s
u
E
i
d
t
a
g
b
e
l
e
s
O
P
i
x
r
e
i
l
g
i
V
n
a
a
l
l
u
E
e
s
g
d
r
P
o
e
f
i
l
e
1
0.8
0.6
0.4
0.2
0
-1
-0.2
-0.4
-0.6
-0.8
0 5 10 15 20 25 30 35 40
Figure 11. Process steps to find edges from which to extract edge profile
rl,c (y), l is the text line number and c is the character position on that text line from which this signal is obtained. Also let Cl be the set of character positions on line l from which these signals have been extracted. Each rl,c (y) is then correlated with the original embedding signals using M ≤ Ll,c samples, where M = nTmax and n is the largest integer satisfying nTmax ≤ Ll,c . This ensures orthogonality between the two signals assuming the two frequencies chosen are such that f1 = 2f0 . The exact phase of each rl,c are not known, so the correlations performed are the maximum among all phases. ρ0l,c =
ρ1l,c
=
max
0≤θ≤Tmax
max
0≤θ≤Tmax
M 1 X rl,c [i]B0 [(i + θ) mod Tmax ] M i=1 M 1 X rl,c [i]B1 [(i + θ) mod Tmax ] M i=1
(15)
(16)
Finally, if the line number l satisfies (l − 1) mod 3 = 0, then according to the embedding model BN was embedded in it. If this is the case, then two thresholds, γl0 and γl1 , are defined as baseline correlation values for the following two lines l + 1 and l + 2. 0 0 γl0 = γl+1 = γl+2 =
1 X 0 ρl,c |Cl |
(17)
cǫCl
1 1 γl1 = γl+1 = γl+2 =
1 X 1 ρl,c |Cl |
(18)
cǫCl
If the text line number l does not correspond to a line with BN embedded, then a majority vote of each of the individual character correlations compared with the baseline correlation values defined above, decides the symbol which was embedded. This is done by first finding the percentage of characters in line l with correlations ρ0l,m and ρ1l,m greater than γl0 and γl1 respectively as defined in Equations 19 and 20. The relationships between these correlations then decides the embedded symbol as defined in Equation 21. p0l =
1 X 1{ρ0l,c >γl0 } |Cl |
(19)
cǫCl
p1l =
1 X 1{ρ1l,c >γl1 } |Cl | cǫCl
(20)
Table 1. Decoding error at character level (%)
(f0 /f1 )\A 15/30 30/60 60/120
0.1V 3.6 7.9 14.5
0.2V 0.2 2.1 8.2
Table 2. Decoding error at line level; Symbol error for current embedding model (%)
0.3V 0.0 0.2 3.0
(f0 /f1 )\A 15/30 30/60 60/120
(p0l > p1l ) , B0 ˆ (p0l < p1l ) , B1 B= otherwise , BN
0.1V 12.1 3.0 36.4
0.2V 3.0 0.0 6.1
0.3V 0.0 0.0 3.0
(21)
6. RESULTS
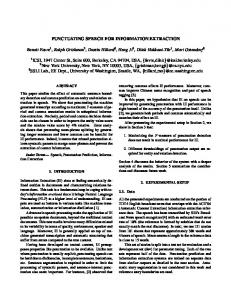
To test the technique presented in Section 5, we use a page of text from a random document generated by our forensic monkey text generator (FMTG).11 These documents are written in PostScript using a 12 point Times Roman font. A page of text is printed for each of nine different combinations of f0 , f1 , and A. (f0 , f1 ) are chosen from the set {(15, 30), (30, 60), (60, 120)}, and A is chosen from the set {0.1V, 0.2V, 0.3V }. The pattern embedded is BN B0 B0 BN B0 B1 BN B1 B0 BN B1 B1 . The results for each of these embedding parameters are shown in Tables 1 and 2. Let us first consider the underlying error rate at the character level. For each pair of embedding frequencies, as the embedding amplitude increases, the probability of error decreases. For a fixed amplitude, the probability of error increases as the embedding frequency increases. This can be attributed to the MTF of the printer which causes a decrease in measured signal power for higher frequencies. Assuming that every text line has the same number of characters and that the underlying character decoding errors are uniformly distributed throughout the document, the underlying character level error probabilities should have the same trend as the line level probabilities. As shown in Table 2 this does not appear to be the case. In a typical text document, such as those generated by the FMTG, every line of text has a different number of characters in it. The most obvious instance of this is the last line of a paragraph, which is typically less than a full page or column width across. The assumption that the character decoding errors are uniformly distributed spatially is also incorrect because of the cyclic nature of the print quality defects. Also, for the lower 15 cycle/inch frequency, not all characters with straight edges will have at least one cycle in it. According to Equation 13, for a 12 point font size, the minimum usable frequency is 18 cycles/inch. Because of this, fewer characters were usable in the decision process. Specifically, for the results shown in Tables 1 and 2, the decoder chose about 616 characters from the test document when f0 = 15, compared to about 970 characters for each of the other cases. Figure 12 shows p0l , p1l , and the decision value p0l − p1l for each line in the text document for two different sets of embedding parameters. Both plots clearly show greater ambiguity in deciding the embedded values for the higher frequency pair. It is reasonable to expect that the 60 cycle/inch signal would perform as well in both cases, but clearly this is not the case since p1l has much greater variance in Figure 12(a) and p0l in Figure 12(b).
7. CONCLUSIONS Using laser amplitude modulation and the process outlined in Figure 10 we have demonstrated the ability to embed 2 bits in every three lines of text. For a 12 point document this means about 33 bits per page of text. There are some simple changes which can be made to the proposed process which should greatly improve the detection accuracy. In Section 5 it was mentioned that the reason to have a line with BN , or no modulation, was to “normalize” the detector to account for any changes, such as graylevel, which can change in the process direction. Clearly since this training symbol is not on the same line as the two other information symbols, the detector does not have exact knowledge of the print characteristics on the following lines. One possibility which we are investigating is to embed BN in the first few characters of a line of text and embed the remaining
: % voting for B0 : % voting for B1
Plot of p0l and p1l
0 l
1 0.8 Percent > γ
Percent > γ
0.8 0.6 0.4 0.2 0
5
10
15
20 25 30 Text line number
35
40
45
0.4
0
50
B0 B0
B0
B0
B0
B0 B0 B0
B0
B0
B0 B0
B0
B0 Decide B0
-0.5
B1 0
5
B1 10
B1 B1 15
B1 B1 B1
10
15
20 25 30 Text line number
35
40
45
50
1 l
Plot of (p - p )
0 B1
5
1
B1 B1
20 25 30 Text line number
B1
B1 B1
B1 35
40
B1 45
B1
Decide B1
Difference
B0 B0 B0
0.5
0
0 l
Plot of (p0l - p1l)
Difference
0.6
0.2
0
1
-1
: % voting for B0 : % voting for B1
1 l
Plot of p and p
1
0.5 B0
B0
B0
B0 B0 B0
B0 B0
B0 B0
B0
B0 B0
B0 0 B1 -0.5
B1
B1 B1 B1
B1
B1 B1 B1 B1
B0 B1
Decide B0
B1 B1
Decide B1
B1 B1 B1
-1
0
50
(a) Line level results for (f0 , f1 ) = (30, 60), A = 0.2
B0 B1
5
10
15
20 25 30 Text line number
35
40
45
50
(b) Line level results for (f0 , f1 ) = (60, 120), A = 0.2
Figure 12. Line level results for two sets of embedding parameters. Embedded value is labeled on second plot showing what was decoded.
characters with the desired symbol BX . This ensures that the detector knows the print characteristics for the exact line that B0 or B1 is embedded in. There are a few issues which were pointed out in Section 6 which will be further investigated to improve the system performance. First, a more formal characterization of the embedding channel needs to be performed. The effects of the intrinsic banding frequency of the printer, as well as ghosting need to be modelled to understand exactly why and where certain errors are occurring. Secondly, a more precise model of the laser behaviour is currently being developed. Our current embedder introduces a shift in the dot position for varying laser power. If the cause of this shift can be determined and modeled, we may be able to detach the two from one another and increase the degrees of freedom of our embedder by being able to control both independently. We are currently in the process of modifying many other types of EP printers to accept our embedding system and will be investigating the performance of this embedding process using these printers.
REFERENCES 1. E. J. Delp, “Is your document safe: An overview of document and print security,” Proceedings of the IS&T International Conference on Non-Impact Printing, San Diego, California, September 2002. 2. A. M. Eskicioglu and E. J. Delp, “An overview of multimedia content protection in consumer electronics devices,” Signal Processing : Image Communication, vol. 16, pp. 681–699, 2001. 3. A. M. Eskicioglu, J. Town, and E. J. Delp, “Security of digital entertainment content from creation to consumption,” Signal Processing : Image Communication, vol. 18, no. 4, pp. 237–262, April 2003. 4. C. I. Podilchuk and E. J. Delp, “Digital watermarking: Algorithms and applications,” IEEE Signal Processing Magazine, vol. 18, no. 4, pp. 33–46, July 2001. 5. M. Barni, C. I. Podilchuk, F. Bartolini, and E. J. Delp, “Watermark embedding: hiding a signal within a cover image,” IEEE Communications Magazine, vol. 39, no. 8, pp. 102–108, August 2001. 6. B. Macq, J. Dittmann, and E. J. Delp, “Benchmarking of image watermarking algorithms for digital rights management,” Proceedings of the IEEE, 2004, to appear in. 7. R. W. Wolfgang, C. I. Podilchuk, and E. J. Delp, “Perceptual watermarks for digital images and video,” Proceedings of the IEEE, vol. 87, no. 7, July 1999, pp. 1108–1126.
8. R. L. van Renesse, “Paper based document security - a review,” IEE European Conference on Security and Detection, no. 437, pp. 75–80, April 1997. 9. R. L. Renesse, Optical Document Security. Boston: Artech House, 1998. 10. P.-J. Chiang, G. N. Ali, A. K. Mikkilineni, G. T.-C. Chiu, J. P. Allebach, and E. J. Delp, “Extrinsic signatures embedding using exposure modulation for information hiding and secure printing in electrophotographic devices,” Proceedings of the IS&T’s NIP20: International Conference on Digital Printing Technologies, vol. 20, Salt Lake City, UT, October/November 2004, pp. 295–300. 11. A. K. Mikkilineni, G. N. Ali, P.-J. Chiang, G. T. Chiu, J. P. Allebach, and E. J. Delp, “Signature-embedding in printed documents for security and forensic applications,” Proceedings of the SPIE International Conference on Security, Steganography, and Watermarking of Multimedia Contents VI, vol. 5306, San Jose, CA, January 2004, pp. 455–466. 12. G. N. Ali, P.-J. Chiang, A. K. Mikkilineni, J. P. Allebach, G. T. Chiu, and E. J. Delp, “Intrinsic and extrinsic signatures for information hiding and secure printing with electrophotographic devices,” Proceedings of the IS&T’s NIP19: International Conference on Digital Printing Technologies, vol. 19, New Orleans, LA, September 2003, pp. 511–515. 13. G. N. Ali, P.-J. Chiang, A. K. Mikkilineni, G. T.-C. Chiu, E. J. Delp, and J. P. Allebach, “Application of principal components analysis and gaussian mixture models to printer identification,” Proceedings of the IS&T’s NIP20: International Conference on Digital Printing Technologies, vol. 20, Salt Lake City, UT, October/November 2004, pp. 301–305. 14. A. K. Mikkilineni, P.-J. Chiang, G. N. Ali, G. T.-C. Chiu, J. P. Allebach, and E. J. Delp, “Printer identification based on textural features,” Proceedings of the IS&T’s NIP20: International Conference on Digital Printing Technologies, vol. 20, Salt Lake City, UT, October/November 2004, pp. 306–311. 15. A. K. Mikkilineni, P.-J. Chiang, G. N. Ali, G. T. C. Chiu, J. P. Allebach, and E. J. Delp, “Printer identification based on graylevel co-occurrence features for security and forensic applications,” Proceedings of the SPIE International Conference on Security, Steganography, and Watermarking of Multimedia Contents VII, vol. 5681, San Jose, CA, March 2005, pp. 430–440. 16. A. K. Mikkilineni, O. Arslan, P.-J. Chiang, R. M. Kumontoy, J. P. Allebach, G. T.-C. Chiu, and E. J. Delp, “Printer forensics using svm techniques,” Proceedings of the IS&T’s NIP21: International Conference on Digital Printing Technologies, vol. 21, Baltimore, MD, October 2005, pp. 223–226. 17. O. Arslan, R. M. Kumontoy, P.-J. Chiang, A. K. Mikkillineni, J. P. Allebach, G. T. C. Chiu, and E. J. Delp, “Identification of inkjet printers for forensic applications,” Proceedings of the IS&T’s NIP21: International Conference on Digital Printing Technologies, vol. 21, Baltimore, MD, October 2005, pp. 235–238. 18. G.-Y. Lin, J. M. Grice, J. P. Allebach, G. T.-C. Chiu, W. Bradburn, and J. Weaver, “Banding artifact reduction in electrophotographic printers by using pulse width modulation,” Journal of Imaging Science and Technology, vol. 46, no. 4, pp. 326–337, July/August 2002. 19. C.-L. Chen, G. T.-C. Chiu, and J. P. Allebach, “Banding reduction in electrophotographic processes using human contrast sensitivity function shaped photoconductor velocity control,” The Journal of Imaging Science and Technology, vol. 47, no. 3, pp. 209–223, May/June 2003. 20. M. T. S. Ewe, G. T.-C. Chiu, J. M. Grice, J. P. Allebach, C. Chan, and W. Foote, “Banding reduction in electrophotographic processs using a piezoelectric actuated laser beam deflection device,” The Journal of Imaging Science and Technology, vol. 46, no. 5, pp. 433–442, September/October 2002. 21. P.-J. Chiang, A. K. Mikkilineni, O. Arslan, R. M. Kumontoy, G. T.-C. Chiu, E. J. Delp, and J. P. Allebach, “Extrinsic signature embedding in text document using exposure modulation for information hiding and secure printing in electrophotography,” Proceedings of the IS&T’s NIP21: International Conference on Digital Printing Technologies, vol. 21, Baltimore, MD, October 2005, pp. 231–234. 22. E. M. Williams, The Physics and Technology of Xerographic Processes. New York, NY: Wiley, 1984. 23. D. Kacker, T. Camis, and J. P. Allebach, “Electrophotographic processes embedded in direct binary search,” IEEE Transactions on Image Processing, vol. 11, pp. 234–257, 2002. 24. Information technology – Office equipment – Measurement of image quality attributes for hardcopy output – Binary monochrome text and graphic images, ISO Std. 13 660, 2001.