Mean rankings of usefulness of the four in-vehicle information systems. .... functions of the alternator, oxygen sensor, master cylinder, catalytic converter, and.
Technical Report UMTRI-93-32
November, 1993
Initial On-the-Road Tests of Driver Information System Interfaces: Route Guidance, Traffic Information, Vehicle Monitoring, and IVSAWS
Paul Green, Marie Williams, Eileen Hoekstra, Kellie George, and Cathy Wen
NOTICE This document is disseminated under the sponsorship of the Department of Transportation in the interest of information exchange. The United States Government assumes no liability for its contents or use thereof. This report does not constitute a standard, specification, or regulation. The United States Government does not endorse products or manufacturers. Trade manufacturers’ names appear in this report only because they are considered essential to the object of the document. The contents of this report reflect the views of the authors, who are responsible for the facts and accuracy of the data presented herein. The contents do not necessarily reflect the official policy of the Department of Transportation. This report does not constitute a standard, specification, or regulation.
Technical Report Documentation Page 1. Report No.
2. Government Accession No.
3. Recipient’s Catalog No.
4. Title and Subtitle
5. Report Date
Initial On-the-Road Tests of Driver Information System Interfaces: Route Guidance, Traffic Information, Vehicle Monitoring, and IVSAWS.
November, 1993
7. Author(s)
8. Performing Organization Report No.
Paul Green, Marie Williams, Eileen Hoekstra, Kellie George, and Cathy Wen
UMTRI-93-32
9. Performing Organization Name and Address
10. Work Unit no. (TRAIS)
The University of Michigan Transportation Research Institute 2901 Baxter Rd, Ann Arbor, Michigan 48109-2150
11. Contract or Grant No.
12. Sponsoring Agency Name and Address
13. Type of Report and Period Covered
U.S. Dept. of Transportation, Federal Highway Admin. 400 7th Street, SW Washington, D.C. 20590 USA
final, 9/91- 11/93
6. Performing Organization Code
account 080066
DTFH61-89-C-00044
14. Sponsoring Agency Code
15. Supplementary Notes
This research was funded jointly by the Federal Highway Administration and the National Highway Traffic Safety Administration. The Contracting Officer's Technical Representative (COTR) was Nazemeh Sobhi (HSR-30). 16. Abstract
The purpose of these experiments was to examine the safety and ease of use of simulated driver information system interfaces and to provide data that might be used to certify those qualities. In the first experiment, 6 pairs of drivers (12 participants) drove an instrumented car over a 19-turn, 35-minute route aided by an experimental route guidance system. The route guidance was provide on a head-up display (HUD), on the instrument panel (IP), or by voice. Drivers also used the other three information systems. The purpose of this experiment was to discover flaws in the driver interface or test protocol that were so serious that the experiment could not continue. There were none. In the second experiment, 43 drivers followed the same route using the same route guidance system and other information systems. Drivers made very few turn errors (mean = 1.8), with the fewest for the HUD, followed by the IP and voice designs. Also considered were measures obtained from the instrumented car including the mean and standard deviation of steering wheel angle, throttle position, speed and lane variance. There were very few differences among the three route guidance interfaces. Eye glance durations and frequencies were also obtained, as well as ratings of safety and ease of use of the driver interfaces. 17. Key Words
18. Distribution Statement
IVHS, human factors, ergonomics, route guidance, navigation, IVSAWS, traffic information, driver interfaces, safety
No restrictions. This document is available to the public through the National Technical Information Service, Springfield, Virginia 22161
19. Security Classif. (of this report)
20. Security Classif. (of this page)
21. No. of pages
none
none
161
Form DOT F 1700 7 (8-72) Reproduction of completed page authorized
22. Price
PREFACE The United States Department of Transportation (DOT), through its Intelligent VehicleHighway Systems (IVHS) program, is aiming to develop solutions to the most pressing problems of highway travel. The goals are to reduce congestion, improve traffic operations, reduce accidents, and reduce air pollution from vehicles by applying computer and communications technology to highway transportation. If these systems are to succeed in solving the nation's transportation problems, they must be safe and easy to use, with features that enhance the experience of driving. The University of Michigan Transportation Research Institute (UMTRI), under contract to DOT, carried out a project to help develop IVHS-related driver information systems for cars of the future. This project concerns the driver interface, the controls and displays that the driver interacts with, as well as their presentation logic and sequencing. The project had three objectives: • Provide human factors guidelines for the design of in-vehicle information systems. • Provide methods for testing the safety and ease of use of those systems. • Develop a model that predicts driver performance in using those systems. Although only passenger cars were considered in the study, the results apply to light trucks, minivans, and vans as well, because the driver population and likely use are similar to cars. Another significant constraint was that only able-bodied drivers were considered. Disabled and impaired drivers are likely to be the focus of future DOT research. A complete list of the driver interface project reports and other publications is included in the final overview report, 1 of 16 reports that document the project.[1] (See also Green, Serafin, Williams, and Paelke, 1991 for an overview.)[2] To put this report into context, the project began with a literature review and focus groups examining driver reactions to advanced instrumentation.[3,4,5] Subsequently, the relative extent to which various driver information systems might reduce accidents, improve traffic operations, and satisfy driver needs and wants, was analyzed.[6,7] That analysis led to the selection of two systems for detailed examination (traffic information and cellular phones). DOT contractual requirements stipulated three others (route guidance, road hazard warning, and vehicle monitoring). Each of the five systems selected was examined separately in a sequence of experiments. In a typical sequence, patrons at a local driver-licensing office were shown mockups of interfaces, and driver understanding of the interfaces and preferences for them was investigated. Interface alternatives were then compared in laboratory experiments involving response time, performance on driving simulators, and part-task simulations. The results for each system are described in a separate report. (See references 8, 9, 10, 11, 12, 13, and 14) To check the validity of those results, several on-road experiments were conducted in which performance and preference data for the various interface designs were obtained.[15]
iii
Concurrently, UMTRI developed test methods and evaluation protocols, UMTRI and Bolt Beranek and Newman (BBN) developed design guidelines, and BBN worked on the development of a model to predict driver performance while using in-vehicle information systems. (See references 16, 17, 18, 19, and 20.) This report describes the initial on-the-road experiments. In the first, pairs of driver were tested to determine if there were serious problems with any of the driver information systems that would render them unusable (and unable to be tested). In the subsequent experiment, individual subjects drove a 35-minute route while their driving performance was recorded in detail.[21]
iv
TABLE OF CONTENTS Section
Page
INTRODUCTION.......................................................................................................................... 1 Navigation Research ..................................................................................................... 1 Traffic Information Research ...................................................................................... 2 Vehicle Monitoring Research...................................................................................... 3 In-Vehicle Safety and Advisory Warning System (IVSAWS) .............................. 4 Goals of the On-the-Road Evaluations..................................................................... 4 Subsequent Research................................................................................................... 5 SUBJECTS-IN-TANDEM EXPERIMENT ................................................................................ 7 Purpose............................................................................................................................. 7 Method .............................................................................................................................. 7 Test Participants ................................................................................................ 7 Test Materials and Equipment........................................................................ 8 Test Vehicle ............................................................................................. 8 Visual Route Guidance System Interface...................................... 11 Auditory Route Guidance System Interface ................................. 16 Traffic Information System Interface .............................................. 19 In-Vehicle Safety Advisory and Warning System (IVSAWS) interface......................................................................................... 19 Vehicle Monitoring System Interface.............................................. 21 Test Route.............................................................................................. 22 Forms and Questionnaires................................................................ 24 Test Activities and Their Sequence ............................................................ 24 Part 1 - Ann Arbor to Belleville......................................................... 25 Part 2 - Belleville to Canton............................................................... 25 Part 3 - Canton to Ann Arbor ............................................................ 26 Results of Subjects-in-Tandem Experiment ......................................................... 26 Turn Errors......................................................................................................... 26 Participants’ Comments................................................................................. 27 Auditory Route Guidance Users’ Repeat Requests................................ 28 Task Difficulty Ratings.................................................................................... 28 Safety, Ease of Use, and Utility Evaluations............................................. 33 Usefulness and Usability Rankings ............................................................ 35
vii
TABLE OF CONTENTS (CONTINUED) Section
Page
INDIVIDUAL DRIVER EXPERIMENT .................................................................................... 37 Purpose........................................................................................................................... 37 Method ............................................................................................................................ 37 Test Participants .............................................................................................. 37 Test Materials and Equipment...................................................................... 38 Test Vehicle ........................................................................................... 38 Practice Route....................................................................................... 38 Test Route.............................................................................................. 39 Forms and Other Materials................................................................ 39 Test Activities and Their Sequence ............................................................ 39 Results from Individual Driver Experiment........................................................... 41 Data Processing ............................................................................................... 41 Driving Performance on Straight Roads While Using the Route Guidance System .................................................................................... 48 Turn Errors......................................................................................................... 60 Glances to Route Guidance Display ........................................................... 62 Eye Glances to Traffic Information, IVSAWS, and Vehicle Monitoring Displays ............................................................................... 73 Analysis of Post-Experiment Questionnaires .......................................... 79 Task Difficulty Questions............................................................................... 79 Safety and Usability Questions.................................................................... 86 Rankings of the Four Systems ..................................................................... 88 Willingness to Pay ........................................................................................... 89 Times to Operate Common Controls and Read Displays ..................... 90 CONCLUSIONS ......................................................................................................................... 93 How and where should route guidance information be presented?.............. 93 Can drivers successfully navigate using the route guidance interfaces outlined in this project? .................................................................................... 94 How long does it take drivers to read the traffic information, IVSAWS, and vehicle monitoring messages?............................................................... 95 In terms of ease of use, which functions and features do drivers consider to be safe and acceptable?............................................................. 95 Which of the human performance measures is most sensitive to changes in interface format?........................................................................... 96
viii
TABLE OF CONTENTS (CONTINUED) Section
Page
APPENDIX A - BIOGRAPHICAL FORM (BOTH EXPERIMENTS).................................. 97 APPENDIX B - SUBJECTS-IN-TANDEM EXPERIMENT CONSENT FORM................. 99 APPENDIX C - SUBJECTS-IN-TANDEM EXPERIMENT WRITTEN DIRECTIONS TO TEST ROUTE..................................................................................101 APPENDIX D - SUBJECTS-IN-TANDEM EXPERIMENT SUBJECT INSTRUCTIONS..............................................................................................................103 APPENDIX E - SINGLE DRIVER EXPERIMENT CONSENT FORM FOR YOUNGER SUBJECTS.................................................................................................107 APPENDIX F - SINGLE DRIVER EXPERIMENT CONSENT FORM FOR OLDER SUBJECTS ......................................................................................................................109 APPENDIX F - TASK DIFFICULTY QUESTIONNAIRE FOR HUD AND IP ROUTE GUIDANCE USERS (BOTH EXPERIMENTS) ...........................................111 APPENDIX G- TASK DIFFICULTY QUESTIONNAIRE FOR AUDITORY ROUTE GUIDANCE USERS (BOTH EXPERIMENTS)...........................................................113 APPENDIX H - USABILITY AND UTILITY QUESTIONNAIRE FOR HUD AND IP ROUTE GUIDANCE USERS (BOTH EXPERIMENTS) ...........................................115 APPENDIX I - USABILITY AND UTILITY QUESTIONNAIRE FOR AUDITORY ROUTE GUIDANCE USERS (BOTH EXPERIMENTS) ...........................................119 APPENDIX J - SINGLE DRIVER EXPERIMENT SUBJECT INSTRUCTIONS ............123 APPENDIX K - EXAMPLE TRANSCRIPT FOR IP ROUTE GUIDANCE SUBJECTS-IN-TANDEM TEST SESSION. ...............................................................131 APPENDIX L - EXAMPLE TRANSCRIPT FOR AUDITORY ROUTE GUIDANCE SUBJECTS-IN-TANDEM TEST SESSION ................................................................133 APPENDIX M - TRIP TIMELINE FOR YOUNGER DRIVER IN INDIVIDUAL DRIVER EXPERIMENT .................................................................................................137 APPENDIX N - TRIP TIMELINE FOR OLDER DRIVER IN INDIVIDUAL DRIVER EXPERIMENT..................................................................................................................143 REFERENCES .........................................................................................................................147
ix
LIST OF FIGURES Figure 1. 2. 3. 4.
Page
5.
Instrumented test vehicle and equipment arrangement........................................... 10 Example visual route guidance system screen. ........................................................ 12 IP and HUD route guidance practice screens. .......................................................... 13 IP and HUD (visual) route guidance screens for test route (in order from left to right)....................................................................................................................... 14 Example traffic information screen. ............................................................................. 19
6. 7. 8. 9. 10.
Example of an IVSAWS screen. .................................................................................. 20 Example of a vehicle monitoring screen..................................................................... 21 Test route......................................................................................................................... 23 Young subject wearing the eye mark recorder.......................................................... 38 Example screens used for system descriptions. ....................................................... 40
11. 12. 13. 14. 15.
Steering data processing example. ............................................................................. 42 Lane position data processing example. .................................................................... 42 Good lane position data. ............................................................................................... 43 Noisy lane position data. ............................................................................................... 44 Example lane position data with shadow interference. ............................................ 45
16. Expressway speed and throttle across time (straight road). ................................... 45 17. Expressway speed and throttle percent across time (curving road). ..................... 46 18. Expressway lane position and steering wheel angle across time (straight road). ................................................................................................................................ 47 19. Expressway lane position and steering wheel angle across time (curving road). ................................................................................................................................ 47 20. Distribution of mean steering wheel angle. ................................................................ 49 21. 22. 23. 24.
Mean steering wheel angle for selected road segments. ........................................ 49 Distribution of the standard deviation of steering wheel angle................................ 50 Standard deviation of steering wheel angle for each interface and location. ....... 51 Standard deviation of steering wheel angle as a function of driver age and sex. ................................................................................................................................... 51 25. Distribution of throttle positions.................................................................................... 52 26. 27. 28. 29. 30.
Throttle position for each road segment..................................................................... 53 Mean throttle position as a function of driver age and sex. ..................................... 53 Mean throttle position as a function of interface and driver age............................. 54 Distribution of standard deviation of throttle position................................................ 55 Standard deviation of throttle position for various segments. ................................. 55
x
LIST OF FIGURES (CONTINUED) Figure 31. 32. 33. 34. 35.
Page Distribution of lateral position. ...................................................................................... 56 Mean lateral position as a function of interface and driver age. ............................. 57 Standard deviation of lateral position.......................................................................... 57 Mean speed..................................................................................................................... 58 Mean speed for each road segment. .......................................................................... 59
36. 37. 38. 39.
Standard deviation of speed......................................................................................... 59 Coding of hypothetical road segment. ........................................................................ 64 Glance frequency for various road types, as a function of segment fifth. ............. 69 Frequency of glances to the IP route guidance display for expressways, as a function of driver age and road segment fifth......................................................... 69 40. Number of glances to the IP route guidance display for residential streets, by driver age and road segment fifth........................................................................... 70 41. Frequency of glances to the IP route guidance display for suburban roads, by driver age and road segment fifth........................................................................... 71 42. Frequency of glances to the in-vehicle display for ramps, by driver age and road segment fifth........................................................................................................... 72 43. Frequency of glances to the IP navigation display on city/business road, by driver age and road segment fifth........................................................................... 72 44. Number of glances to other displays........................................................................... 75 45. Mean glance duration to non-route guidance displays............................................. 75 46. Effects of system and driver age on mean glance duration to non-route guidance displays........................................................................................................... 76 47. Distribution of total glance times for all drivers to non-route guidance displays. ........................................................................................................................... 77 48. Effects of system and driver age on total glance time to non-route guidance displays........................................................................................................... 78 49. Mean difficulty ratings for nine common driving tasks for RG system user groups. ............................................................................................................................. 81 50. Trip timeline for a younger driver...............................................................................137 51. Trip timeline for an older driver. .................................................................................143
xi
LIST OF TABLES Table 1. 2. 3. 4. 5.
Page List of auditory route guidance messages for the practice route............................ 17 List of auditory route guidance messages for the test route. .................................. 18 Executed turn errors for test route............................................................................... 27 Repeat requests for auditory route guidance users.................................................. 28 Mean difficulty ratings for performing common tasks while driving........................ 29
6. 7.
Mean difficulty ratings for using route guidance systems while driving................. 30 Additional mean difficulty ratings for using route guidance systems while driving............................................................................................................................... 30 8. Mean level of agreement to usefulness of specific features of the auditory, IP, and HUD route guidance systems......................................................................... 31 9. Mean level of agreement to usefulness of specific features of the IP and HUD route guidance systems....................................................................................... 31 10. Mean difficulty ratings for using the traffic information system while driving. ....... 32 11. Mean difficulty ratings for using the hazard warning system while driving. .......... 32 12. Mean difficulty ratings for using the vehicle monitoring system while driving............................................................................................................................... 33 13. Mean level of agreement to safety and usability issues for using the 4 invehicle information systems. ........................................................................................ 34 14. Mean level of agreement to ease of use of HUD/mirror........................................... 34 15. Mean level of agreement to utility issues for using the 4 in-vehicle information systems....................................................................................................... 35 16. 17. 18. 19. 20.
Mean ranks for the usefulness of the four in-vehicle information systems. .......... 36 Mean ranks for the usability of the four in-vehicle information systems................ 36 Summary of driving performance data........................................................................ 48 Turn errors for test route. .............................................................................................. 61 Tally of execution and near miss turn errors by route guidance system............... 62
21. Codes used in eye glance and driving event analysis. ............................................ 63 22. Mean road segment duration for road types, by age................................................ 66 23. Total number of glances to the IP route guidance display for each road segment. .......................................................................................................................... 67 24. Mean frequency of glances to the IP route guidance display per road segment. .......................................................................................................................... 68 25. Eye glances to other (non-route guidance) displays. ............................................... 74
xii
LIST OF TABLES (CONTINUED) Table 26. 27. 28. 29. 30.
Page Mean glance duration for each screen of the non-route guidance systems......... 77 Total glance times to non-route guidance screens................................................... 78 Mean difficulty ratings for performing common tasks while driving........................ 80 Selected mean difficulty ratings for common driving tasks from Kames............... 80 Mean difficulty ratings for tasks, using the route guidance system while driving............................................................................................................................... 82
31. Additional mean difficulty ratings for tasks, using the route guidance system while driving....................................................................................................... 82 32. Mean ratings of usefulness of route guidance system features common to all route guidance groups.............................................................................................. 83 33. Mean ratings of route guidance system features applicable to visual system (IP and HUD) groups. ...................................................................................... 83 34. Mean difficulty ratings for using the traffic information system while driving. ....... 84 35. Mean difficulty ratings of tasks involving the hazard warning system. .................. 85 36. Mean difficulty ratings for using the vehicle monitoring system while driving............................................................................................................................... 85 37. Summary of main effects and significant pairwise differences for task difficulty questions for four in-vehicle systems. ......................................................... 86 38. Mean level of agreement to safety and usability issues for using the 4 invehicle information systems. ........................................................................................ 87 39. Mean level of agreement to utility issues for using the 4 in-vehicle information systems....................................................................................................... 88 40. Mean rankings of usefulness of the four in-vehicle information systems.............. 89 41. Mean rankings of ease of use of 4 advanced in-vehicle information systems............................................................................................................................ 89 42. Mean amount participants are willing to pay for systems used. ............................. 90 43. Mean time to complete controls and display tasks while driving. ........................... 91 44. Comments from driver and passenger in IP route guidance condition of subjects-in-tandem experiment..................................................................................131 45. Comments from driver and passenger in auditory route guidance condition of subjects-in-tandem experiment. ............................................................................133
xiii
xiv
INTRODUCTION It is essential that cars be safe and easy to use. Safety is important because between 40,000 and 50,000 people lose their lives each year in motor vehicle crashes.[22] For young adults, motor vehicle crashes are one of the leading causes of death . Not only should vehicles driven by the public do not harm, they should provide features that customers want. To allow for the development of commercially-desirable products that are also safe and easy to use, methods to assess the safety and usability of those products must be established and representative data must be collected. The goal of the two experiments described in this report was to collect data for those purposes, and to examine several interface format alternatives. Specifically, this report examines the safety and ease of use of four simulated advanced driver information systems -- route guidance, traffic information, vehicle monitoring, and hazard warning. Each of these was designed based on the human factors literature and laboratory tests conducted as part of this project. Following is a brief review of the previous research conducted in this project to design the driver interfaces for those systems. Navigation Research Williams and Green describe the initial navigation experiments.[8,9] First, drivers were shown various navigation displays and were asked to explain what was shown. Driver comments were used to make incremental improvements in the design of the display. In a subsequent experiment conducted at a local driver-licensing office, 60 drivers were shown drawings of route guidance displays depicting intersections and expressway entrances and exits.[9] Each situation could be represented from a plan, aerial, or perspective view. There were very minor differences in the number of errors made as a function of the view presented; however, perspective views were the least preferred. In a subsequent response time experiment, 12 drivers were simultaneously shown slides of intersection scenes (projected onto a wall) and slides of route guidance displays.[8,9] The guidance display appeared on the instrument panel (IP) or head-up display (HUD) of the vehicle in which they were seated. Three views of the intersection (plan, aerial, perspective) were examined, as in the previous experiment. Participants pressed one of two buttons (same, different) to indicate if the route guidance display was the same as or different from the intersection shown in the scene. Response times to perspective formats were longer than those to plan and aerial formats. In addition, response times to roads shown as solid figures (on the navigation display) were slightly shorter than those shown as outlines. The error data and driver preferences also confirmed these results. As a result of this research, the desired design for a visual representation of the navigation display showed roads as solid figures, and intersections from plan views. Following the development of the in-vehicle systems, a laboratory experiment was conducted to determine if landmarks (e.g., traffic lights, stop signs, etc.) help drivers 1
navigate.[14] Both auditory and visual route guidance and traffic information systems were tested to determine the best method of conveying information. This experiment also aided in determining if the color coding of the navigation and traffic information screens was effective. Participants sat in a laboratory car buck and watched a 25minute videotape of a route from a driver's perspective. Simultaneously they received route guidance and traffic information in one of four formats: visual with landmarks, visual without landmarks, auditory with landmarks, or auditory without landmarks. They pressed one of three keys to indicate which maneuver to make at intersections and expressway exits: turn or bear left, continue, or turn or bear right. They were also instructed to press down on the brake pedal when a car immediately in front of them braked. The dependent measures were brake response time, lead distance (how far in advance of a decision point it was responded to), and eye glance frequencies to the invehicle display. In addition, after a traffic information report was presented, subjects rated the effect that the described traffic problem would have on their travel. The experimenters also wanted to identify problems with the experimental method used to examine navigation problems, the somewhat passive viewing of videotaped driving scenes. In general, street signs and traffic signals were only somewhat legible on the videotape. Also, the original plan of showing the video scene on a large screen ahead of the vehicle mock-up had to be changed due to motion sickness problems. The attentional demand task (watching for and reacting to brake lights) was not as captivating as anticipated. In the videotape, the same vehicle is always visible ahead. (Another experimenter was driving the lead vehicle to allow for the addition of unexpected brake actuations to broaden the attentional demand task.) This actually detracted from the test participants' reliance on the route guidance display for navigation information, as they could determine where to turn by watching the lead vehicle. Traffic Information Research Paelke, and Paelke and Green describe a series of experiments conducted to design a rudimentary traffic information system.[10,23] In the initial design, analyses information retrieval times were predicted using Goals, Operators, Methods, and Selection (GOMS) rules models.[24] This led to a reduction in the interface designs considered. Also, ideas from Tullis's research, with regard to screen format, were used to improve the screen arrangement.[25] Subsequently, several small scale, usability tests were conducted using UMTRI employees to determine understanding of screens as a function of various graphic changes (lines and boxes to separate information elements). The use of gestures on a touchscreen to change the scale of maps was also investigated. No consistent mannerisms were identified for zooming out, so the idea of a gesture-based interface was dropped. Secondly, paper color copies of the refined interface were shown to 20 drivers at a local licensing office. Drivers were shown the initial screen designs and asked how they would retrieve more detailed information. They then were shown the detailed screens and were asked to explain them. Several different color coding schemes for the
2
detailed screens were examined. This experiment led to the selection of a greenyellow-red (from least to most severe) color coding scheme as the preferred design. In a third experiment, five methods for retrieving traffic information were examined in the laboratory. The initial screen was either a bidirectional scrolling menu, a touch screen with a map and highway sign shields, or a phone keypad (used to enter the route number). Subsequent screens could be either text or graphic. Drivers were cued to retrieve traffic information while operating a simple driving simulator. Driving was significantly worse, in that drivers exhibited greater lane variance while timesharing driving and using the traffic information display than when driving alone. Retrieval times were longer for the phone-style interface than for the other designs. In terms of preferences, the text-based display was preferred over the graphic display for showing traffic information. This led to its selection for further testing. Vehicle Monitoring Research A series of experiments was conducted to design the interface of a vehicle monitoring system.[13] From the literature, and from contact with vehicle engineers, a prioritized list of maintenance items that technically could be implemented by the year 2000 was produced. To develop a standardized structured vocabulary, warnings were grouped into categories based on desired driver response and predicted driver behavior. Example breakdowns included warnings requiring drivers’ immediate attention, warnings drivers are expected to understand, warnings drivers are expected to remedy themselves, and status provided for drivers’ information. From this list, nine main categories of warnings were identified. Variations for each of the nine categories were developed and shown to 60 drivers. (For example, should the warning say that maintenance is “required,” “needed,” “desired,” “necessary,” or “recommended”?) In each case, participants circled the words most preferred for each message. From these responses, standard messages were developed. To gain insight into drivers’ knowledge of their vehicles, information used for interpreting warning displays, 27 drivers were interviewed at a local driver-licensing office. There were 25 open-ended questions, such as "What is an alternator for?" and "What happens if the brake fluid is too low?" Answers were scored as completely correct, partially correct, a "glimmer," or incorrect. Approximately 39 percent of the responses were correct with another 34 percent partially correct. Items that created problems for drivers were distinguishing antilock brake failure from regular brake failure, distinguishing low oil level from low oil pressure, and knowing the functions of the alternator, oxygen sensor, master cylinder, catalytic converter, and accessory drive belt. In the third experiment, 20 drivers waiting in line at a licensing office participated. They were shown paper reproductions of a text-based warning system interface. They stated what they thought the display was indicating and how they would respond to it. Generally, drivers had few problems in understanding the displays, though some desired minor changes were identified. Clarification was needed to avoid confusion
3
between oil level and oil pressure, the engine temperature being near high versus being high, and some problems in understanding the vehicle mimic that identified which problem tire was being indicated. In-Vehicle Safety and Advisory Warning System (IVSAWS) Another series of experiments was conducted to evaluate the interface of a hazard warning system, IVSAWS.[12] A system of this type could receive radio signals from beacons on hazards and display in-vehicle warning messages to drivers. These warnings would identify the hazard and its location relative to the driver’s vehicle (ahead, to the right, behind, etc.). Initially, appropriate hazards were identified from the literature. In the first experiment, candidate warning symbols for those 30 hazards were developed, based on drawings generated by 10 test participants. For each hazard, between two and nine candidates of different formats (graphic, text, or mixed) were developed. In the second experiment, 75 drivers at a licensing office were asked to rank those warning symbols from best to worst. This led to a set of recommended warning symbols in many cases. Text messages were slightly preferred over graphical messages. For the third experiment, 10 candidate symbols for hazard location were developed in the following formats: 2 text, 4 arrows, 3 overviews, and 1 inside-out. In this understandability study, 20 drivers each identified 10 hazard symbols shown individually, a single hazard symbol combined with a location cue, and 40 combinations of hazard and location cues. Participants’ error rates and preferences indicate that one of the text designs, “ahead,” “on right,” “ahead to right,” “behind,” etc., was the best understood for locating hazards. Goals of the On-the-Road Evaluations The laboratory research described above was utilized to develop driver interfaces for route guidance, traffic information, IVSAWS, and vehicle monitoring systems. The next step in their evolution involved testing in a more demanding context, on-the-road use by drivers. Two on-the-road experiments, described in this report, were conducted to determine the attentional demands of using existing controls and displays in cars, as well as the new systems. In addition, it was designed as a basis for comparing laboratory and on-the-road results, calibrating the Integrated Driver Model, and providing data needed to establish a protocol to certify safety and ease of use.[20,21] As a result of the previously described research, the following issues were identified as needing further examination here: • How and where should route guidance information be presented? How much better is an instrument panel location than a HUD for visual displays? Is a visual display better or worse than an auditory display for messages of realistic length and complexity? • Can drivers successfully navigate using the route guidance interfaces outlined in this project?
4
• How long does it take drivers to read the vehicle monitoring messages? • How long does it take to read the traffic information displays? • How long does it take to read IVSAWS warnings? • In general, which of the human performance measures (e.g., mean glance duration, number of glances, total glance time, lane variance, speed variance, etc.) is most sensitive to changes in interface format? • In terms of ease of use, which functions and features do drivers consider to be safe and acceptable? In the first part of this experiment (using the subjects-in-tandem method) pairs of drivers drove to a destination using written directions. At various times along the way, the driver was prompted to operate various controls and read displays. Upon reaching the destination, the driver and passenger worked together to reach a second destination, using an in-vehicle information system. This information system provided route guidance, traffic information, vehicle monitoring, and hazard warning information. Subjects were not given any instruction on the use of the system, but were told it would give them information to get to a destination 30 minutes away. In the second part of this experiment, individual drivers used the route guidance system to drive the same preprogrammed route. The traffic information, vehicle monitoring and IVSAWS systems were also used. The task sequence was similar to the previous paired-driver experiment, except that drivers were first given brief instructions on each of the four systems. Subsequent Research After this research was completed, another on-road experiment was conducted to examine further the route guidance driver interface and a car phone.[16] That experiment demonstrated the repeatability of the test protocol.
5
SUBJECTS-IN-TANDEM EXPERIMENT Purpose This experiment was conducted to determine the feasibility of a protocol for evaluating the safety and ease of use of driver interfaces. Also of interest was whether the driver interfaces could be used safely by individual drivers on public roads. By using pairs of untrained subjects working together and “thinking aloud,” problems with the experimental procedure and system interfaces were identified. Method Pairs of participants worked together to use in-vehicle route guidance, traffic information, hazard warning, and vehicle monitoring systems. There were three formats for presenting the route guidance information: head-up display, instrument panel (IP) visual display, and auditory display. All other systems were presented on a separate IP display. One younger couple and one older couple used one of the three interface formats, with a total of 6 pairs of subjects (12 participants). Subjects were not given any prior instruction on the use of the system. They were encouraged to think aloud throughout the experiment, and all segments were videotaped. There were three sections to the route driven. Section 1 involved driving from Ann Arbor, Michigan to Belleville, Michigan in an instrumented car, using written directions provided by the experimenter. This allowed drivers to become accustomed to the test vehicle and placed them at the beginning of a sequence of roads suitable for evaluating the electronic route guidance interface. For section 2, the in-vehicle information system was initiated, and the pair worked together to follow its instructions for reaching the destination in Canton, Michigan. At the destination, both driver and passenger were asked to make open-ended comments on their experiences using the system. Section 3 required the pair to return to Ann Arbor from Canton using a preplanned route on a map. Upon return to UMTRI, participants independently completed two questionnaires concerning the ease of use and usefulness of the information systems, as well as the difficulty of performing a variety of tasks while driving. During sections 1 and 3, the driver was asked to operate certain controls in the car, such as the fan and radio. Drivers were not told they were being timed by the experimenter when operating these controls. Test Participants Six pairs of friends or spouses participated in this study. There were 6 younger participants (mean age = 22), and 6 older participants (mean age = 61), with 4 women and 8 men. Their corrected visual acuities ranged from 20/15 to 20/70. Drivers were
7
friends of the experimenters or were recruited from lists of participants from previous experiments not related to route guidance. They were paid $30 each for about two and a half hours of their time. Participants reported they drove from 1,000 to 15,000 miles per year (mean = 9,600). None of the participants had ever driven a vehicle with an in-vehicle traffic information or route guidance system, nor had any ever owned or driven a car with a HUD. In the last 6 months, they reported having used a map an average of 5 to 6 times. In the last 2 weeks, they reportedly relied on traffic information reports to get to a destination approximately 1 or 2 times. Test Materials and Equipment Test Vehicle The instrumentation is installed in an air conditioned 1991 Honda Accord LX station wagon with an automatic transmission. (Since the sedan version of the Accord, quite similar to the station wagon in performance, was the most popular model in the U.S. for five years in a row, this is a very typical car for Americans to drive.) All of the major research equipment (computers, power conditioners, etc.) is hidden from view in the back seat or in the cargo area, which has its own retractable vinyl cover. From the outside, the instrumented car resembles a normal station wagon. The vehicle has the following sensors: Lane tracker - The driver’s outside mirror has been replaced with a mirror from a late model Ford Taurus. Embedded inside the over-sized mirror housing is a black and white CCD camera with an auto-iris lens. Only the tip of the lens barrel housing is visible from the outside. The camera is connected to a frame buffer in an 80486-based computer. Custom computer software was written to detect lane markings and store the lateral deviation, to the nearest tenth of a foot, at a rate of 10 Hertz (Hz). Steering wheel position sensor - A string potentiometer is mounted to the steering column under the dashboard. The potentiometer signal is fed through an interface box to the analog board in an 80486 computer. Steering wheel position is recorded to the nearest 0.3 degrees at 30 Hz. Speed sensor - Built into the left front wheel (for use by the vehicle’s engine and transmission controller) is a sensor that pulses every one-quarter wheel revolution. Using the pulse interval times, speeds can be measured to the nearest 0.1 mi/h at 10 Hz for speeds in excess of 12 mi/h. Accelerator/Throttle sensor - An analog signal representing the percent declination of the accelerator pedal is obtained from the vehicle’s throttle angle sensor. This signal is also monitored by an 80486 computer and recorded at 30 Hz. Road scene - Mounted in front of the inside mirror and facing forward is a thumb-sized, color video camera. The video signal is mixed with the video signal from another camera via a signal splitter and recorded on a VCR.
8
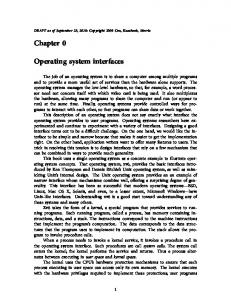
Driver scene - Mounted on the left “A” pillar and facing the driver is a second thumbsized, color video camera. This camera captures the driver’s head and upper torso (to show eye and head movements, as well as some manual operations). This video signal is mixed with video signal from the road scene camera. Audio - A microphone is mounted on top of the IP to record comments from the driver, front seat passenger (when present), and the experimenter, as well as sounds from the information systems. All of the vehicle and driver data were collected and stored either by an 80486 computer or on videotape. The data collection software provided for real-time display of all data streams so they could be checked for accuracy by an experimenter in the back seat. In addition, the software allowed for the entry of time-stamped comments via the keyboard at any time. In this configuration, data could be collected for about an hour before they needed to be saved to disk. The arrangement and model numbers of the instrumentation are shown in figure 1.
9
Driver Interface Research Vehicle 1991 Honda Accord LX Wagon Display screen - Panasonic 6" LCD model TR-6LC1
Scene camera - Panasonic WV-KS152 with 1:1.4 3mm lens
Electronic Control Unit (ECU) Transmission controller
Driver camera - Panasonic WV-KS152 with 1:1.4 3mm lens
Display screen - Hitachi 5" LCD model C5-LC2 HUD mirror
Ergo LCD VGA display Audio speaker - Realistic Minimus - 2.5 NAC EMR Eyemark Recorder model V headpeice Panasonic BT-S700N Color Video Monitor (reverse scan) Video mixer - American Dynamics model AD1470A Scene and driver camera controllers Panasonic WV-KS152 NAC EMR Controller Audio amplifier - RealisticSA-10 model 31-1982B Macintosh keyboard 486 computer keyboard Scene/driver monitor - Magnavox 5 inch Portable Television model RD0510 Scene/driver VCR - Panasonic AG-6200 (below) Custom signal conditioning module 400 Watt inverter - PowerStar model UPG 400, 12V power supply and +15/-15V power supply Data collection computer - Gateway 2000 33MHz 486 with 4 MBytes RAM, National Instruments AT MIO-16 and PC DIO-24 boards, Cortex-I Video Frame Grabber, 16 bit SCSI card, and Ergo LCD display card Conner 85MByte external hard disks NTSC converter - RasterOps Video Expander II Macintosh IIx with RasterOps 24STV video card NAC EMR Data Output Unit Power strips/surge supressors - Woods 186SS
Figure 1. Instrumented test vehicle and equipment arrangement. A simulated HUD consisted of a video monitor (Panasonic BT-S700N), rewired to reverse the direction of the horizontal scan, and a small mirror mounted on the
10
windshield (in which the monitor could be seen). The forward-facing monitor was placed on a custom stand between the car’s front seats at about shoulder level. This monitor received an NTSC signal from the Macintosh identical to that shown on the visual IP route guidance display. The 5.1 by 7.6 cm (2 by 3 inch) custom mirror was attached by suction cup to the inside of the front windshield. The HUD/mirror was located 7.6 cm (3 in) below the top of the windshield and 12.7 to 16.5 cm (5 to 6.5 in) to the right of center of the steering wheel. This location was just below and somewhat to the left of the inside, rearview mirror. It also placed the HUD/mirror at or above the driver's vertical eye height. Minor adjustments were made to the mirror location depending on the height of each driver and seat position. The width of the mirror was less than the interocular spacing of most drivers, allowing them binocularly to “look through” the HUD and see objects behind it by relying upon overlapping monocular fields. The only objects that could be blocked by the HUD/mirror were signs, and then only momentarily. Visual Route Guidance System Interface The route guidance system provided turn-by-turn navigation information to drivers. There were three modes in which the information was presented: a visual system shown on an IP-mounted display, a visual system shown on a simulated HUD on the upper portion of the windshield, and an auditory system presented through a speaker mounted low between the front seats. (The visual system was identical to the one used in the previous experiment done in the laboratory.) For both visually presented systems, all screens were identical. A sample visual route guidance system is shown in figure 2.
11
Next maneuver (bear right onto Huron River Drive in 0.3 miles or 40 seconds).
Huron River Dr
STO
0.3
Greylock St 0.1
13200 Clarence St Belleville MI
Next intersection geometry and maneuver: • white arrow shows next intersection maneuver. • stop sign landmark. Other options are traffic signals, bridges, and overpasses. • Greylock Street is 0.1 mile ahead. Shown as light green to indicate it is not a maneuver point. Current location
Heading (compass shows eight possible directions: N, NE, E, SE, S, SW, W, NW) Note: The roads, “Greylock St”, and “0.1” are green, and the stop sign is red. Figure 2. Example visual route guidance system screen. Distances to turns and current location were updated each tenth of a mile. (Screens did not scroll.) When a decision point was passed, a new screen appeared. Time-based countdown bars, to the left of “0.3,” indicate, in 20 second intervals, the estimated time to reach that intersection. Before driving the route, drivers completed a 7-minute practice session that involved driving in an area near UMTRI in Ann Arbor. The computer-generated screen sequence for that practice is shown in figure 3.
12
Figure 3. IP and HUD route guidance practice screens. During the test session, drivers saw a total of 30 screens, containing 19 turns, to get to the destination. The sequence of visual route guidance screens for the entire route is shown in figure 4.
Figure 4. IP and HUD (visual) route guidance screens for test route (in order from left to right).
Figure 4. IP and HUD (visual) route guidance screens for test route (in order from right to left) (continued). The screen for the next intersection was displayed until the driver had completely executed that maneuver. For example, the first screen (on Elwell Road) would be displayed until the car straightened out on Huron River Drive.
13
Auditory Route Guidance System Interface The auditory system also provided information on a turn-by-turn basis for reaching the destination. Turn instructions included distances to upcoming decision points, the street name, and landmarks . The auditory guidance was based on a digitized female voice, where the digitized segments were one word long. The simulation computer (the Macintosh) pieced together sentences from the digitized words in its vocabulary. This gave the output of the auditory system the clarity of real speech with the mechanical rhythm of computer-generated speech. Depending on the distance between turns, there could be up to three verbal messages for an upcoming turn. (Auditory messages for one intersection are comparable to a turn instruction screen from the visual systems.) The three possible messages were “next,” “prepare,” and “at.” The “next” message was made 5 seconds after the driver completed a turn. (This is similar to the visual systems where the screen for the next turn was displayed after the previous turn was fully executed). This message was in the form, “In {x} mile(s), at {street name}, turn (or bear) {direction}.” A “prepare” message announced the same information with any appropriate landmarks and an updated distance to the turn. This message was presented 1 mile from the maneuver on surface streets, and 2 miles from the maneuver on the expressway. Finally, the “at” message signaled that the turn was imminent (within 15 seconds after the message presentation on surface streets, and 30 seconds on the expressway). This message was an abbreviation of prior messages, saying, “Approaching {street name}, turn (or bear) {direction}.” Subjects (both driver and passenger) could request that the last message be repeated, by saying, “repeat” aloud. The experimenter then replayed the previous message, with updated mileage information. If the distance between turns was less than 1 mile on a surface street or 2 miles on the expressway, then only the “prepare” and “at” messages were presented (in this case the “prepare” message was presented directly after the turn in place of the “next” message). If the distance between turns was greater than 1.25 miles on a surface street or 2.5 miles on the expressway then there would be time for all 3 messages. The reason for the gap in distances between two and three message maneuvers was to avoid having the system speak too often. It would have been annoying and distracting to the driver for the system to finish speaking the “next” message and immediately begin the “prepare” message. The same is true when the driver asked for a “repeat” 0.25 mile or less (0.5 mile on the expressway) before the “prepare” message; the system did not reiterate the last presented message, but moved up the “prepare” message. Before driving the route, drivers completed a 7-minute practice session that involved driving in an area near UMTRI in Ann Arbor. A complete listing of the auditory route guidance messages used for the practice is in table 1. A list of all auditory route guidance messages used on the test route is in table 2.
14
Table 1. List of auditory route guidance messages for the practice route. Type of message Next/Prepare At Next/Prepare At Next/Prepare At
Message In point 6 mile, at the stop sign, at Nixon Road, turn left. Approaching Nixon Road, turn left. In point 3 mile, at the traffic light, at Plymouth Road, turn left. Approaching Plymouth Road, turn left. In point 9 mile, at US 23 south, enter on the right. Approaching US 23 south, enter on the right.
15
Table 2. List of auditory route guidance messages for the test route. Type of message At Next/Prepare Info At Next/Prepare At Next/Prepare At Next/At Next/Prepare At Next Prepare At Next/Prepare At Next/Prepare At Next/Prepare At Next/Prepare At At Next/Prepare At Next Prepare At At Next/Prepare At Next/Prepare At At Next/Prepare At I
Message Approaching Huron River Drive, turn right. In point 9 miles, at Huron River Drive, just before the traffic light, bear left. Current street name has changed to Columbia Avenue. Approaching Huron River Drive, just before the traffic light, bear left. At the third street, Madelon Street, turn right. Approaching Madelon Street, turn right. At the second stop sign, at Robbe Avenue, turn left. Approaching Robbe Avenue, turn left. At the second stop sign, at Clarence Street , turn left. In point 3 mile, at Huron River Drive, turn right. Approaching Huron River Drive, at the stop sign, turn right. In 2 point 4 miles, at the flashing red light, at Haggerty Road North, turn left. In 1 mile, at the second flashing light, at Haggerty Road North, turn left. Approaching Haggerty Road North, at the flashing red light, turn left. In point 5 mile, at “I” 94 east, enter on the right. Approaching “I” 94 east, enter on the right. In 1 point 1 miles, at “I” 275 north, exit on the right. Approaching “I” 275 North, exit. After the underpass, bear left. After the underpass, bear left. In 1 point 5 miles, at Exit 20, Ecorse Road, exit on the right. Approaching Exit 20, Ecorse Road, exit and then turn right. Approaching Ecorse Road, at the stop sign, turn right. In point 6 miles, at the traffic light, at Hannan Road, turn left. Approaching Hannan Road, at the traffic light, turn left. In 2 miles, at the traffic light, at Michigan Avenue, turn left. In 1 mile, at Michigan Avenue, turn right and then make an immediate u-turn. Approaching Michigan Avenue, at the traffic light, turn right and then make an immediate u-turn. Make a u-turn on the left. In point 5 miles, at “I” 275 north, enter on the right. Approaching “I” 275 north, enter on the right. In 2 point 1 miles, at Exit 25, Ford Road, exit on the right. Approaching Exit 25, Ford Road, exit, and then turn left. Approaching Ford Road, at the traffic light, turn left. Destination ahead, after the traffic light, at Hardees, turn right. Approaching Hardees, turn right.
16
Traffic Information System Interface The traffic information system provided information about an (artificial) traffic problem that occurred during the journey. The problems could include traffic accidents, congestion, or construction areas. A traffic information screen was located on a display mounted on the IP, to the right of the IP location of the visual route guidance display. (All test participants saw a visual traffic information system, regardless of which route guidance system they used.) Two beeps were sounded before a traffic information screen appeared. The example screen of this system appears in figure 5.
Note: Below “Lanes Blocked,” the arrow is green and “X” is red. Figure 5. Example traffic information screen. As shown at the top of the figure, the traffic information screen describes the nature and location of the traffic problem: an accident on I-275 North. The middle of the screen indicates the specific location of the problem, in this case near Van Born Road. The bottom of the screen indicates which lanes are open by showing green arrows (the left lane), and which lane is blocked by showing a red “X” (the right lane). Also shown is the speed of the traffic through the area of the accident, 25 miles per hour. For further details describing the interface of this system, readers are referred to the separate report on the traffic information system.[11] In-Vehicle Safety Advisory and Warning System (IVSAWS) Interface The hazard warning system, IVSAWS, alerts drivers to hazards such as emergency vehicles, malfunctioning traffic signals, and school buses,. It also indicates the location
17
of the hazard relative to the driver. As with the traffic information system, two beeps were sounded before the appearance of a screen. An example screen is shown in figure 6.
Note: The bus is yellow and the flashing lights are red. Figure 6. Example of an IVSAWS screen. As shown in the figure, the hazard is identified on the left, in this case an unloading school bus. On the right is the location of the hazard relative to the driver’s vehicle, “ahead to left.” In the test session, this artificial hazard warning was shown to all test participants before the intersection of Robbe Road and Bedell Road. Most subjects also were shown a “road construction ahead” message on Columbia Avenue before the intersection with Huron River Drive, because of actual construction. All drivers (in all three route guidance conditions) were shown the same (visual) hazard warning system, displayed on a monitor mounted on the IP, to the right of the visual route guidance system. During the test session, it was possible for on-the-fly hazards to be presented. These included moving ambulance, moving police, moving fire truck, school bus unloading, train at crossing, traffic signal out of order, road construction, and mail truck. For further details describing the interface of this system, readers are referred to the separate report on the IVSAWS driver interface.[13]
18
Vehicle Monitoring System Interface The vehicle monitoring system alerted drivers to various problems with their vehicle. Again, two beeps were sounded when a new warning was added. The vehicle monitoring system was the default screen displayed on the non-route guidance monitor. An example screen is shown in figure 7.
Note: The “X” and box around the top text message are yellow. Figure 7. Example of a vehicle monitoring screen. The car mimic on the left can indicate the location of a problem with the vehicle. For example, if the driver’s side headlamp were broken, a yellow “X” would appear on the top left of the icon. (Not every vehicle problem resulted in a location marker on the icon.) The right of the screen shows the message text box that describes the problem, in this case, “Replace turn signal lamp” and “Oil change due 300 miles.” If applicable, the related standard icon is shown to the left of the text box (for example, a fuel pump, next to a “Low fuel” text message). All drivers were shown the same (visual) system, displayed on a monitor mounted on the IP, to the right of the visual route guidance system. During the test route, all drivers were presented with the artificial warning “Oil change due 300 miles,” when driving along Huron River Drive, before Haggerty Road South. Later, a “replace turn signal lamp” message was added to the previous message, on the second section of I-275 north (shown in figure 7). For further details describing the interface of this system, readers are referred to the separate report on the vehicle monitoring driver interface.[14]
19
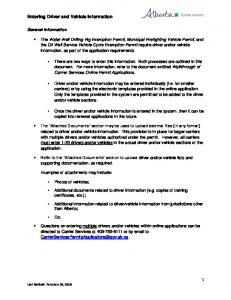
Test Route The route used for the route guidance test session is shown in figure 8. This course began at the parking lot of the St. Paul’s Lutheran Evangelical Church in Belleville, Michigan and ended at the Hardees restaurant lot in Canton, Michigan. It contained a mixture of expressways and residential, suburban, and city/business roads. Drivers were required to make 19 turns during the 35-minute trip to reach the destination.
20
FINISH HAGGERTY
M-153 FORD
Canton, MI
KEY = traffic signal = stop sign = flashing yellow = flashing red = straight nav data 45 = speed limit
N
I-275
55
1 km 1 mi 45
US-12 MICHIGAN
HANNAN
VAN BORN
45
ECORSE
45 Ann Arbor, MI 14 miles
HAGGERTY S
SUMPTER
HURON RIVER
GREYLOCK
BEDELL
HI GH
45
65
ROBBE
25
Belleville, MI
START
Figure 8. Test route. 21
Detroit, MI 20 miles
N
ELWELL
25
I-94
TY ER GG HA
N O EL TY AD ER A M LIB OL G AN ILLE EV LL BE BIA COLUM
CLARENCE
I-275
Toledo, OH 50 miles
Forms and Questionnaires Copies of the paperwork (consent form, biographical form, subject instructions, written directions for preplanned route to Canton, and post-study questionnaires) are in the appendices. Test Activities and Their Sequence The pair of participants met the experimenter at UMTRI, where the introductory explanations and paperwork were completed. Participants were told the experiment would take about two and a half hours, for which they would each be paid $30. (A copy of the experimental procedure is in the appendix.) The experimenter also explained the purpose of the study, to evaluate the design of an advanced driver information system. Each participant's vision was checked with a Titmus Vision Tester, and the consent and biographical forms were completed (copies of these forms are in the appendix). Participants then decided who would be the driver and passenger. While sitting in the test vehicle, the test equipment (cameras, microphones, etc.) was pointed out. If it was a HUD route guidance session, the HUD/mirror was mounted on the windshield, and adjusted by the driver so the entire reverse-scanned display monitor was visible. The experimenter conveyed some rules about the experiment: always obey the speed limit, drive slowly when crossing railroad tracks (to avoid damaging the equipment), and allow enough headway for braking. The written directions to a parking lot in Belleville were given to the pair. The experimenter reminded the participants to work together to get to the destination, and that unless they got lost, they would be "on their own." As stated earlier, there were three parts to the experiment. The first involved driving to Belleville (a town 20 minutes away), using written instructions provided by the experimenter. The second part involved actually using the advanced driver information system (route guidance, traffic information, IVSAWS, and vehicle monitoring) to get from Belleville to a restaurant in Canton (about 35 minutes away). The third part involved the return trip to Ann Arbor, using a highlighted map provided to the pair. Participants were asked to "think aloud" while driving, by discussing the controls, displays, route guidance information, the car, etc. They were especially encouraged to discuss anything that was unclear or confusing. They were not told details of the system, such as its format or the type of information it provided, nor given any instructions on its use. During the first and third parts (when the in-car information systems were not in use), the driver was asked to perform seven different tasks associated with using common controls and displays. This data provided an indication of the times associated with tasks that are common and acceptable for driving. These tasks included turning the radio on and off, reading the vehicle speed, changing the radio station using a preset button, reading the radio station frequency, and changing the fan speed. The driver and
22
passenger were able to discuss the tasks with each other, but the driver was the one who completed the tasks. Part 1 - Ann Arbor to Belleville At the start of part 1, driving data (throttle position, vehicle speed, steering angle, and turn signal activation) were recorded. The driver and forward scene images and the audio were also recorded. The seven driver tasks were requested, one at a time, when a safe point along the expressway was reached. (All requests were made on US-23 south or I-94 east.) All teams received the same requests in the same order for part 1. The experimenter surreptitiously timed the duration of these tasks. A stopwatch (with its tone disabled) was used to record the duration from the time the request was made, to the time the driver’s hand was put back on the wheel (for tasks requiring a manual operation), or after completion of the verbal request to completion of the driver’s response (for verbal responses). (If drivers did not rest their hands on the steering wheel, time was recorded until the task was done and drivers rested their hand.) While driving out to the test route, the participants were not interrupted unless they made a wrong turn. Part 2 - Belleville to Canton When the destination was reached, part 2 began. The participants were told that an incar system would provide them with “information” on getting to a restaurant in Canton. (No additional training was provided.) The experimenter explained that the route was not necessarily the most direct; however, it was being used to test the design of the system in a variety of situations. They were told it was approximately 30 minutes away. In addition to route guidance information, the system would provide additional information. If that information included a warning, the participants were instructed to proceed with caution. They were also reminded that they would be on their own to figure out the use of the system, and only if they made a wrong turn would the experimenter help them. They were also reminded to discuss what they were doing and thinking. When participants began, the experimenter began collecting driving data, and began video-taping. (For a complete list of the route guidance, IVSAWS, traffic information, and vehicle monitoring screens, please see figures 5 to 9, above.) At predetermined points along the route, IVSAWS, vehicle monitoring, and traffic information screens were presented. If an appropriate IVSAWS hazard became visible along the route, the experimenter could also present them on-the-fly. Possible IVSAWS messages were police, ambulance, construction, traffic light out of order, fire truck, unloading school bus, mail delivery truck, and train at crossing. An emergency vehicle needed to have on its lights or sirens to warrant a warning. At no point throughout this experiment did any of these unscheduled warnings occur. If the driver-passenger pair had departed from the route at any point, an "off route" screen would have been displayed. (None of the instrument panel or HUD pairs went off course.)
23
Upon reaching the destination, a restaurant in Canton, the pair were interviewed about their experiences, opinions, and actions with the use of the system. The experimenter elicited general comments concerning the system, followed by specifics concerning the four types of information systems. (For select comments from these interviews, see the appendix.) Part 3 - Canton to Ann Arbor After the interview and comments, the pair began part 3. The experimenter gave them a highlighted map and told them to go from the marked "X" (the restaurant) to the "O" (UMTRI). The subjects, again, worked together to determine how to get from Canton, back to Ann Arbor. Unless a wrong turn was made, the experimenter did not comment during the trip. Driver comments were noted. Upon arriving at UMTRI, the experimenter briefly reminded them about each of the four information systems. Each participant received questionnaires and was told to respond based on past experiences and those from the current study. The two questionnaires asked participants about the difficulty of driving while performing common in-vehicle tasks, as well as performing tasks related to the use of the four information systems. Another questionnaire provided statements about the ease of use and safety of various aspects of the system as a whole, and the route guidance system on its own. Finally, subjects answered questions about future car buying and their willingness to pay for the whole advanced driver information system (all four systems). (Copies of all questionnaires are in the appendix.) Following completion of the questionnaires and the payment form, the participants were paid $30 each and thanked for their time. Results of Subjects-in-Tandem Experiment Turn Errors Turn errors were defined as wrong turns, where drivers actually diverted from the test route. Errors were identified from videotapes and notes from the test sessions. Three errors were made for all test runs, with all errors occurring in the auditory route guidance condition. Table 3 describes the turn errors. The first error, at Madelon Street and Robbe Avenue, occurred early in the route, in a residential area. The other two errors occurred at an unusual intersection, Huron River and Haggerty Road South. The auditory route guidance message, presented prior to this intersection, instructs drivers to turn left at “the flashing red light, at Haggerty Road North.” Before drivers reached that intersection, they encountered a flashing yellow light at Haggerty Road South. (Haggerty Road North was not visible a half mile further along Huron River Drive around a bend.)
24
Table 3. Executed turn errors for test route. Intersection Driving on: Madelon St
Error description
At: Robbe Av
Turned right (not left) Turned at yellow flasher at Haggerty Rd N, (not at red Huron River Dr Haggerty Rd S flasher at Haggerty Rd S) Turned at yellow flasher at Haggerty Rd N, (not at red flasher at Haggerty Rd S)
RG system user
Driver age group
Auditory Younger Auditory Older Auditory Younger
Participants’ Comments Transcripts and notes from the test session revealed a number of items that were confusing to test participants (both drivers and passengers). Transcripts from an IP route guidance condition, and an auditory route guidance condition are in the appendix. General comments are shown below. In the Auditory route guidance condition, comments included: • “Michigan left turn” (turn right, followed by a u-turn) message onto Michigan Avenue was too long. • The street name change (from Huron River Drive to Columbia Avenue) was confusing. (In the next instruction subjects were told to turn onto Huron River Drive.) • The 5-way intersection (from Columbia Avenue onto Huron River Drive) was confusing. • Lack of confidence in the mileage timing at first. (One driver kept reconfirming the mileage with the trip odometer.) For the HUD route guidance condition, comments included: • The street name change (from Huron River Drive to Columbia Avenue) was confusing. • Misunderstanding the red flashing light as a regular (three light) traffic signal that was currently showing a red light. • Wanting to know the total time to the destination. • Wanting railroad crossings shown. • Feeling that the HUD blocked the driving scene. • Feeling that the HUD was in a good location.
25
For the IP route guidance condition, comments included: • Wanting to know what kind of road types there were, 2-lanes, etc. • Wanting to know entire time to destination. For the other systems (traffic information, vehicle monitoring, and IVSAWS), comments included: • The traffic information was too complex. Also, drivers did not know the location of Van Born Road in relation to their current position. • The “Oil change due in 300 miles” was displayed on the screen too long. Drivers seemed to think its importance did not warrant continuous display, or that it should at least count down the mileage if it remained visible. (In the design of the vehicle monitoring interface, the countdown for oil change was in 100 mile increments.) • Uncertainty in proper reaction to artificial warnings (for hazards that did not exist, such as the school bus), because they were mixed with actual warnings and route guidance information. Auditory Route Guidance Users’ Repeat Requests All subjects were able to request hearing the previous route guidance instruction (with updated mileage) at any time along the test route. Table 4 summarizes the location of those repeat requests. Two were requests for immediate replay of complex (lengthy) messages, one is after a relatively long span of silence from the system, and two were at a location where the intersection is not signed well. Table 4. Repeat requests for auditory route guidance users. Type of message
Location
Prepare At At At Prepare Prepare
1.5 mi before Haggerty Rd North 0.3 mi before Haggerty Rd South 0.3 mi before entering I-94 East 0.3 mi before entering I-94 East 0.3 mi before Michigan Av 1 mile before Ecorse Rd exit ramp
Driver age group Younger Younger Younger Older Younger Older
Task Difficulty ratings Due to the small sample size (n = 12), analysis of questionnaire responses was performed by inspection rather than statistically. (A copy of the task difficulty questionnaire is in the appendix.)
26
Both drivers’ and passengers’ ratings on the difficulty of various driving tasks are summarized in table 5. The driving tasks perceived as easiest (with mean difficulty ratings under 2.0) were adjusting the car radio or fan speed, reading the speedometer, and talking with passengers. The most difficult activities include looking for addresses, changing a cassette tape, drinking a beverage, and reading maps while driving. Of the tasks listed, subjects had been requested to complete four during the experiment (numbers 1, 2, 3, and 5 of table 5). Table 5. Mean difficulty ratings for performing common tasks while driving.
1 2 3 4 5 6 7 8 9
Common driving task Not difficult 1 ---------->10 Extremely difficult Changing stations on the car radio using preset buttons. Reading the speed on the speedometer. Turning on & off the car radio. Talking to other people in the car. Adjusting the fan speed on the car heater or air conditioner. Drinking a beverage. Changing a tape cassette in a car stereo. Reading a map. Looking at street numbers to locate an address. (n=11) (n=12 except for item 9)
Overall mean 1.3 1.3 1.5 1.5 1.8 3.4 3.8 5.5 5.9
The mean difficulty ratings for tasks associated with using the route guidance system are shown in table 6. Participants rated these tasks based on the route guidance (RG) system they had used (auditory, HUD, or IP), and without being told of the other implementations of the driver interface. All of the tasks were rated almost equally difficult over all conditions. Comparing systems, a slight difference exists for the IP condition, where participants (both drivers and passengers) rated all the tasks less difficult (mean = 1.3) than did the auditory or HUD participants (means = 2.1 and 2.4 respectively). It is not clear if these differences in mean ratings are due to the systems, or to individual differences, as the sample size is four for each RG user group. Given the small sample size, the results should be viewed as suggestive only. Readers are reminded that the purpose of the experiment was to determine if there were major flaws in the driver interfaces or the experimental protocol; not to provide definitive answers to questions regarding the merits of alternative interface formats, etc. For those limited purposes, a small sample size is appropriate.
27
Table 6. Mean difficulty ratings for using route guidance systems while driving.
Route guidance (RG) task difficulty statement Not difficult 1---------->10 Extremely difficult
Mean rating HUD Overall IP AUD mean RG RG RG user user user s s s 2.0 1.3 2.3 1.8 2.3 1.3 2.3 1.9 2.0 1.3 2.5 1.9
Determining the next maneuver from the RG system. Looking for the next turn indicated by the RG system. Listening to, or reading, the information on the RG system. Mean by RG user group 2.1 1.3 2.4 1.9 (Aud n=4, IP n=4, HUD n=4) **Note: Half the subjects were not drivers. Also, half of HUD responses (from the passengers) shown are based on an IP display.
Additional task difficulty ratings are shown in table 7. The task relating to the visual RG system users only was rated equally as difficult (mean = 1.7) as those tasks shown in table 5. The auditory only task was rated the most difficult (mean = 2.8) of all route guidance associated tasks. These route guidance tasks, however, were rated less difficult than half of the common driving tasks shown in table 5. Table 7. Additional mean difficulty ratings for using route guidance systems while driving.
Route guidance (RG) task difficulty statement Not difficult 1---------->10 Extremely difficult Remembering the next maneuver after hearing it. Looking at the RG screen to see it update. (Aud n=4, IP n=4, HUD n=4)
Mean rating HUD Overall IP AUD mean RG RG RG user user user s s s 2.8 n/a n/a 2.8 n/a 1.0 2.3 1.7
Evaluation of specific features of the route guidance systems indicate that the three features in common with all route guidance modes (landmarks, upcoming intersection information, and the distance to the next maneuver) were most favored. A scale from strongly agree (1) to strongly disagree (5) was used to evaluate statements about the route guidance system. See table 8.
28
Table 8. Mean level of agreement to usefulness of specific features of the auditory, IP, and HUD route guidance systems. Mean rating HUD Overall IP Route guidance evaluation AUD mean RG RG Strongly agree 1 ---------->5 Strongly disagree RG user user user s s s The information about upcoming (distant) intersections 1.3 1.0 1.3 1.2 was useful. The landmarks (traffic lights, bridges, etc.) were useful. 1.3 1.0 1.3 1.2 The distance to the next maneuver information was useful. Mean by RG user group (Aud n=4, IP n=4, HUD n=4)
2.0
1.0
1.0
1.3
1.5
1.0
1.2
1.2
Overall, participants somewhat agreed that all of the features were useful. See table 9. Visual route guidance users somewhat agreed that the compass and current block address information were useful, despite being the least favored of the features. The auditory system users strongly agreed the landmarks and upcoming intersection information were useful. The IP system users were most favorable to the landmarks, upcoming intersection, distance, and timer information. The distance to the next maneuver information was the most useful to the HUD users, followed closely by the landmarks, upcoming intersection, and current town information. Table 9. Mean level of agreement to usefulness of specific features of the IP and HUD route guidance systems.
Route guidance evaluation Strongly agree 1 ---------->5 Strongly disagree The current block address information was useful. The current town information was useful. The timer countdown bars are useful. The compass was useful. Mean by RG user group (Aud n=4, IP n=4, HUD n=4) *n=3 **n=2
Mean rating HUD Overall IP AUD mean RG RG RG user user user s s s n/a 1.8 1.5 1.6 n/a 1.5 1.3 1.4 n/a 1.0* 1.5 1.3 n/a 2.0** 1.8 1.8 n/a 1.6 1.5 1.5
Table 10 presents the mean task difficulty associated with the traffic information system. On the average, hearing the alert tone (the same signal for the hazard warning and
29
vehicle monitoring system) was not difficult (mean = 1.4). Reading the traffic information reports was more difficult (mean = 2.2) than reading (or listening to) the route guidance information (see table 6). In particular, reading the traffic information reports was more difficult than reading the route guidance displays for the IP and hearing route guidance for the auditory users, but less difficult to the HUD users. Table 10. Mean difficulty ratings for using the traffic information system while driving.
Traffic information (TI) task difficulty statement Not difficult 1---------->10 Extremely difficult
Mean rating HUD Overall IP AUD mean RG RG RG user user user s s s 2.0 1.3 1.0 1.4 2.0 2.5 2.0 2.2 2.0 1.9 1.5 1.8
Hearing the TI report alert tone. Reading, or listening to, the TI report.* Mean by RG user group (Aud n=4, IP n=4, HUD n=4) *Note: Although traffic information was only in visual mode, this statement erroneously asked about “listening” to the report.
The ratings for the difficulty of hazard warning tasks varied from 1.8 to 3.0, as shown in table 11. The most difficult task associated with using the hazard warning system was understanding the location of the hazard (mean = 3.0). This task was rated the most difficult of those relating to all in-vehicle information systems. Perhaps some of the confusion can be attributed to the use of “real” and “artificial” warnings. For example, the first hazard warning presented, “construction ahead,” was real, while the second, “school bus ahead to left,” was artificial. Participants were told that some of the warnings would be real, but not told which ones, or exactly how to respond. It is also difficult to determine if the higher mean rating results from not understanding the location cue on the hazard warning system or from the nonexistence of an actual hazard. While there was some relative difficulty understanding the location of the hazard, participants said identifying the hazard was the least difficult task associated with this system (mean = 1.8).
30
Table 11. Mean difficulty ratings for using the hazard warning system while driving. Mean rating HUD Overall IP Hazard warning (HW) task difficulty statement AUD mean RG RG Not difficult 1---------->10 Extremely difficult RG user user user s s s Identifying the hazard from the HW system. 1.3 2.5 1.5 1.8 Looking out the window for the hazard identified by the 1.5 2.5 2.0 2.0 system. Understanding the location of hazard. 2.8 3.5 2.8 3.0 Mean by RG user group 1.9 2.8 2.1 2.3 (Aud n=4, IP n=4, HUD n=4) Difficulty of tasks relating to the vehicle monitoring system ranged from 1.4 to 2.0. Determining the vehicle’s problem and the location of that problem (means = 1.6 and 1.4, respectively) were the easiest of the vehicle monitoring tasks, as shown in table 12. While the task of determining the severity of the problem received a mean of 1.8, or not very difficult, no one mentioned the color coding of vehicle monitoring problems. As discussed above with hazard warnings, since the participants did not know beforehand which warnings would be real or artificial, perhaps the difficulty rating would be different outside of the experimental setting. Table 12. Mean difficulty ratings for using the vehicle monitoring system while driving. Mean rating HUD Overall IP Vehicle monitoring (VM) task difficulty statement AUD mean RG RG Not difficult 1---------->10 Extremely difficult RG user user user s s s Determining where the problem is on the car. 2.0 1.0 1.3 1.4 Identifying the problem from the VM system. 2.0 1.3 1.5 1.6 Determining the severity of the problem. 1.5 2.5 1.3 1.8 Determining what action to take based on the identified 1.8 1.3 3.0 2.0 problem. Mean by RG user group 1.8 1.5 1.8 1.7 (Aud n=4, IP n=4, HUD n=4) In summary, drivers were able to rate the interface characteristics of interest, and to the extent that the small sample size permits, the ratings were reasonable and consistent. However, given the small sample size, not too much emphasis should be placed on the differences noted between interface types.
31
Safety, Ease of Use, and Utility Evaluations Participants indicated their level of agreement to safety, usability, and utility statements relating to the systems, using the same five-point scale as before (from strongly disagree to strongly agree). All participants responded favorably to the safety of using their respective route guidance and other systems, as shown in table 13. In particular, participants (both drivers and passengers) strongly agreed that it was safe for passengers to use the system while driving (mean = 1.3), and somewhat agreed that it was safe for themselves to use it while driving (mean = 1.6). This suggests to the authors that further testing could be conducted without undue risk to participants. Table 13. Mean level of agreement to safety and usability issues for using the four invehicle information systems.
Safety/Ease of Use Statement Strongly agree 1 ---------->5 Strongly disagree It is safe for a passenger to use this system while I drive. It is safe for me to use this system while driving. It was easy for me to figure out how the system worked. It is safe for inexperienced drivers to use this system while driving. Mean by RG user group (Aud n=4, IP n=4, HUD n=4)
Mean rating HUD Overall IP AUD mean RG RG RG user user user s s s 1.8 1.0 1.3 1.3 1.8 2.0
1.0 1.0
2.0 2.0
1.6 1.7
2.5
1.8
3.8
2.7
2.0
1.2
2.3
1.8
Despite receiving no training or instruction about the various systems, on average, all participants also somewhat agreed it was easy for them to figure out how the system worked (mean = 1.7) The IP route guidance users consistently rated the safety and ease of learning of the system more favorably than the other two conditions. This difference is most apparent when evaluating the perceived safety of an inexperienced driver using the system. IP route guidance participants somewhat agreed to its safety (mean = 1.8), auditory route guidance participants were neutral (mean = 2.5), and the HUD users somewhat disagreed (mean = 3.8). In evaluating the ease of use of the HUD/mirror, participants were somewhat neutral (mean = 2.5). See table 14. Table 14. Mean level of agreement to ease of use of HUD/mirror.
32
Safety/Ease of Use Statement Strongly agree 1 ---------->5 Strongly disagree It is easy for me to use the HUD/mirror while driving.
Mean rating HUD Overall IP AUD mean RG RG RG user user user s s s n/a n/a 2.5 2.5
Overall, participants most strongly agreed they would use an in-vehicle information system (of the type they used in the experiment) in unfamiliar areas (mean = 1.1). See table 15. Participants were also most favorable (most strongly agreed) to the information provided by the route guidance and traffic information systems (means = 1.3), followed by the hazard warning and vehicle monitoring systems information (means = 1.4 and 1.5, respectively). Also, participants somewhat agreed that they would rather use a route guidance system (similar to the type they had used) than use written instructions or a map. While participants somewhat agreed they would use the system (all four together) if in a hurry, they were neutral about using the system for their daily travel. (Data were not collected on subjects’ daily driving patterns, however.)
33
Table 15. Mean level of agreement to utility issues for using the 4 in-vehicle information systems. Mean rating HUD Overall IP Utility statement AUD mean RG RG Strongly agree 1 ---------->5 Strongly disagree RG user user user s s s I would likely use this system when driving in unfamiliar 1.0 1.0 1.3 1.1 areas. The route guidance information provided by this 1.5 1.0 1.3 1.3 system is useful. The traffic information provided by this system is 1.5 1.3 1.3 1.3 useful. The hazard warning information is useful. 1.8 1.3 1.3 1.4 The vehicle monitoring information is useful.
1.8
1.3
1.5
1.5
I would rather use a route guidance system similar to this than use written instructions to find my way. I would rather use an RG system similar to this one than a standard paper route map to find my way. I would use this system if I were in a hurry.
1.3
1.0
2.3
1.5
1.8
1.0
2.0
1.6
2.5
1.5
2.0
2.0
I would likely use this system for my daily travel.
2.3
2.3
3.0
2.5
Mean by RG user group (Aud n=4, IP n=4, HUD n=4)
1.7
1.3
1.8
1.6
Usefulness and Usability Rankings Overall, of all systems, the route guidance system was most useful to all users, as shown in table 16. The IP route guidance system received a mean rank of 1.0 from its users, while the auditory and HUD route guidance systems both received mean ranks of 1.5 from its users. From inspection, differences in ratings among the other three systems are small. Differences in mean ratings among those three systems were highly similar for each of the route guidance interface groups. Since there were no differences in the ratings of the three non-route guidance systems that the all users saw, differences in the ratings of the route guidance interface reflect differences in safety and usability, not in scale bias.
34
Table 16. Mean ranks for the usefulness of the four invehicle information systems.
System Best 1 -----> 4 worst
Aud RG users Route guidance 1.5 Traffic information 2.5 Hazard warning 3.0 Vehicle monitoring 3.0 (Aud n=4, IP n=4, HUD n=4)
Mean Rank HUD IP RG RG users users 1.0 1.5 2.8 3.0 3.3 3.0 3.0 2.5
Overall mean 1.3 2.8 3.1 2.8
There were no substantial differences in the relative usability ratings of the four system interfaces (by inspection), with all interfaces receiving mean rankings ranging from 1.9 to 2.9. (See table 17.) (The highest mean ranking any system received was 1.5 for the route guidance system within the IP condition.) Perhaps the inherent differences in the functionality of the systems (or modality, in the auditory route guidance condition) made comparison difficult. Table 17. Mean ranks for the usability of the four in-vehicle information systems.
System Best 1 -----> 4 worst
Aud RG users Vehicle monitoring 1.8 Route guidance 2.3 Hazard warning 3.5 Traffic information 2.5 (Aud n=4, IP n=4, HUD n=4)
Mean Rank HUD IP RG RG users users 1.8 2.3 1.5 2.8 3.5 2.0 3.3 3.0
Overall mean 1.9 2.2 3.0 2.9
Thus, there were no major problems in using any of the three versions of the route guidance system or the traffic information, hazard warning, and vehicle monitoring systems. Drivers made few turn errors and arrived at their destinations safely. Drivers rated the interfaces as rather safe and easy to use. There were no major problems with the test protocol. Hence, the system was safe enough for more extensive testing.
35
INDIVIDUAL DRIVER EXPERIMENT Purpose The purpose of this experiment was to examine the relative safety and ease of use of the four driver information systems overall (route guidance, traffic information, IVSAWS, and vehicle monitoring), as well as three alternative driver interfaces for the route guidance system. Of interest were various performance measures related to speed, lane variance, throttle use, and steering wheel use, as well as eye glances and ratings of safety and ease of use. This initial set of data was also intended to provide some representative driver performance data for the safety and ease-of-use certification protocol being developed.[19] Method Individual drivers followed the same general procedure as described in the subjects-intandem experiment, with a few exceptions. In this experiment, drivers were given verbal instruction on the four in-vehicle systems, and shown paper reproductions of the interfaces. In addition, drivers practiced using the route guidance system along a 10 minute (3 turns, 6 screens) route. Subjects were directed to the test route verbally by the experimenter, but the same test route as before (from Belleville to Canton) was used. Some changes were made, however, to the information system interfaces based on the paired subjects experiment. Those changes are described later in this section. Participants completed the same post-study questionnaires as in the previous study. Additionally, all practice sessions, test sessions, and post-study interviews conducted in the test vehicle were recorded on videotape. Test Participants Forty-three drivers participated in this experiment. This included 24 younger drivers (ranging in age from 18 to 30 years old, mean = 21), and 19 older subjects (from 60 to 74 years, mean = 66). The education levels of all subjects ranged from “some high school” to “graduate school degree.” The mean annual mileage that was reported ranged from 500 to 50,000 miles (mean = 13,000). None of the drivers had ever used an in-vehicle route guidance system nor a HUD. The mean map usage over the past 6 months was “3 to 4 times,” ranging from “0 times” to “9 or more times.” The corrected visual acuity of all subjects ranged from 20/18 to 20/100, using a Titmus vision tester. Due to the variable quality of the different data streams (mainly eye glance and lane tracking), different sample sizes were used for various analyses (e.g., driver behavior with the route guidance system, eye glances for each of the four systems, preferences, etc.). Sample sizes are noted in the results section for each analysis.
37
Test Materials and Equipment Test Vehicle The instrumented test vehicle was the same one used in the subjects-in-tandem experiment, a 1991 Honda Accord station wagon. (For a diagram of the equipment and model numbers, see the previous “test vehicle” section, figure 1.) In addition to the sensors described previously, a NAC model V eye glance recorder was worn by younger subjects. Older subjects did not wear the eye camera due to its weight and possible discomfort. The system provided analog output for eye glance coordinates accurate to the nearest degree. This output is recorded on the 486 computer. Figure 9 shows a subject wearing the eye mark recorder.
Figure 9. Young subject wearing the eye mark recorder. Practice route The route began with the test vehicle parked in front of UMTRI. Drivers went west out of the UMTRI parking lot for about 0.1 mi on Baxter (which has little traffic) and turned right at the end onto Huron Parkway, a divided four-lane road. The screens from the visual route guidance practice are shown in figure 3. The messages used for the auditory route guidance practice are in table 1. Participants traveled for 0.3 mi to a traffic light and straight another 0.3 mi to the next stop sign (Nixon Road). From there they turned left and went to the next traffic light at Plymouth Road. Plymouth Road is four lanes and carries a moderate amount of traffic. They then continued straight, though two traffic lights, for about 0.9 mi onto an expressway entrance ramp to US-23 south. Test Route The same test route, as used in the subjects-in-tandem experiment, was used for the test of the fully integrated system. See the previous “test route” section (figure 8, above) for a description of the route. In brief, the main test section took 35 minutes to drive, contained 19 turns, and involved driving on expressways and through residential areas. Forms and Other Materials Prior to the test session, a consent form, summarizing the study, was completed by all subjects. In addition, a biographical form was used to obtain information on participants 38
and their driving experience. A sample display screen from each of the four systems (reproduced on paper) was used to explain the test procedure to participants. The same post-study questionnaire regarding preferences on the usability, safety, and utility of the systems was administered, as in the previous experiment. The test procedure and copies of all forms and materials are in the appendix. Test Activities and Their Sequence The test sequence for this experiment was very similar to the subjects-in-tandem study described previously. The differences are noted below. (For the detailed experimental procedure, see the appendix.) Test participants met the experimenter at UMTRI and were provided with an overview of the study. The experimenter explained, in detail, each of the four systems the driver would be using, by showing paper reproductions from each system (see figure 10). (There was a verbal explanation of the auditory route guidance system.) Participants were also told they would operate various controls in the car, before and after using the driver information system.
Route guidance
Traffic information
IVSAWS
Vehicle monitoring
Figure 10. Example screens used for system descriptions.
39
Once in the test vehicle, the displays for the information systems were explained to the driver. Drivers then completed a 5-minute practice session using only the route guidance system. The practice route began at UMTRI, involved 6 route guidance screens (3 turns and 3 “continue straight” displays), and ended at the expressway entrance enroute to Belleville. Once on the expressway, participants used various controls and displays, when request by the experimenter. Upon arrival at the designated starting point in Belleville, younger drivers were fitted with the eye camera. It was emphasized that the duration of wear of the eye camera was dependent on the comfort of driver, with no penalty or reward for the duration of its use. The same driving performance data, and videotaped images and comments, were recorded in this experiment as in the previous experiment. Upon arrival at the destination, a restaurant in Canton, the eye camera was removed from the younger drivers. While still in the restaurant parking lot, drivers were interviewed with the same questions used in the previous study. On the return trip to UMTRI, drivers repeated the controls tasks, again timed by the experimenter. At UMTRI, the participants completed the questionnaires, and were paid.
40
Results from Individual Driver Experiment Data Processing The data streams, from the instrumented vehicle, analyzed for this experiment were: the steering wheel angle (30 Hz), lane position (10 Hz), speed (10 Hz), and throttle angle percent (30 Hz). Of these data streams, three were processed before analysis. The speed signal occasionally doubled for one or two samples. These errors required only minor processing to remove. The steering wheel angle data contained spikes of 3 to 4 degrees and some lower magnitude noise. The lane position data from subjects numbered 1 through 32 contained large spikes and deviations of 2 to 3 ft. Modifications of the software and recalibration reduced spikes and deviations to the range of only 0.25 to 0.5 ft for subjects numbered 33 through 44. The steering and lane position data were processed similarly. The processing software first removed spikes from the data and then did a boxcar smoothing of the data. A spike was defined as a point whose first difference, (dn - dn-1), from its adjacent points was greater than 1.5 times the mean of the absolute value of the first differences for the whole segment. If the absolute value of the adjacent first differences was greater than this criterion, and the differences were of opposite sign (i.e., a spike, not two consecutive jumps in the same direction), then the point was replaced by the mean of the adjacent points. This algorithm was run two consecutive times with the mean of the absolute value of the first differences for the data being recomputed before the second, spike-removal run. The second type of filtering was a boxcar smoothing algorithm. This is a simple moving average centered on the point being computed, so it does not induce any delay or lag in the data. The frequency response of this filter is sin(x)/x. Two consecutive passes of this filter were employed, the equivalent of processing the data with a triangular filter. Tests of the filter on a square wave input indicated that two passes of the boxcar filter introduce a spread in the data of about 1.1 times the width of the moving average. By visual inspection of multiple runs of the filter, optimum widths were determined for the data. For the steering data a width of 0.2 second was used (7 samples), and for the lane position data, 1 second (11 samples). Figure 11 shows an example graph of the steering data showing raw and processed data streams. Figure 12 shows an example of the lane position data.
Figure 11. Steering data processing example.
41
Figure 12. Lane position data processing example. When the earlier subjects were run, the lane tracker was not properly calibrated and the software was having difficulty with the broken center lane markings. The smoothing algorithm seemed to produce a good final data stream, and a function was computed to post-calibrate the data. After the data for all the segments were processed and wave forms plotted, the experimenters decided the lane position data from subjects 1 to 32 were not characteristic enough of the much cleaner data, from subjects 33 to 44, and were not analyzed further. Figure 13 shows an example of clean lane position data, and figure 14 shows an example of poor lane position data. “Lane tracker lock” refers to a data stream in the vehicle’s output file that indicates whether the lane tracking software detected a valid lane mark. When the lane tracking software loses the line it continues to insert into the output file the same position value from the last time it was locked. (It must be noted that the lane tracker was a new, experimental device still under development.)
4.0
3.0 2.5 2.0 1.5
Sample number Figure 13. Good lane position data.
42
253
235
217
199
181
163
145
127
109
91
37
0.0
19
0.5
73
1.0
55
Final smooth data Original data Lane tracker lock (2 locked, 1 unlocked)
1
Lane position (ft)
3.5
Final smooth calibrated data Original data Lane tracker lock (2 locked, 1 unlocked)
8 7
Lane position (ft)
6 5 4 3 2 1
295
274
253
232
211
190
169
148
127
106
85
64
43
22
1
0 Sample number Figure 14. Noisy lane position data. If a segment of unlocked lane position data was longer than the width of the boxcar smoothing filter, the processing software would stop averaging until it found new locked data. This way, the old lane position data point from the last lane lock would not influence the new lane position data when the lane tracker locked on again. If the segment of unlocked data was shorter than the width of the boxcar filter, the filter averaged in the repeating data as if it were locked data. When the mean and standard deviation of the lane position was computed, the values for which the lane tracker was unlocked were not used. Another difficulty with the lane position data occurred on sunny days, in late morning, when the test vehicle was heading directly north. The lane tracking system would detect the contrast between the shadow of the vehicle and the bright road, and identify this as the lane mark. Due to real-time computation constraints, the video analysis software did not have time to determine if the “line” it had found was of valid width. In figure 15, the lane tracker was detecting the shadow (at 2.3 ft). When the lane marker entered the shadow, the lane tracking software was able to detect the real lane position (all other points not at 2.3 ft). An algorithm was added to delete the data points on the shadow and replace them with the previous valid data point. This data stream was then processed the same as the other data.
43
3.5
Final smooth calibrated data Intermediate data Original data
Lane position (ft)
3.0
2.5
2.0
1.5
460
433
406
379
352
325
298
271
244
217
190
163
136
109
82
55
28
1
1.0
Sample number Figure 15. Example lane position data with shadow interference. Figures 16 and 17 show samples of speed and throttle variation over time for straight and curved expressway driving.
Figure 16. Expressway speed and throttle across time (straight road).
Figure 17. Expressway speed and throttle percent across time (curving road). Figures 18 and 19 show samples of lane position and steering wheel angle variation over time for straight and curved expressway driving. In figure 18, the “dip” in the lane position that occurs just before the 30-second mark is evidence of a lane change. In figure 19, lane changes are visible at the 5-second, and 30-second marks.
44
Figure 18. Expressway lane position and steering wheel angle across time (straight road).
Figure 19. Expressway lane position and steering wheel angle across time (curving road). Driving Performance on Straight Roads While Using the Route Guidance System Driving performance was examined separately for each of the eight measures. Table 18 shows a summary of the means and standard deviations. Comparable baseline and other route guidance data were collected in a subsequent on-the-road experiment.[17] Table 18. Summary of driving performance data. Measure
Mean
Mean steering wheel angle (deg) Standard deviation of steering wheel angle (deg) Mean throttle position (%) Standard deviation of throttle position (%) Mean lateral position (ft) Standard deviation of lateral position Mean speed (mi/h) Standard deviation of speed (mi/h)
-16.4 1.0 8.2 3.5 2.9 0.5 48.9 1.6
Standard deviation 0.6 0.4 2.8 1.5 0.6 0.2 10.1 0.8
Figure 20 shows the overall distribution for steering wheel angles. The mean angle was unaffected by driver age (p = 0.11), sex (p = 0.13), or route guidance interface design/group (HUD versus IP versus auditory, p = 0.60), but was affected by location (F(5,119) = 18.94, p= 0.0001). Figure 21 shows the mean steering wheel angle for each location. The slightly more negative value for the Hannan Road to Van Born Road segment probably indicates a slight curve of that road segment to the left.
45
50
Number of occurrences
45 40 35 30 25 20 15 10 5 0 -18.5
-18
-17.5 -17 -16.5 -16 -15.5 Mean steering wheel angle (deg)
-15
Figure 20. Distribution of mean steering wheel angle.
Mean steering wheel angle (deg)
-16.0 -16.2 -16.4 -16.6 -16.8 -17.0 -17.2 -17.4 Huron River Ecorse to Hannan to Hannan I-94 to Hannan Michigan I-275 to I-275 to VanBorn Ford Road Segment Figure 21. Mean steering wheel angle for selected road segments.
46
Figure 22 shows the distribution of the standard deviation of steering wheel angles for the selected road segments. The standard deviation was selected over other alternatives (e.g., steering wheel reversals, various spectral measures) for computational ease. Standard deviations of approximately 1 degree were typical. An ANOVA of these data showed significant differences due to interface design (F(2,108) = 5.79, p = 0.004), location (F(5,108) = 8.00, p = 0.0001), and driver sex (F(1,108) = 3.35, p = 0.07), but not driver age (p = 0.14). Also significant were the interactions of age and sex (F(1,108) = 3.67, p = 0.06). The interaction of location and interface (F(10,108) = 1.69, p = 0.09) was marginally significant. Figure 23 shows those results. The general pattern is that the standard deviation of steering wheel angle was largest for the IP design (1.1 degrees), slightly less for the HUD interface (1.0 degrees), and least for the auditory interface (0.9 degrees). For streets (Huron River Drive, Ecorse Road to Hannan Road, Hannan Road to Van Born, and Hannan Road to Michigan Avenue), differences between the HUD and auditory interfaces were negligible. For the section of the I-275 expressway to Ford Road there were no differences among interface types. For the section of I-94 to I-275 the difference between the auditory and other interfaces was quite large. For this section of the expressway there was fair amount of traffic. The sex-by-age interaction is shown in figure 24. Apparently, the younger women were less variable in how much they adjusted the steering wheel. The authors have no explanation for this finding. 60
Number of occurrences
50 40 30 20 10 0 0
0.5 1 1.5 2 2.5 3 Standard deviation of steering wheel angle (deg)
3.5
Figure 22. Distribution of the standard deviation of steering wheel angle.
47
Standard deviation of steering wheel angle (deg)
1.5 1.4 1.3 Huron River 94 to 275 Ecorse to Hannan Hannan to VanBorn Hannan to Michigan 275 to Ford
1.2 1.1 1.0 0.9 0.8 0.7 0.6 IP
Auditory
HUD Interface
Figure 23. Standard deviation of steering wheel angle for each interface and location.
Standard deviation of steering wheel angle (deg)
1.100 1.075 1.050 1.025 1.000 0.975 0.950 0.925 0.900
Driver age Younger Older
0.875 0.850
Male
Sex
Female
Figure 24. Standard deviation of steering wheel angle as a function of driver age and sex.
48
Figure 25 shows the mean throttle data for this experiment. The data clearly are not normally distributed. An ANOVA of these data showed significant effects of location (F(5,108) = 29.78), p = 0.0001) and marginal effects of age (F(1,108) = 3.23, p = 0.07) and interface design (F(2,108) = 2.97), p = 0.06). There were also location by age (F(5,108) = 6.65, p = 0.004), age by sex (F(1,108) = 4.19, p = 0.04) and age by interface (F(2,108) = 4.16, p = 0.02) interactions. Figure 26 shows the differences due to location. The section of I-94 (to I-275) was driven at a higher speed than the other sections of road, especially by younger drivers. 40 Number of occurrences
35 30 25 20 15 10 5 0 0
2
4
6 8 10 12 14 16 Mean throttle position (%)
18
Figure 25. Distribution of throttle positions.
49
20
22
Mean throttle position (%)
14 13
Driver age Younger Older
12 11 10 9 8 7 6 5
Hannan to Huron River Ecorse to Hannan Hannan Michigan I-275 to I-94 to Ford to VanBorn I-275 Road Segment Figure 26. Throttle position for each road segment.
As shown in figure 27, younger women tended to drive faster than other drivers, and in figure 28, younger drivers drove more quickly with the auditory interface.
Mean throttle position (%)
9.0 8.8 8.6
Driver age Younger Older
8.4 8.2 8.0 7.8 7.6
Male
Sex
Female
Figure 27. Mean throttle position as a function of driver age and sex.
50
9.75 Mean throttle position (%)
9.50 Driver age Younger Older
9.25 9.00 8.75 8.50 8.25 8.00 7.75 7.50 7.25 IP
HUD Interface
Auditory
Figure 28. Mean throttle position as a function of interface and driver age. For the standard deviation of throttle position, none of the factors of interest, location (p = 0.36), driver age (p = 0.79), driver sex (p = 0.16), or interface design (p = 0.20) were significant nor were any interactions of those factors. Figure 29 shows the overall distribution of the standard deviation of throttle position. Figure 30 shows the differences due to road segments.
51
20
Number of occurrences
18 16 14 12 10 8 6 4 2 0 1
2
3 4 5 6 7 8 9 10 Standard deviation of throttle position (%)
11
Standard deviation of throttle position (%)
Figure 29. Distribution of standard deviation of throttle position.
3.9 3.8 3.7 3.6 3.5 3.4 3.3 3.2 3.1 3.0 2.9 2.8 Huron River Ecorse to Hannan to Hannan I-94 to Hannan Michigan I-275 to I-275 to VanBorn Ford Road Segment
Figure 30. Standard deviation of throttle position for various segments.
52
Figure 31 shows the distribution of lateral position. Unlike the other measures, data were available for only some of the drivers because of problems with the lane tracker. There was a slight tendency for drivers to be positioned slightly to the left of center (mean lateral position = 2.9 feet, 12-foot lanes and a 6-foot wide car are assumed). There were no significant differences due to location (p = 0.17) or driver age (p = 0.69), but the effects of driver sex (F(1,25), p = 0.13), interface (F(2,25), p = 0.005) and their interaction (F(1,25) = 7.65, p = 0.01) were significant. (Note that in figure 32, which shows these relationships, no data are given for lateral position for female drivers using the auditory interfaces. The data were not recoverable.) The authors have no explanation as to why different groups have different biases in terms of lane position.
Number of occurrences
12 10 8 6 4 2 0 1.0
1.5
2.0 2.5 3.0 3.5 Mean lateral position (ft)
4.0
4.5
Figure 31. Distribution of lateral position. Figure 33 shows the distribution of the standard deviation of lateral position. In the ANOVA of standard deviation of lateral position, none of the factors of interest, location, driver age and sex, and interface, was significant (all p > 0.7). As with the mean position data, the standard deviation of lateral position was missing for several drivers.
53
Mean lateral position (ft)
3.4 3.2 3.0 2.8 2.6
Driver sex Male Female
2.4 2.2 2.0 IP
HUD Interface
Aud
Figure 32. Mean lateral position as a function of interface and driver age. Note: Lateral position data for females in the auditory condition were unrecoverable. 14
Number of occurrences
12 10 8 6 4 2 0 0.1
0.2
0.3 0.4 0.5 0.6 0.7 0.8 0.9 1.0 Standard deviation of lateral position (ft)
Figure 33. Standard deviation of lateral position.
54
1.1
Figure 34 shows the distribution of mean speeds for this experiment. An ANOVA of these data showed that the effect of location was significant (F(5,108) = 169.68), but not the effects of driver age (p = 0.76, driver sex (p = 0.82), or interface (p = 0.32). The bimodal distribution is the result of multiple speed limits. Figure 35 shows the mean speeds for each road segment. The mean speeds for the IP, HUD, and auditory interfaces were 48.2, 49.2, and 49.3 mi/h. 35
Number of occurrences
30 25 20 15 10 5 0 10
20
30
40 50 60 Mean speed (mi/h)
70
80
Figure 34. Mean speed. Figure 36 shows the standard deviation of speed, which clearly was a log normal distribution. The mean (of the standard deviation) was approximately 1.6 mi/h with a standard deviation of 0.8 mi/h. None of the factors of interest (location: p = 0.43; driver age: p = 0.32; driver sex: p = 0.99, or interface design: p = 0.21) were statistically significant. The standard deviations were 1.7, 1.4, and 1.6 mi/h for the IP, HUD, and auditory designs, respectively.
55
65 Driver age Younger Older
Mean speed (mi/h)
60 55 50 45 40 35 30
Huron River Ecorse to Hannan to Hannan I-94 to Hannan Michigan I-275 to I-275 to VanBorn Ford Road Segment Figure 35. Mean speed for each road segment.
40
Number of occurrences
35 30 25 20 15 10 5 0 0.0
0.5
1.0 1.5 2.0 2.5 3.0 3.5 4.0 Standard deviation of speed (mi/h)
Figure 36. Standard deviation of speed.
56
4.5
5.0
Turn Errors Although 43 drivers participated, a total of 30 drivers were run successfully. Problems with weather, equipment failure, etc., resulted in incomplete data for other drivers. Given the time of year when the data were collected and this being the initial use of the vehicle for extensive data collection, these losses are reasonable. For each of the 3 route guidance user groups (auditory, IP, and HUD), 4 drivers were in the younger age group and 6 were in the older group, with about half male and half female. Turn errors were determined by reviewing videotapes and notes of the sessions with subjects driving using the route guidance system. Errors were classified as either “near miss” turn errors (where the driver expressed confusion or hesitated) or “execution” turn errors (where the driver actually made a wrong turn, or missed the correct turn). The test route included 19 turns to reach the destination. The trip was completed in under 35 minutes in almost all cases. Over 30 test sessions, a total of 25 turn errors of both types were made along the route, as shown in table 19. Most of the errors occurred at two difficult intersections, one where three streets converged (with two sets of side-by-side traffic lights, at Columbia and Huron River), and a second where the street on which the turn should be made (Haggerty Road North), was similar in name (Haggerty Road South) and geometry to a street just before. This underlines the need for testing under a full range of road and intersection types.
57
Table 19. Turn errors for test route. Intersection
Error description
Driving on: At: Huron River Dr High St
Wanted to turn onto High St Driver was confused Wanted to turn too early Driver was confused Columbia Ave Huron River Dr Driver was confused Went straight at traffic light Went straight at traffic light Went straight at traffic light Wanted to turn onto Angola Huron River Dr Angola St Wanted to turn onto Angola Madelon St
Robbe Av
Did not stop for stop sign Did not stop for stop sign Robbe Av Bedell St (School bus IVSAWS was displayed) Robbe Av Clarence St Turned right onto Clarence Driver was confused Wanted to turn left Huron River Dr Haggerty Rd S Turned left Turned left Turned left Wanted to turn left Huron River Dr Haggerty Rd N Driver thought she was told to stop on the roadside Almost turned onto I-275 S I-94 East I-275 South Almost turned onto I-275 S I-94 East
I-275 North
Michigan Av
U-turn
I-275 exit ramp Hardees
Almost missed the exit (thought exits were numbered by mile, not by order) Passed the U-turn Unsure if destination was Hardees or Haggerty Road
RG system user
Type error NM= near miss E=execution NM NM NM NM NM E E E NM NM
Auditory IP IP HUD HUD Auditory Auditory IP IP IP
E E
IP IP
E NM NM E E E NM NM
IP HUD Auditory Auditory Auditory Auditory Auditory HUD
NM NM
Auditory Auditory
NM
HUD
E NM
HUD Auditory
The total number and types of errors are shown in table 20. Auditory route guidance users made the most execution and turn errors of the three route guidance user groups.
58
Table 20. Tally of execution and near miss turn errors by route guidance system. Route guidance system user Auditory IP HUD Total (n=30)
# Execution error 5 4 1 10
# Near miss error 6 4 5 15
Total # errors 11 8 6 25
Glances to Route Guidance Display Glance data to in-vehicle displays were examined for 8 drivers, 3 younger and 5 older, all of whom used the IP version of the route guidance system. Glance data were not examined for the HUD implementation because preliminary analysis showed that the position of the display made it difficult to distinguish glances to the HUD from glances to the road. Since there was no visual guidance display for the auditory implementation, glances for that condition were not examined. While older and younger subjects used the same information systems and test route, the main difference between the age groups was the use of the eye camera. Looking at the glance data, the authors cannot be confident that differences in glance behavior were due solely to age, since behavior may have been affected by the camera. The eye camera considerably reduced younger drivers’ field of view. It was sometimes necessary for subjects to turn their heads, as opposed to merely moving their eyes, to glance at the IP display. A data comparison of younger drivers with and without the eye camera cannot be made, as no younger drivers were run without the eye camera. The eye camera was worn to facilitate glance data reduction. Glance data were analyzed manually for the older subjects using a split screen videotape image that showed the driver’s face and the road scene. The faces of older drivers were unobscured, but each of the younger drivers wore an eye mark camera while driving the test route. (See figure 9, above.) The eye camera recorded the location of glances made by the driver, superimposed over the driver’s forward view. A time study program, written in BASIC, was used to log glances to the in-vehicle displays, the time it took participants to drive each road segment, the time spent in each maneuver (driving straight, turning, changing lanes), and other driving events.[26] Events included glances, turns, and system malfunctions. Videotapes of each driver were played at normal speed. When the analyst observed an event of interest, she pressed a key on the computer keyboard, which recorded the time to the nearest second and the key pressed. Codes and associated events are shown in table 21. Break points for directional changes (lane change, turns) occurred when a vehicle started from or returned to driving straight down a road, as shown by the forward scene camera. Since events were sequential, the completion of one driving maneuver (e.g.,
59
turning) was the beginning of the next (driving straight). Figure 37 shows how a hypothetical road segment would be coded. Table 21. Codes used in eye glance and driving event analysis. Code g
Event Glance
b
Beep
e
Exit
m
System malfunction Off route Change lanes Right turn Left turn
o c r l
Comment To in-vehicle displays on center console, press once per glance. Alerting tone produced by the vehicle monitoring, traffic information, or IVSAWS systems in the car (on second center console display). Press once at start of expressway entrance or exit ramp, once at end of ramp. Press once at start, once at end. Press once at start, once at end. Press once at start, once at end. Press once at start, once at end. Press once at start, once at end.
60
Start g g g
}
3 glances
}
4 glances
l
gg
expressway entrance ramp
gg e g
left turn l
g
e g g c c
}
lane change
End Figure 37. Coding of hypothetical road segment. Sometimes it was difficult to distinguish whether the driver was looking at the route guidance system (the leftmost IP display) or at the warning/information system (which displayed vehicle monitoring, traffic information, and IVSAWS messages, on the right). However, a beep always preceded a screen change for non-route guidance information. Since drivers were always alerted to an information display change by a beep, they had little reason to look at that display until the beep sounded. Additionally, scheduled warnings or information appeared a minimum of 7 times (for 15 seconds each) throughout the entire trip, accounting for less than 5 percent of the total trip time. (Unscheduled warnings could also be presented when applicable.) It is possible that a few glances were not to the route guidance display, but to the other information display. The impact of those few extraneous glances on the findings regarding the route guidance displays is small.
61
Two analysts reduced the glance data, and data from a third analyst were used to triplecheck that glances were coded in a consistent manner. In addition, each videotape was viewed multiple times by the analysts until the number of glances logged by each person was comparable. For example, analyst A observed 165 glances to the IP route guidance display for driver 2, while analyst B observed 169 glances. It is likely that the actual difference was more than 4 glances in this example, since there were probably a few glances in the 165 observed by analyst A that analyst B did not observe. Differences in the number of glances observed by each analyst were kept under 7, which in this example is a difference of 3.5 percent. Where larger values were observed, the data were re-examined to reduce the differences. Timelines of events over the whole test route for two typical drivers (one younger, one older), appear in the appendix. The general pattern of glances was for drivers to look at the route guidance display immediately after turns and, to some extent, just before turns. To gain additional understanding of the driver glance behavior, road segments were classified into five road types: • • • • •
Residential. Suburban. Ramps. Expressway. City/Business.
Residential streets, typical of subdivisions, were short road segments (on average, 38 seconds in duration) that usually ended with a stop sign. Small town main roads were included in the suburban road type category. They were, on average, longer than residential streets (132 seconds in duration) and included one or more traffic lights or stop signs. Ramps (mean duration = 40 seconds) included both expressway entrances and exits. Expressway segments (mean = 114 seconds), all involving limited-access roads, did not include interchanges. (There was only one on the test route.) A city/business segment was a main road that was more heavily traveled than a suburban road. It typically included 2 or more traffic lights or complex intersections and had a mean duration of 62 seconds. (An example of a complex intersection is a “Michigan left turn,” where, in this case, a right turn and a u-turn are required.) Table 22 lists the road segments and road types that were examined.
62
Table 22. Mean road segment duration for road types, by age. Mean segment duration (s) Road segment Road type Younger Older (Belleville to Canton, MI) drivers drivers Elwell Rd Residential 23.6 23.3 Huron River Dr Suburban 117.1 127.5 Huron River Dr (after traffic signal) Suburban 47.5 53.5 Madelon St to Robbe Rd Residential 35.0 35.7 Robbe Rd to Clarence Residential 31.0 41.1 Clarence to Huron River Dr Residential 57.1 59.3 Huron River Dr to Haggerty Suburban 263.3 265.3 Before I-94 east Suburban 76.2 65.2 Entrance ramp: I-94 Ramp 46.7 39.9 I-94 Expressway 70.8 57.9 I-94 to I-275 north Interchange 48.6 51.3 I-275 north Expressway 135.2 147.2 Exit ramp: I-275 Ramp 45.8 40.7 Ecorse Rd to Hannan Rd Suburban 72.7 69.1 Hannan Rd to Michigan Ave Suburban 194.6 240.3 Michigan Ave to Michigan Ave City/Business n/a n/a Michigan Ave City/Business 67.4 65.5 Entrance ramp: I-275 Ramp 29.2 43.2 I-275 north Expressway 138.7 136.9 Exit ramp: I-275 Ramp 36.6 36.1 Ford Rd to Destination City/Business 60.6 57.3 Total 1597.7 1656.3 Note: The first city/business segment (Michigan Ave to Michigan Ave, the u-turn) was not included in the analysis, because it was extremely short. To compute glance statistics, the mean trip time was calculated separately for older and younger drivers. Using the appropriate age group mean, each driver's trip time was normalized, to allow comparison. The total trip length was then divided into 21 road segments. A (road) segment was defined as the time between any of the four types of maneuvers: right turn (or bearing right), left turn (or bearing left), lane change, and expressway entrance/exit ramps. The overall mean segment time was calculated for each of the 21 road segments, and the segments were normalized for each driver according to the mean segment time. (If a driver went off route during a segment or experienced a system malfunction, that driver was not included when calculating that mean segment time.) Younger drivers looked at the route guidance display an average of 175 times during a trip, with a range of 160 to 246 glances. Older drivers looked, on average, 217 times over a trip, or 42 more times than younger drivers. It cannot be determined if this difference is attributed to the use (or lack of use) of the eye mark camera, age, or some other factor. The total number of glances for each road segment is listed in table 23.
63
Table 23. Total number of glances to the IP route guidance display for each road segment.
Road segment (Belleville to Canton, MI) Elwell Rd Huron River Dr Huron River Dr (after traffic signal) Madelon St to Robbe Rd Robbe Rd to Clarence Clarence to Huron River Dr Huron River Dr to Haggerty Before I-94 east Entrance ramp: I-94 I-94 I-94 to I-275 north I-275 north Exit ramp: I-275 Ecorse Rd to Hannan Rd Hannan Rd to Michigan Ave Michigan Ave to Michigan Ave Michigan Ave Entrance ramp: I-275 I-275 north Exit ramp: I-275 Ford Rd to Destination Total number of glances
Total number of glances for each road segment Older Younger drivers drivers (n=5) (n=3) 12 14 53 129 22 47 18 31 20 41 22 32 77 157 37 40 9 31 23 54 7 17 39 87 12 23 20 43 54 133 1 6 26 39 12 27 35 88 11 14 16 30 526 1083
Table 24 shows the frequency of glances per minute to the IP route guidance display for each road segment. The mean frequency of glances is defined as: (Total number of glances / (Number of drivers * Road segment time)) Averaged over the whole route, younger drivers’ mean frequency was 6.9 glances per minute. Older drivers had an average rate of 7.8 glances per minute, over the whole route, slightly higher than the younger drivers. Thus, drivers looked to the IP route guidance display about once every 8 seconds, and made turns roughly every minute and 45 seconds. Younger drivers looked at the display at frequencies ranging from 1.5 to 12.9 glances per minute, while older drivers’ glance frequency ranged from 4.0 to 12.1 glances per minute.
64
Table 24. Mean frequency of glances to the IP route guidance display per road segment. Mean frequency of glances (per minute) Older Younger drivers drivers (n=5) (n=3) 10.2 7.2 9.1 12.1 9.3 10.5 10.3 10.4 12.9 12.0 7.7 6.5 5.9 7.1 9.7 7.4 3.9 9.3 6.5 11.2 2.9 4.0 5.8 7.1 5.2 6.8 5.5 7.5 5.6 6.6 1.5 5.8 7.7 7.1 8.2 7.5 5.0 7.7 6.0 4.7 5.3 6.3 6.9 7.8
Road segment (Belleville to Canton, MI) Elwell Rd Huron River Dr Huron River Dr (after traffic signal) Madelon St to Robbe Rd Robbe Rd to Clarence Clarence to Huron River Dr Huron River Dr to Haggerty Before I-94 east Entrance ramp: I-94 I-94 I-94 to I-275 north I-275 north Exit ramp: I-275 Ecorse Rd to Hannan Rd Hannan Rd to Michigan Ave Michigan Ave to Michigan Ave Michigan Ave Entrance ramp: I-275 I-275 north Exit ramp: I-275 Ford Rd to Destination Mean frequency (per minute)
Using the glance data, histograms of events were developed for older and younger drivers, for each road type. Road segments were partitioned into segment fifths. Finer partitioning did not leave enough glances in each cell for between-cell comparisons of glance distributions. While splitting road segments in this manner meant that the duration of a "fifth" varied with the segment duration, this characterization facilitated comparison of the beginning, middle, and end of each road segment. The glance frequency data were examined using ANOVA. The model included three main effects: age, road type, and segment fifth. The two-way interaction was pooled with the residual to provide an error term. Neither driver age (p = 0.18) nor road type (p = 0.13) was significant, though the effect of segment fifth was significant (p = 0.14). None of the interactions was significant. Figure 38 shows the pattern for all types of roads.
65
Glance frequency (per minute)
14 12
Road Type Highway Residential City/Business Ramp Suburban
10 8 6 4 2 1
2
3 Segment (fifth)
4
5
Figure 38. Glance frequency for various road types, as a function of segment fifth.
Glance frequency (per minute)
While differences within road types were not statistically significant, examination of the individual road types is nonetheless insightful. The pattern of glances to the IP display for expressway driving, for both younger and older drivers, was constant across fifths of a segment. (See figure 39.) Note the uniform rate at which glances occur to the display. The small increase in the number of glances during the third segment fifth may have been caused by the beep (presentation of a scheduled, artificial warning) that occurred during that fifth. The peak for the third (or middle) fifth represents six additional glances per older driver. Driver Age Younger Older
10 9 8 7 6 5 4 3 2 1 0 1
2
3
4
5
Segment (fifth) Figure 39. Frequency of glances to the IP route guidance display for expressways, as a function of driver age and road segment fifth. 66
Glance frequency (per minute)
Figure 40 shows the glance behavior for residential streets in glances per minute. Younger drivers looked at the display the most during the first road segment fifth, while older drivers glanced the most within the second and third segment fifths. It is important to note that during the test session, the experimenter updated the route guidance screen after all major intersections, even those that did not require any maneuver (e.g., exit ramps, entrance ramps, and traffic signals). Driver Age Younger Older
16 14 12 10 8 6 4 2 0 1
2
3
4
5
Segment (fifth) Figure 40. Number of glances to the IP route guidance display for residential streets, by driver age and road segment fifth. For older drivers traveling on suburban roads, glance frequency differences were most pronounced in the first and last segment fifths. The elevated glance frequency in the first fifth of the trip was the driver reaction to the presentation of new warning information (just after a maneuver was completed). New warning information was also presented to the younger drivers during the first segment fifth. The greatest number of glances, for the younger drivers, occurred during the first and fourth segment fifths. Generally, drivers looked the most at the route guidance display immediately before and after a turn was made. (See figure 41.)
67
Fixation frequency (per minute)
Driver Age Younger Older
14 12 10 8 6 4 2 0 1
2
3
4
5
Segment (fifth) Figure 41. Frequency of glances to the IP route guidance display for suburban roads, by driver age and road segment fifth. Figure 42 shows the glance data for expressway entrances and exits. The glance pattern for ramps differed greatly between younger and older drivers. The total number of glances that occurred while entering (or exiting) the expressway was small. Younger drivers appeared to look at the display the most at the beginning of ramps, while older drivers looked the most at the end of the ramps. It is possible that younger drivers may have looked earlier on the ramp because they wore the eye camera. When they got close to actually merging, they could not turn their heads all the way to look over their shoulder to see the intersection. Accordingly, they may have scheduled scans of the invehicle display sooner on the ramp, so that they could look at the road when they arrived at the merge point. The difference might also be that as drivers gain experience (of which older drivers have more), their visual search patterns change. While driving on city/business streets (where turns were in quick succession), both younger and older drivers made glances to the route guidance display the most during the first fifth of the segment. (See figure 43.)
68
Glance frequency (per minute)
Driver Age Younger Older
14 12 10 8 6 4 2 0 1
2
3
4
5
Segment (fifth)
Glance frequency (per minute)
Figure 42. Frequency of glances to the in-vehicle display for ramps, by driver age and road segment fifth.
12
Driver Age Younger
10
Older
14
8 6 4 2 0 1
2
3
4
5
Segment (fifth) Figure 43. Frequency of glances to the IP navigation display on city/business road, by driver age and road segment fifth. Overall, the general pattern is a moderate number of glances to the IP display, with the pattern depending of the road type and segment duration. For short road segments, there tend to be more glances at the beginning of the segment. Overall, older drivers looked at the route guidance display about 20 percent more often than did younger drivers.
69
Eye Glances to Traffic Information, IVSAWS, and Vehicle Monitoring Displays Eye glances to the non-route guidance systems (shown on the second IP display, to the right of the IP route guidance display) were analyzed by viewing the videotapes made during on-road testing. The video scene showed, for the older subjects, a split screen of the driver’s face and the forward camera and, for the younger subjects, the video output of the eye mark camera. The video segments from when the screens appeared (accompanied by a pair of beeps) to the screen disappearing were analyzed manually by counting video frames. The IVSAWS and traffic information screens were presented for only 20 seconds (vehicle monitoring was the default screen). Most subjects gave the screen the highest priority until they had viewed it completely. Some subjects looked back at the screen several seconds later to see if it had changed again. When the eye glance data were manually collected, single glances to the display were not counted, if they occurred after a 6 second or longer period of glances to the road. The subject base for this analysis was the 24 subjects used for the navigation driving data (2 subjects per age-sex-system cell). Only subjects who had good glance sequences to all 6 of the scheduled displays (3 IVSAWS, 2 vehicle monitoring, and 1 traffic information), were used in the final analysis of those screens. Any subjects with an incomplete set (due to glare, distraction, or software failure) were replaced with another subject from the same age-sex-system combination. Any subject who viewed an unscheduled IVSAWS screen was used in the analysis of those screens. Table 25 shows the screens analyzed, their associated systems, and the number of glances to each. There were a total of 187 screen presentations analyzed, including 115 IVSAWS presentations, 48 vehicle monitoring presentations, and 24 traffic information presentations.
70
Table 25. Eye glances to other (non-route guidance) displays. System
IVSAWS
Mean Number of number of screen glances presentations analyzed School bus 24 2.5 Accident ahead 24 2.2 New traffic signal 24 2.0 Construction* 28 1.8 Police* 6 1.3 Mail truck* 7 1.9 Ambulance* 1 2.0 School bus* ** 1 3.0 Oil change 24 2.4 Oil change & lamp out 24 2.8 Accident on I-275 24 4.5
Mean number of Screen description glances To all IVSAWS screens: 2.1
Vehicle To all VM monitoring screens: 2.6 4.5 Traffic informatio n *Unscheduled warnings of actual road hazards **There was one instance where a school bus actually appeared. An on-the-fly warning, but not a directional cue, was presented. The other "school bus" presentations were for scheduled, artificial warnings.
An ANOVA did not show significant differences due to age (p = 0.17) or sex (p = 0.85), but there were significant differences due to the system (IVSAWS, vehicle monitoring, or traffic information), where p = 0.0001. There were also differences due to route guidance condition, with the number of glances being fewer for the IP group (mean = 2.1) than the HUD (mean = 2.6) or the auditory group (mean = 2.8). This may be because drivers in the IP group had more experience in looking to a nearby display location (the adjacent route guidance display). None of the interactions of any of these factors were significant. Figure 44 shows the number of glances to non-route guidance displays in each glance sequence. The distribution of the number of glances in a sequence appears be a decaying exponential. Also examined was the mean duration of all eye glances to non-route guidance displays (for all drivers and road segments). Glance durations varied from 358 to 2500 milliseconds, with a mean of 408 msec. Figure 45 shows the log-normal distribution.
71
Number of occurrences
120 100 80 60 40 20 0 0
2
4
6 8 10 Number of glances
12
14
Figure 44. Number of glances to non-route guidance displays.
Number of occurrences
60 50 40 30 20 10 0 0
500
1000 1500 2000 2500 Mean glance duration (msec)
3000
Figure 45. Mean glance duration to non-route guidance displays. In an ANOVA, all of the factors of interest -- age (p = 0.004), sex (p = 0.03), and system (p = 0.0001) -- were statistically significant, but none of the interactions were significant. Figure 46 shows the differences in mean glance duration due to system and driver age.
72
Mean glance duration (msec)
1400 1300 1200 1100 1000 Driver age Younger Older
900 800 700 IVSAWS
Vehicle Monitoring
Traffic Information
System Figure 46. Effects of system and driver age on mean glance duration to non-route guidance displays. Table 26 presents the mean glance durations for each of the screens for the three nonroute guidance systems. There were large differences in glance times both within and between systems. Finally, the accumulated product of glances and their duration, or the total glance time, was examined. Figure 47 shows the distribution, which was log-normal. Mean total glance times ranged from 450 to 9067 msec with a mean of 2436 msec. Total glance times were always significantly affected by driver age (p = 0.0001) and the system they were examining (p = 0.0001), but not by their route guidance condition (p = 0.49). Sex was marginally significant (p = 0.04). Figure 48 shows the effects of age and system.
73
Table 26. Mean glance duration for each screen of the non-route guidance systems. System
Mean glance duration (msec)
IVSAWS
To all IVSAWS screens: 886
Screen description
Number of screen presentations analyzed School bus 24 Accident ahead 24 New traffic signal 24 Construction* 28 Police* 6 Mail truck* 7 Ambulance* 1 School bus* 1 Oil change 24 Oil change & lamp out 24 Accident on I-275 24
Vehicle To all VM monitoring screens: 1222 1243 Traffic informatio n *Unscheduled warnings of actual road hazards
Mean glance duration (msec) 975 814 1035 785 843 825 400 961 1042 1403 1243
60
Number of occurrences
50 40 30 20 10 0 0
2000
4000 6000 8000 Total glance time (msec)
10000
Figure 47. Distribution of total glance times for all drivers to non-route guidance displays.
74
5500
Total glance time (msec)
5000 4500 4000 3500 3000 2500
Driver age Younger Older
2000 1500 1000 IVSAWS
Vehicle Monitoring
Traffic Information
System Figure 48. Effects of system and driver age on total glance time to non-route guidance displays. Table 27 shows the total glance times for each of the displays examined. Notice that the time for the traffic information display is considerably larger than the others.
75
Table 27. Total glance times to non-route guidance screens. System
Mean total glance time (msec)
IVSAWS
To all IVSAWS screens: 1816
Screen description
School bus Accident ahead New traffic signal Construction* Police* Mail truck* Ambulance* School bus* Oil change Oil change & lamp out Accident on I-275
Vehicle To all VM monitoring screens: 2983 4579 Traffic informatio n *Unscheduled warnings of actual road hazards
Number of screen presentations analyzed 24 24 24 28 6 7 1 1 24 24 24
Mean total glance time (msec) 2391 1725 2106 1351 1170 1569 800 2883 2514 3451 4579
Analysis of Post-Experiment Questionnaires The following section includes the summary results of the post-experiment questionnaires concerning the safety, utility, and usability of various driving tasks. The driving task questions concerned both driving with and without the in-vehicle information systems. It should be noted that the question sample size differs among questions. This difference was due to problems that occurred during the test session. Some participants did not experience a working version of certain systems and, therefore, could not answer all questions on the questionnaire. For example, if the traffic information system malfunctioned during a test session, that participant did not respond to questions relating to that system. The analysis of questions was done over all participants, and was also broken down into the three route guidance conditions: auditory route guidance users (“AUD RG users”), IP route guidance users (“IP RG users”), and HUD route guidance users (“HUD RG users”). It should be noted, however, that all subjects used the same version of the IVSAWS, traffic information, and hazard warning systems, which were shown on the second IP display. This categorization of participants was done to show system differences for the various safety and usability issues. The mode of the route guidance system was the only difference among these three “RG user” groups.
76
Task Difficulty Questions While the first group of questions (task difficulty for common driving tasks) was not associated with different user groups, these responses were also divided by route guidance user group. This was done as a control condition to check if the groups had similar set points along the scale. After the on-the-road test session, participants were asked to rate the difficulty of the nine tasks, using all of their driving experience. The mean difficulty ratings of various driving tasks are shown in table 28. Overall, the tasks that were rated least difficult were those that involve operating a simple control in the car (e.g., adjusting a dial) or talking. The mean difficulty rating for these easier tasks ranged from 1.5 to 1.8 on a 10-point scale, with 1 meaning “not difficult” and 10 meaning “extremely difficult.” The more difficult tasks, ranging in difficulty from 3.3 to 5.3, involve more complex behavior related to handling an object in the car (e.g., a beverage), or reading detailed information (e.g., addresses or maps). Table 28. Mean difficulty ratings for performing common tasks while driving.
Common driving task. Not difficult 1---------->10 Extremely difficult 1. Turning on & off the car radio. 2. Adjusting the fan speed on the car heater or air conditioner. 3. Changing stations on the car radio using presets. 4. Reading the speed on the speedometer. 5. Talking with other people in the car. 6. Drinking a beverage. 7. Changing a tape cassette in a car stereo. (Aud n=12) 8. Looking at street numbers to locate an address. 9. Reading a map. Mean by RG user group (AUD n=13 , IP n=14 , HUD n=16)
Mean rating HUD Overall IP AUD mean RG RG RG user user user s s s 1.2 1.8 1.5 1.5 1.3 2.0 1.6 1.6 1.5 1.6 1.2 2.9 2.8
1.8 1.7 2.1 3.9 4.1
1.8 1.6 1.9 3.3 3.8
1.7 1.7 1.8 3.3 3.6
4.4 4.8 2.4
4.9 5.9 3.1
4.0 5.3 2.8
4.4 5.3 2.7
The mean ratings for the common driving tasks are similar to those obtained by Kames, where people rated the difficulty of 14 tasks on a 1 to 10 scale (10 being the most difficult).[27] Selected questions and ratings from that study are shown in table 29. In both studies, reading a map was rated as the most difficult of all tasks. Ratings in the Kames experiment were somewhat higher (that is, task were rated as more difficult) than those reported here. It is unclear if those differences are due to improved vehicle design, a wider range of complex tasks drivers undertake while driving, or betweenexperiment error.
77
Table 29. Selected mean difficulty ratings for common driving tasks from Kames. Common driving task. 1----------->10 Most difficult Conversing with other people in the vehicle. Adjusting a car heater or air conditioner. Tuning a car radio. Drinking coffee or other beverage. Reading a map.
Mean rating 1.3 2.2 2.8 3.5 7.9
To determine if there were differences among the three RG user groups, an ANOVA was run on the nine common driving task questions listed in table 28. System is statistically significant where p = 0.433. Figure 49 presents a graph of the mean ratings to each question, for each of the three RG user groups. A pair-wise comparison (using Scheffe’s S test) showed significant difference between the auditory and IP route guidance user groups (p = 0.0045). 6.0 5.5
Task Difficulty
5.0
Auditory IP HUD
4.5 4.0 3.5 3.0 2.5 2.0 1.5 1.0 1
2
3
4
5 6 Question
7
8
9
Figure 49. Mean difficulty ratings for nine common driving tasks for RG system user groups. Similar tasks, related to the route guidance system, were also rated for their difficulty. Their mean difficulty ratings are shown in tables 30 and 31, as rated by the route guidance system each driver used. The mean ratings for these tasks were favorable, with all averages less than 2.0, which is less than the more difficult common tasks (from
78
table 28). Receiving the information (either by reading or listening) was the least difficult task overall. Of the three presentation modes, this was easiest for auditory users, who gave a mean difficulty rating of 1.2, whereas visual users (IP and HUD) each rated it 1.9 and 2.1, respectively. Auditory users consistently rated the various tasks at least as easy, if not easier, than their visual system user counterparts. It is difficult to determine if this was due to system differences (that the auditory system was easier to use), individual differences (the lower scale set-point of the auditory users), or different sample sizes. Table 30. Mean difficulty ratings for tasks, using the route guidance system while driving.
Route guidance (RG) task difficulty statement Not difficult 1---------->10 Extremely difficult Listening to, or reading, the information on the RG system. Determining the next maneuver from the RG system. Looking for the next turn indicated by the RG system. Mean by RG user group (Aud n=12, IP n=10, HUD n=11)
Mean rating HUD Overall IP AUD mean RG RG RG user user user s s s 1.2 1.9 2.1 1.7 2.2 1.4 1.6
1.5 2.1 1.8
2.2 2.7 2.3
2.0 2.1 1.9
Table 31. Additional mean difficulty ratings for tasks, using the route guidance system while driving.
Route guidance (RG) task difficulty statement Not difficult 1---------->10 Extremely difficult Remembering the next maneuver after hearing it. Looking at the RG screen to see it update. (Aud n=12, IP n=10, HUD n=11)
Mean rating HUD Overall IP AUD mean RG RG RG user user user s s s 2.0 n/a n/a n/a n/a 1.8 1.9 1.9
The three information elements provided by the route guidance system that all users strongly agreed were useful were: the distance to the next maneuver, the landmarks, and information about distant intersections. (See table 32.) The auditory users unanimously responded that they strongly agreed the landmarks were useful (mean = 1.0). Perhaps this was because they received less information overall, and therefore had to rely more heavily on each piece of information. That is, they did not receive intersection geometry information, as did the visual users, therefore making the landmarks more important to the auditory users.
79
Table 32. Mean ratings of usefulness of route guidance system features common to all route guidance groups. Mean rating HUD Overall IP Route guidance evaluation AUD mean RG RG Strongly agree 1 ---------->5 Strongly disagree RG user user user s s s The landmarks (traffic lights, bridges, etc.) were useful. 1.0 1.2 1.3 1.2 The distance to the next maneuver information was useful. The information about upcoming (distant) intersections was useful. Mean by RG user group
1.1
1.0
1.4
1.2
1.2
1.0
1.5
1.2
1.1
1.1
1.4
1.2
The other four information elements--block address, town, timer countdown bars, and compass--were less useful, on the whole, to the visual users, as shown in table 33. This may be because these information elements were not critical information elements for the experimental task of reaching the destination. The address, town, and compass tell drivers where they are, but not where to go, and are not necessary for this route guidance task. The timer countdown bars were redundant information about the upcoming intersection (which the drivers apparently would rather do without), as they favored the distance (tenths of miles) information over timing (20-second intervals). Table 33. Mean ratings of route guidance system features applicable to visual system (IP and HUD) groups.
Route guidance evaluation Strongly agree 1 ---------->5 Strongly disagree The current block address information was useful. The current town information was useful. The timer countdown bars are useful. The compass was useful. Mean by RG user group (Aud n=12, IP n=10, HUD n=11)
Mean rating HUD Overall IP AUD mean RG RG RG user user user s s s n/a 1.9 2.2 2.1 n/a 2.2 2.3 2.3 n/a 2.6 2.8 2.7 n/a 2.6 2.9 2.8 n/a 2.3 2.6 2.5
For the traffic information system, the most difficult task was reading the traffic report screen. (See table 34.) This task received the highest overall mean difficulty rating
80
(3.0) of all tasks related to the four in-vehicle systems (route guidance, traffic information, IVSAWS, and vehicle monitoring). Table 34. Mean difficulty ratings for using the traffic information system while driving.
Traffic information (TI) task difficulty statement Not difficult 1---------->10 Extremely difficult Hearing the TI report alert tone. Reading, or listening to, the TI report. Mean by RG user group (AUD n=13, IP n=14, HUD n=16)
Mean rating HUD Overall IP AUD mean RG RG RG user user user s s s 1.3 1.8 1.2 1.4 2.9 2.7 3.4 3.0 2.1 2.3 2.3 2.2
For the hazard warning system, the easiest task (an overall rating of 2.3) was “identifying the hazard” depicted on the hazard warning system. All drivers used the same (IP-based) hazard warning system. For the task difficulty means, see table 35. Tasks associated with “looking...for the hazard” were rated more difficult overall (with means of 2.5 and 2.8). This difficulty could be due, in part, to some of the hazard warnings being artificial (that is, an actual hazard was nonexistent). In addition, on-thefly (actual) hazards that appeared during the test route did not have an associated location cue on the hazard warning screen (and presentation of these were not consistent across subjects). That is, only the hazard warning message or icon was shown. In all cases of on-the-fly hazards, however, the hazard was always ahead of the driver on the same road. (Although subjects had been told that this system both identified and located the hazard, no one mentioned that a location cue was not given for those real hazards.) Again, auditory users gave the lowest ratings of the three groups of RG users for these warnings. It is unclear if their lower ratings are due to individual differences, or if the (visual) hazard warning system was easier to use in the context of, or compared to, the auditory route guidance system. It is also possible that providing auditory route guidance left some spare capacity for other visual information. If this difference is simply a matter of scale use (bias), then the size of the bias is roughly equal to the difference between ease-of-use ratings of the three route guidance interfaces. (See table 29, above.) Accordingly, ratings of use for the three route guidance interfaces are virtually identical.
81
Table 35. Mean difficulty ratings of tasks involving the hazard warning system. Mean rating HUD Overall IP Hazard warning (HW) task difficulty statement AUD mean RG RG Not difficult 1---------->10 Extremely difficult RG user user user s s s Identifying the hazard from the HW system. 1.6 2.3 2.9 2.3 Looking out the window for the hazard identified by the 2.0 2.9 3.4 2.5 system. Understanding the location of hazard. 2.0 2.7 2.8 2.8 Mean by RG user group 1.9 2.6 3.0 2.5 (Aud n=12, IP n=10, HUD n=11) Similar to the hazard warning system, the easiest task associated with the vehicle monitoring system was “identifying the problem” (mean difficulty = 1.7). (See table 36.) Almost equally easy was “determining the location of the problem” on the car (e.g., identifying which turn signal lamp needed to be replaced). It was only slightly more difficult for drivers to “determine the severity of the problem” (1.9) and the “action to take” based on the problem (2.2). This could be due to experimental conditions, rather than the task difficulty. Glare from the sun presented problems in reading the displays for some drivers. Some drivers were also unsure how to respond to the warning messages during the test session (e.g., acknowledge yet ignore them, or actually try to resolve them). Drivers might respond differently to these warnings under real-world driving conditions. Table 36. Mean difficulty ratings for using the vehicle monitoring system while driving. Mean rating HUD Overall IP Vehicle monitoring (VM) task difficulty statement AUD mean RG RG Not difficult 1---------->10 Extremely difficult RG user user user s s s Identifying the problem from the VM system. 1.5 1.7 1.9 1.7 Determining where the problem is on the car. 1.8 1.7 1.9 1.8 Determining the severity of the problem. 1.7 1.8 2.2 1.9 Determining what action to take based on the identified 1.5 2.9 2.1 2.2 problem. Mean by RG user group 1.6 2.0 2.1 1.9 (Aud n=12, IP n=10, HUD n=11) An ANOVA for main effects of system, question, sex, and age was done across all subjects for the difficulty ratings of the 13 task difficulty questions comparing all 4 invehicle systems. The 13 questions are shown in tables 30, 31, 34, 35, and 36 above. Responses to “looking at the RG screen to see it update,” and “remembering the next 82
maneuver after hearing it” were combined as one question, as they were comparable as tasks where drivers needed to confirm information. Three main effects were statistically significant at p < 0.05. These effects were for System (p = 0.0047), Question (p = 0.0001), and Age (p = 0.0001). In addition, Scheffe’s S test was done for pairwise differences for system and for age. (No pairwise comparisons were done for Question, as the questions varied and it was assumed that responses would differ over the 13 questions.) For system, there were statistically significant differences between the Auditory and IP users’ difficulty ratings (p = 0.0111), and between the HUD and Auditory users’ ratings (p = 0.0001). It is unclear whether these differences are due to individual or system differences. Individual questions were analyzed for main effects separately for system, sex, and age. Where significant, further analysis was done with Scheffe’s S test to determine if there were any pairwise differences. Table 37 summarizes the questions that were statistically significant. Table 37. Summary of main effects and significant pairwise differences for task difficulty questions for four in-vehicle systems. Question Reading the traffic information screen. Reading [or listening] to the route guidance information. Looking for the hazard (on the road) identified by IVSAWS.
83
Factor
p-value
Age
0.0023
Pairwise difference Older vs. younger
System
0.0409
Auditory vs. HUD
Age
0.0129
Older vs. younger
Safety and Usability Questions Overall, responses were favorable to safety issues concerning the use of the in-vehicle systems, as shown in table 38. Overall, the auditory system users were slightly more confident about the safe use of the system than the visual RG users. For three of the four statements pertaining to all users, the auditory system users responded more favorably than the HUD and IP users. Overall, drivers strongly agreed (mean = 1.2) that it was easy to figure out the system (all 4 systems as a whole) and was safe for them to use it while driving (mean = 1.4). The auditory users responded most favorably, strongly agreeing that it was safe for them to use while driving (mean = 1.0). On the other hand, there was slightly more variability among users in terms of how safe it was for a passenger to use the system while they themselves drove. In this case, the IP users felt most positively that it would be safe for another person to use it while another drove (mean = 1.1). Similarly, HUD users on average somewhat agreed (mean = 1.6) that it was easy to use the HUD system. All drivers were least favorable to the idea of an inexperienced driver using their respective systems while driving. Again, the auditory users responded the most favorably (mean = 2.3), while the IP and HUD users averaged a neutral response (means = 3.0 and 3.3, respectively). Table 38. Mean level of agreement to safety and usability issues for using the 4 in-vehicle information systems.
Safety/learning statement Strongly agree 1 ---------->5 Strongly disagree It was easy for me to figure out how the system worked. It is safe for me to use this system while driving. It is safe for a passenger to use this system while I drive. It is easy for me to use the HUD/mirror while driving. It is safe for inexperienced drivers to use this system while driving. Mean by RG user group (Aud n=12, IP n=10, HUD n=11)
Mean rating HUD Overall IP AUD mean RG RG RG user user user s s s 1.1 1.2 1.3 1.2 1.0
1.7
1.5
1.4
1.6
1.1
1.8
1.5
n/a
n/a
1.6
1.6
2.3
3.0
3.3
2.9
1.5
1.8
1.9
1.7
On the whole, for issues regarding the utility of the various systems, auditory and HUD users responded more favorably than IP users, as shown in table 39. Overall, all drivers strongly agreed (mean = 1.1) that the route guidance information was useful. This was also true within the three user groups. Secondly, there was strong agreement for all users about using the system to drive in unfamiliar areas (mean = 1.2). Also, all route guidance user groups indicated that they preferred their respective route guidance
84
system over the conventional route guidance alternatives. All users preferred using their respective route guidance system over written instructions (mean = 1.2), as well as favored their route guidance system over a standard paper map (mean = 1.4). On the whole, the hazard warning, vehicle monitoring, and traffic information systems were rated almost equally useful. On average, auditory users strongly agreed that the information provided by each of the other three systems was useful. HUD users agreed less with the usefulness of the three systems, but still were quite favorable, while the IP users were least favorable to the usefulness of the these systems. Relating to the use of the systems, auditory and HUD users were more favorable toward using the system on a daily basis (means = 1.4 and 1.9, respectively), or when in a hurry (means = 1.5 and 1.8, respectively). IP users indicated they were less inclined to use the system as frequently as the other users (mean = 2.6). Table 39. Mean level of agreement to utility issues for using the 4 invehicle information systems.
Utility statement Strongly agree 1 ---------->5 Strongly disagree The route guidance information provided by this system is useful. (AUD n=11, IP n=10, HUD n=11) I would likely use this system when driving in unfamiliar areas. (IP n=10, HUD n=11) I would rather use a route guidance system similar to this than use written instructions to find my way. The hazard warning information is useful. (Aud n=13) I would rather use an RG system similar to this one than a standard paper route map to find my way. The traffic information provided by this system is useful. The vehicle monitoring information is useful. (Aud n=13) I would use this system if I were in a hurry. (IP n=10, HUD n=11) I would likely use this system for my daily travel. (IP n=10, HUD n=11) Mean by RG user group (Aud n=12, IP n=14, HUD n=16)
Mean rating HUD Overall IP AUD mean RG RG RG user user user s s s 1.0 1.2 1.1 1.1 1.1
1.4
1.2
1.2
1.2
1.2
1.3
1.2
1.2
1.6
1.4
1.4
1.2
1.4
1.5
1.4
1.2
1.8
1.6
1.5
1.2
1.6
1.6
1.5
1.5
2.6
1.8
1.9
1.4
2.6
1.9
1.9
1.2
1.7
1.5
1.5
All post-study usability and utility questions (expect for question 5, concerning the use of the HUD) were analyzed by ANOVA for main effects of system, question, sex, and age. (The HUD question was excluded because it did not apply to all participants.) There
85
were significant statistical differences for system (p = 0.0001), question (p = 0.0001), and age (p = 0.0001). Additionally, pairwise comparisons were done for the three significant factors (system, age, and question). By Scheffe’s S test, auditory and IP users, and auditory and HUD users were statistically different, both at p = 0.0001. In addition, auditory users more strongly agreed (were more favorable) to the usability and utility statements. Pairwise differences were also found for age, where p = 0.0001. These analyses also indicated that older subjects were more favorable (e.g., they more strongly agreed) to the usability and utility questions than the younger subjects. Rankings of the 4 Systems As shown in table 40, the route guidance systems received the best overall mean rank for usefulness (mean = 1.2). In particular, all user groups (IP, HUD, and auditory) gave their route guidance system the best ranking of all the systems. The traffic information, hazard warning, and vehicle monitoring systems received overall mean rankings of 2.7, 2.8, and 3.3, respectively. Table 40. Mean rankings of usefulness of the four in-vehicle information systems. Mean rank HUD IP System Aud RG RG Best 1 -----> 4 worst RG users users users Route guidance 1.7 1.0 1.0 Traffic information 2.8 2.5 2.6 Hazard warning 2.3 3.3 2.8 Vehicle monitoring 3.2 3.2 3.5 (Aud n=12, IP n=10, HUD n=11)
Overall mean 1.2 2.7 2.8 3.3
In terms of usability, the route guidance system received the highest overall mean rank of 1.7, as shown in table 41, as well as the best rank within each of the three route guidance user groups. Across user groups, the systems were consistently ranked from best to worst for usability in the following order: route guidance, vehicle monitoring, hazard warning, and traffic information.
86
Table 41. Mean rankings of ease of use of four advanced in-vehicle information systems. Mean rating HUD IP System Aud RG RG Best 1 -----> 4 worst RG users users users route guidance 1.4 1.7 2.0 Vehicle monitoring 2.5 2.4 2.5 Hazard warning 2.9 2.7 2.6 Traffic information 3.2 3.2 2.8 (Aud n=12, IP n=10, HUD n=11)
Overall mean 1.7 2.5 2.8 3.1
Willingness to Pay Participants in both the subjects-in-tandem and individual driver experiments were asked how much they would be willing to pay for the systems they used (including route guidance, traffic information, vehicle monitoring, and IVSAWS). Mean responses are summarized in table 42. Table 42. Mean amount participants are willing to pay for systems used. Experiment Subjects-inTandem* Single Driver**
Mean willingness to pay ($) Aud RG users IP RG users HUD RG users 617
1200
1800
937
1127
723
*Aud n=3, IP n= 4, HUD n=4 **Aud n=12, IP n=13, HUD n=15 Times to Operate Common Controls and Read Displays Times to complete various controls and displays tasks were recorded for all drivers while driving on two roads. The 7 tasks were requested first on a 4-lane divided expressway, with a 55 mi/h speed limit, before reaching the test route. The second time, the tasks were requested while driving on a suburban 2-lane road with a 50 mi/h speed limit. Drivers were asked to complete various common tasks, such as operate the radio, use the climate control, or read the speedometer. Table 43 presents the times to complete the control and display tasks, for both road types.
87
Table 43. Mean time to complete controls and display tasks while driving. Control or display task
Task prompt
Overall 2nd 1st mean request request (at 55 mi/h) (at 50 mi/h)
Reading the radio station frequency.
“Station frequency”
2.1
1.9
2.0
Turning off the car radio.
“Radio on”
2.1
2.0
2.1
“Vehicle speed” “Fan slower”
2.3*
2.0
2.2
2.2
2.6
2.4
Adjusting the fan speed to faster.
“Fan faster”
3.1*
2.4
2.8
Changing the radio station using the preset buttons. Turning on the car radio.
“Change station”
4.3
3.7
4.0
“Radio on”
5.8
4.3
5.1
Reading the speed of the vehicle. Adjusting the fan speed to slower.
(n=42) * (n=40) These data provide context as to what is considered acceptable in contemporary vehicles. Times were in the 2 to 6 second range, with changing the radio using the presets, a very common task, being 4 seconds on average. Reading displays (the speedometer and radio) took less time, in general, than operating the climate control and radio. These times are presented as normative data for operation of common controls and displays while driving on two types of roads. They provide an approximate range of times to perform such tasks, although the method of data collection was not rigorous. For example, before beginning the on-road part of this experiment, subjects were given the opportunity to familiarize themselves with the controls and displays in the test vehicle. Some chose to practice using them, while others did not. Despite some practice, significant learning over a time period longer than this brief experiment is likely. In all cases, except for adjusting the fan to a slower speed, the second requests were completed in a shorter time.
88
CONCLUSIONS The purpose of this experiment was to answer five questions. They were: •
How and where should route guidance information be presented?
•
Can drivers successfully navigate using the route guidance interfaces outlined in this project?
•
How long does it take drivers to read the traffic information, IVSAWS, and vehicle monitoring messages?
•
In general, which of the human performance measures (e.g., mean glance duration, number of glances, total glance time, lane variance, speed variance) is most sensitive to variations in interface design?
•
In terms of ease of use, which functions and features do drivers consider to be safe and acceptable?
How and where should route guidance information be presented? Three alternative route guidance interfaces were examined in this report. Two were visual and presented identical information, though in different locations (HUD and IP). One was auditory, and provided less information than the visual interface. Considerable thought was given to the design of these interfaces and it is believed they were reasonably well designed. In terms of route guidance performance, differences among the interfaces were small. In the individual driver experiment there were 5 execution errors when the auditory interface was used, 4 with the IP, and 1 with the HUD. In terms of near miss errors, the values were 6 with the auditory system, 4 with the IP, and 5 with the HUD. Auditory, IP, and HUD users made totals of 11, 8, and 6 errors, respectively. This suggests that the visual route guidance systems for this test route were slightly easier to use than the auditory system. The driving performance data showed very few differences among interface designs. The standard deviation of steering wheel angle was largest for the IP implementation (1.1 degrees), slightly less for the HUD implementation (1.0 degrees), and least for the auditory interface (0.9 degrees). This slight difference was statistically significant. In terms of throttle, there were marginal differences, with the mean value being larger for the auditory implementation. However, there were no significant differences in the standard deviation of lateral position or the standard deviation of speed. When drivers are paying close attention to their driving, they make a large number of small corrections and, as a consequence, the standard deviation of the steering wheel angle should be small. The data reported here suggested that the auditory interface required the least attention, the HUD interface slightly more, and the IP interface the most. Again, it is emphasized that these differences are slight.
89
In terms of the difficulty ratings for common route guidance tasks (determining next maneuver, etc.) the auditory implementation was rated as least difficult (1.6) followed by the IP (1.8) and HUD (2.3) implementations. If it is assumed that providing an IP-based route guidance system does not interfere with driver use of other visually-based information systems in some way (for example, by providing a visual overload), then the ratings for those systems should be equal. For the traffic information, IVSAWS, and vehicle monitoring systems, the difference in difficulty ratings among the three groups was 0.2, 1.1, and 1.4, respectively, on a 10-point scale. These relatively small values suggest that the differences between systems are unimportant. Responses to the safety and usability questions (e.g., "It is safe for me to use this system while driving") indicated a similar pattern. Means were 1.5 for the auditory implementation, 1.8 for the IP implementation, and 1.9 for the HUD implementation. Thus, the rating data suggest a slight, but potentially unimportant advantage for the auditory implementation, assuming peoples’ perception of safety are valid. As a group, these data suggest that there were no substantial differences among the three implementations tested. Drivers made a few more navigation errors with the auditory implementation, there were no performance differences, and there were minor advantages to it in terms of safety and ease of use ratings, compared with the other modes. Those rating differences may reflect differences among the three test groups, not the interfaces. Therefore, none of the three implementations is recommended over the others. Some consideration should be given to combining the designs (e.g., visual guidance with an auditory supplement). The authors view this lack of a difference as a positive outcome. Three types of interfaces were designed, prototyped, and tested in several experiments. In the experiment described in this report, those interfaces were used to drive to an unfamiliar destination by drivers with minimal exposure to these systems. They made few navigation errors, using those systems had minor effects on driving performance when compared with their baseline driving, and ratings of safety and ease of use were similar. While it could be these measures are insensitive, it seems unlikely that all of them are. Thus, the authors believe the interfaces were all reasonably well designed. Can drivers successfully navigate using the route guidance interfaces outlined in this project? Drivers had few difficulties in navigating with any of the three implementations of the route guidance system in the two experiments reported. In the subjects-in-tandem experiment there were three execution errors committed by the six pairs of drivers. In the individual driver experiment, the 30 subjects (for which there was complete data) made 10 turn errors. Given there were 19 turns on the route, these values correspond to error rates of 2.0 and 1.8 percent. These rates are far below the rates computed for other interfaces, based on the literature.[19]
90
How long does it take drivers to read the traffic information, IVSAWS, and vehicle monitoring messages? On average there were 2.1 glances per driver for each IVSAWS screen, 2.6 for each vehicle monitoring screen, and 4.5 for each traffic information screen. Glance durations were approximately 890, 1220, and 1240 ms, respectively, for total glance durations of 1820 (IVSAWS), 2980 (vehicle monitoring) and 4580 ms (traffic information). The time to look at the traffic information system was quite long and this display contained far more information than the other displays. (It was also noted, from drivers’ comments, that the traffic information screen was very dense. And, when questioned, some drivers could not recall information from that screen). Simplification of the traffic information interface is necessary. In terms of ease of use, which functions and features do drivers consider to be safe and acceptable? On a 1 (not difficult) to 10 (extremely difficult) scale, drivers rated all of the tasks associated with the route guidance system (e.g., listening to route guidance information) between 1.5 and 2.0, on average. For the other systems, various tasks (e.g., identifying the hazard shown by IVSAWS, identifying vehicle monitor problems, etc.) were between 2.0 and 3.0, except for reading the traffic information screens, which was rated 3.0 on average. To put these ratings in perspective, conversing with other people was rated 1.3, adjusting climate controls (a task performed in the experiment) was rated 2.2, tuning the radio was 2.8, drinking a beverage was rated 3.5, and reading a map was rated 7.9. Treating all four information systems as a group, drivers strongly agreed these systems were safe and easy to use for themselves. On a 1 to 5 scale (1 = strongly agree, 5 = strongly disagree), they strongly agreed it was "easy for me to figure out how the system worked" (1.2), "safe for me to use while driving" (1.4), and "safe for a passenger to use" (1.5). For "safe for inexperienced drivers to use," the mean was 2.9, indicating neutrality. This suggests that some drivers may think training is needed for new drivers. However, some of the subjects in this experiment were as young as 18 (meaning they were relatively inexperienced drivers), yet they required only minimal training. In terms of drivers’ preferences, the features in common to all three route guidance systems--landmarks, and distances to upcoming intersections--received favorable ratings for usefulness (means = 1.2). Four information elements, specific to the visual route guidance systems only, received lower ratings, ranging from 2.1 to 2.8 for their usefulness. Three of these visual-only elements provided information on current location (address, town, and heading). It should be noted, however, that while this information was not essential for the specific task these drivers were asked to do in this experiment (reach the destination), it may be useful in other scenarios. The other information element, timer countdown bars that providing approximate time to arrival at upcoming intersections, was redundant with the mileage-to-upcoming-intersections counter. Drivers in the visual conditions preferred the distance-based over the timebased information.
91
Which of the human performance measures is most sensitive to changes in interface format? There were few driver performance measures differentiating among the alternative driver interfaces. It could be the usability differences between interfaces were small, though it is also possible that the performance measures examined were insensitive to differences in interface usability. The standard deviation of steering wheel angle was the most sensitive measure, because its value varied with interface format. Eye glance measures could not be obtained for the HUD implementation (because the display location was so close to the normal line of sight), and eye glances were not examined for the auditory interface. Further insights into the utility of various performance measures will result from comparison of this experiment with subsequent research.[17] Stepping back from the specific issues this experiment examined, the authors were extremely pleased with the ease of use of the route guidance system driver interfaces. 'the usability of the final design was a consequence of the development approach chosen, the use of rapid prototypes and small scale experiments to identify design problems and correct them. Interface prototypes were developed in a short period of time, and from the driver's perspective, looked and behaved as if they were real products. Much of the interface testing in this project would not have been possible had the prototypes not been available. To develop safe and easy to use products, it is necessary to test user interfaces early in the design cycle and modify them based on user feedback and performance. The research conducted here and in other phases of this project demonstrates that advanced driver interfaces can be tested quickly and thoroughly with rapid prototyping methods. The value of prototyping was actually one of the greatest and most beneficial lessons of this project.
92
APPENDIX A - BIOGRAPHICAL FORM (BOTH EXPERIMENTS) University of Michigan Transportation Research Institute Subject: Human Factors Division Biographical Form Name: Male
Date:
Female (circle one)
Age:
Occupation: Education (circle highest level completed): some high school some trade/tech school some college some graduate school
high school degree trade/tech school degree college degree graduate school degree
Retired or student: Note your former occupation or major What kind of car do you drive the most? Year:
Make:
Model:
Annual mileage: Have you ever driven a vehicle with an in-vehicle traffic information or navigation system? No
Yes, in an experiment
Yes, elsewhere
Have you ever driven a car with a Head-Up Display (HUD)? No Yes ---------> If yes, does your car have a HUD? Yes
No
In the last 6 months, how many times have you used a map? 0
1-2
3-4
5-6
7-8
9 or more
In the last 2 weeks, how often did you rely on traffic information reports to get to a destination quickly and efficiently? 0
1-2
3-4
5-6 times
7 or more
How often do you use a computer? Daily
A few times a week
A few times a month
Once in awhile
Never Vision correctors? 14 R Yes/ No
TITMUS VISION: (Landolt Rings)
1 2 3 4 5 6 7 8 9 10 11 12 13 T R R L T B L R L B R B T 20/200 20/100 20/70 20/50 20/40 20/35 20/30 20/25 20/22 20/20 20/18 20/17 20/15 20/13
93
type
APPENDIX B - SUBJECTS-IN-TANDEM EXPERIMENT CONSENT FORM Subject ______ Date ________ ADVANCED DRIVER INFORMATION PARTICIPANT CONSENT FORM
The purpose of this experiment is to determine if new advanced driver information systems are easy to use. In this experiment you will drive from here to Belleville. One person will be the driver, and the other will be the passenger. In Belleville you will use an in-car information system that we are testing. It will tell you how to get to Canton. At the same time, the car will provide you with other information, which we would like you to discuss between yourselves. Basically we would like you to "think aloud" about what you are doing and thinking. We will be recording this on videotape, but please feel free to make both good and bad comments about the system. Also, between tasks the experimenter will make a few requests for the driver to operate a control in the car. When these requests are made, the driver should do them when it is safe to do so, which may not be immediately. This experiment is a test of the information system, not of your driving skills. Remember, your priority is always to drive safely. Please inform the experimenter if you are unable to complete the study. This experiment will take about 3 hours for which you will be paid $30.00 each. __________________________________________________________________ I have read and understand the above. _________________________ Print your name
_________________________ Date
_________________________ Sign your name
_________________________ Witness (experimenter)
I give my permission to be videotaped:
Yes
95
No
APPENDIX C - SUBJECTS-IN-TANDEM EXPERIMENT WRITTEN DIRECTIONS TO TEST ROUTE Written Instructions to Belleville TO BELLEVILLE L onto Baxter Rd (from UMTRI) At the end, L onto Green Rd R onto Plymouth Rd R onto US-23 South Exit on R to I-94 East (to Detroit) Take the Rawsonville Rd exit, Exit 187 (it's the 5th exit) R out of exit onto Rawsonville Rd Get into L lane on Rawsonville Rd, (R lane ends after 1st traffic light) At 3rd traffic light, L onto Huron River Dr S Turn R onto Elwell Rd, in about 2 miles. There will be a yellow sign just before the intersection. Turn R into St. Paul's church parking lot, on corner of Elwell and Huron River Dr. PLEASE DRIVE SLOWLY ON ELWELL AFTER MAKING THE TURN.
97
APPENDIX D - SUBJECTS-IN-TANDEM EXPERIMENT SUBJECT INSTRUCTIONS Before subjects arrive Have ready the bio forms, consent form, both post-test questionnaires, vision tester, labeled videotapes and floppy disks, payment forms and cash, pens, clipboards, written directions to Belleville, map (and phone or CB). Be sure car is ready with the appropriate systems and modes. Car is set-up. HUD is in place. (Route guidance, traffic information, IVSAWS, vehicle monitoring ready.) Make sure splitter camera cable in into VCR, and the monitors are plugged in. When subjects arrive at UMTRI Hi, are you ______(participants' names)? I'm _______(experimenter). Thank you both for coming today. Let's go down to the conference room and get started. This experiment will take about 3 hours for which you each will be paid $30.00. The purpose of this experiment is to determine if new advanced driver information systems are easy to use. In this experiment, we will drive from here to Belleville. One of you will be the driver and the other the passenger. We'll stop in Belleville and I'll turn on an in-car information system that we are testing. It will tell you how to get to Canton. At the same time, the car will provide you with other information, which we would like you both to discuss as you use it. Before we walk down to the car, we need to fill out some paperwork. First you should decide who will be the driver. Note this on forms. Please read and sign this consent form. If you have any questions, feel free to ask. Also, there are a few more questions on this biographical form. Fill out consent and bio forms. Run vision test for one person and have other fill out bio form, then switch. We also need to run a vision test for both of you. Do vision test for both subjects: Can you see in the first diamond that the top circle is complete, but that the other 3 are broken? If you look at the second diamond, can you tell me which circle is complete? Continue until two in a row wrong. There are 3 parts to this trip: 1) driving to Belleville using written instructions, 2) driving from Belleville to Canton using the in-car system, and 3) returning to Ann Arbor using a map. On the trip from Ann Arbor to Belleville and on the return leg from Canton, I will ask the driver to operate several items in the car. These tasks will include: 1) turning the radio on and off, 2) changing stations using the preset buttons, 3) changing the fan speed (faster and slower), 4) reading off the speed of the car, and 5) reading off the radio station frequency (such as 107.1 FM). The requests for these will be "radio on," "radio off," "change station," "fan faster," "fan slower," "vehicle speed," and "station frequency." Do you understand?
99
When these requests are made, the driver should do them when it is safe, which may not be immediately. These requests will only be made when the in-car information system is not used. In operating these controls, the driver can discuss the request with the passenger, but the driver should be the one who operates the control or reads the display. You should both work together to get to Belleville. I'll tell you more about the other parts of the trip when we get to Belleville, which should take about 15 or 20 minutes. Any questions so far? Answer any questions. OK, we can go down to the car now. At the car You can have a seat in the car. Sit in car. Since we will be video- and audiorecording, let me point out the cameras and microphones. (If HUD condition, show the test pattern sheet. Turn nav monitor. This is a simulation of what is known as a Head-Up Display, or HUD. It is called a Head-Up Display because you don't have to lower your head to get information from a display below your field of vision (outside the window). Rather, you can keep your "head up." Later on you will receive information on it. We need to adjust this mirror for you so that you can see the entire screen. Have the mirror 1/2 the radius out from the centerline of the wheel. Adjust the mirror so that the image is fully visible.) Here are your directions to Belleville. (Give them printed instructions.) We are headed for a church there, about 20 minutes away. While this may not be the best way to get there, please follow its instructions. During this trip you are strongly encouraged to discuss the car, the controls and displays, the information you use to navigate, and so forth. Basically we'd like you to "think aloud" about everything you're doing and thinking, especially anything that is unclear or confusing. We are recording this on videotape, but please don't be shy. Any problems that you encounter are problems with the design, and not yourself. You are not the focus of this experiment, rather we are testing the system. During the trip, I won't be able to help you, unless you get lost. You should try to figure things out between the two of you. Some driving tips: Please do not exceed the speed limit--it changes often during the trip so be mindful of it. You should both keep an eye out for traffic and turns. Also, please be very careful to drive very slowly when crossing railroad tracks, and driving on bumpy roads. It is not good for our equipment. You may also notice that the car may not brake as quickly as you might expect from a smaller car. If you're ready, then we can begin! Open garage, start car, back out of garage, close and lock up garage. Adjust mirrors, steering wheel, seat; be sure seat belts are worn! Turn on inverter, then power, input the filename on the 486, start saving data. Start recording with the VCR.
100
When on US-23, at safe point begin verbal task requests (continue on I-94 if needed). Use stopwatch to record time from hands off steering wheel to hands back on steering wheel. For reading tasks, record time from end of command to response. Requests: 1 - Fan faster 2 - Fan slower 3 - Vehicle Speed 4 - Radio on 5 - Station frequency 6 - Change station 7 - Radio off If they stray from the route, direct them back. Let them make the mistake, then correct. Belleville to Canton leg (At St. Paul's church) Pull into lot, facing the church. Save data on 486. Change filename on 486. Boot up Mac from keypad. Select stack. Click on Set-Up, then Start twice; type name and number. For HUD, readjust HUD mirror so that screen is fully visible. Tell driver that the passenger can see what they are seeing on the HUD on their own display. On this part of the trip you will drive to Canton. Please follow the directions given by the car. Sometimes the route that the car gives may not be the shortest route. We have done that to see how clear the directions are in a wide range of situations. The car will also give you other information. Please discuss what it means to you aloud. If that information is a warning, proceed with caution. (Some warnings, however, are artificial, that is they are not actually happening.) On this part of the trip, both of you should work together to figure out what the car is telling you. I want to emphasize that this experiment is a test of the information system, not a test of your driving skills. Again, you should both keep an eye out for traffic and turns. Remember, please be very careful to drive very slowly when crossing railroad tracks, and driving on bumpy roads. Your priority is always to drive safely. OK, we need to make a left out of the lot, then you're on your own. Are you ready to begin? Begin collecting data on the 486. Begin recording on audio- and taperecording. Double click on Start. Check to see that they notice the open door. When they do, pretend to close your door again. If not, advance the screens.
101
Begin test route. As needed, prompt them for comments-What's happening now? Why do you think that? What makes you think that? Anything else? Any comments? Any thoughts? If an appropriate IVSAWS hazard appears, display it. If they go off route, display off route screen and direct them back to the correct location, if possible. Canton to Ann Arbor (at Hardees) When the destination is reached, stop saving on the 486. Shut down the Mac. Change the filename on the 486. On this part of the trip we are going to drive back to UMTRI. Here is a highlighted map showing the directions. As with the rest of this trip, you should work together to follow the route instructions. Also like the first part of the trip, the driver will be asked from time to time to read the speed, or operate the radio, and so forth. Do so at the pace that you normally would. Again, driving safety should never be compromised. Begin saving on the 486. When on Ford Rd, begin making and timing these verbal task requests: 1 - Radio on 2 - Change station 3 - Station frequency 4 - Radio off 5 - Vehicle speed 6 - Fan slower 7 - Fan faster back in Ann Arbor Save the data on 486. Pull car into UMTRI garage. Shut down power, then inverter. In the garage, provide subjects with both post-study questionnaires on clipboards and ask them to complete them. Complete the subject payment forms. Thank the participants, pay them, and show them to the front door.
102
APPENDIX E - SINGLE DRIVER EXPERIMENT CONSENT FORM FOR YOUNGER SUBJECTS Subject ______ Date ________ ADVANCED DRIVER INFORMATION PARTICIPANT CONSENT FORM
The purpose of this experiment is to determine if new advanced driver information systems are easy to use. In this experiment you will drive from here to Belleville, then from Belleville to Canton, and finally back to Ann Arbor. During the first and third parts of the trip, the experimenter will ask you to operate a few controls in the car, such the radio or fan. When these requests are made, you should do them when it is safe to do so, which may not be immediately. During the middle part of the trip, from Belleville to Canton, you will use an invehicle information system that will provide you with route guidance information. It will tell you how to get to Canton. At the same time, the car will provide you with other information, such as traffic and vehicle information. We will be monitoring your pupils with the use of an eye camera at this time. We will also videotape part of the study for experimental purposes. This experiment is a test of the information system, not of your driving skills. Remember, your priority is always to drive safely. Please inform the experimenter if you are unable to complete the study. This experiment will take about 3 hours for which you will be paid $30.00. __________________________________________________________________ I have read and understand the above. _________________________ Print your name
_________________________ Date
_________________________ Sign your name
_________________________ Witness (experimenter)
103
APPENDIX F - SINGLE DRIVER EXPERIMENT CONSENT FORM FOR OLDER SUBJECTS Subject ______ Date ________ ADVANCED DRIVER INFORMATION PARTICIPANT CONSENT FORM
The purpose of this experiment is to determine if new advanced driver information systems are easy to use. In this experiment you will drive from here to Belleville, then from Belleville to Canton, and finally back to Ann Arbor. During the first and third parts of the trip, the experimenter will ask you to operate a few controls in the car, such the radio or fan. When these requests are made, you should do them when it is safe to do so, which may not be immediately. During the middle part of the trip, from Belleville to Canton, you will use an invehicle information system that will provide you with route guidance information. It will tell you how to get to Canton. At the same time, the car will provide you with other information, such as traffic and vehicle information. We will videotape part of the study for experimental purposes. This experiment is a test of the information system, not of your driving skills. Remember, your priority is always to drive safely. Please inform the experimenter if you are unable to complete the study. This experiment will take about 3 hours for which you will be paid $30.00. __________________________________________________________________ I have read and understand the above. _________________________ Print your name
_________________________ Date
_________________________ Sign your name
_________________________ Witness (experimenter)
105
APPENDIX F - TASK DIFFICULTY QUESTIONNAIRE FOR HUD AND IP ROUTE GUIDANCE USERS (BOTH EXPERIMENTS) Please rate the difficulty of performing each of these tasks while driving, using the scale below, by circling your response. Not Difficult
Extremely Difficult
|------|------|------|------|------|------|------|------|------| 1
2
3
4
5
6
7
8
9
10
Changing stations on the car radio using presets 1 2 3 4 5 6 7
8
9
10
Turning on & off the car radio 1 2 3 4
8
9
10
Adjusting the fan speed on the car heater or air conditioner 1 2 3 4 5 6 7 8 9
10
Looking at street numbers to locate an address 1 2 3 4 5 6 7
8
9
10
Reading a map 1 2
3
4
5
6
7
5
6
7
8
9
10
Talking with other people in the car 1 2 3 4 5
6
7
8
9
10
Reading the speed on the speedometer 1 2 3 4 5 6
7
8
9
10
Drinking a beverage 1 2 3
7
8
9
10
4
5
6
Changing a tape cassette in a car stereo 1 2 3 4 5 6 7 8 9 10 __________________________________________________________________
107
Please rate the difficulty of performing each of these tasks while driving. Not Difficult
Extremely Difficult
|------|------|------|------|------|------|------|------|------| 1
2
3
4
5
6
7
Hearing the traffic information report alert tone 1 2 3 4 5 6 7
8 8
9 9
10 10
Reading the traffic information reports 1 2 3 4 5 6 7 8 9 10 __________________________________________________________________ Reading the information on the route guidance system 1 2 3 4 5 6 7 8
9
10
Determining the next maneuver you should make from the route guidance system 1 2 3 4 5 6 7 8 9 10 Looking for the next turn indicated by the route guidance system 1 2 3 4 5 6 7 8 9
10
Looking at the route guidance screen to see it update 1 2 3 4 5 6 7 8 9 10 __________________________________________________________________ Identifying the hazard from the safety advisory warning system 1 2 3 4 5 6 7 8 9
10
From the safety advisory warning system, understanding the location of the hazard 1 2 3 4 5 6 7 8 9 10 Looking out the window for the hazard identified by the safety advisory warning system 1 2 3 4 5 6 7 8 9 10 __________________________________________________________________ Identifying the problem from the vehicle monitoring system 1 2 3 4 5 6 7 8
9
10
Determining where the problem is on the car from the vehicle monitoring system 1 2 3 4 5 6 7 8 9 10 Determining the severity of the problem from the vehicle monitoring system 1 2 3 4 5 6 7 8 9 10 Determining what action to take based on the problem on the vehicle monitoring system 1 2 3 4 5 6 7 8 9 10
108
APPENDIX G- TASK DIFFICULTY QUESTIONNAIRE FOR AUDITORY ROUTE GUIDANCE USERS (BOTH EXPERIMENTS) Please rate the difficulty of performing each of these tasks while driving, using the scale below. Not Difficult
Extremely Difficult
|------|------|------|------|------|------|------|------|------| 1
2
3
4
5
6
7
8
9
10
Changing stations on the car radio using presets 1 2 3 4 5 6 7
8
9
10
Turning on & off the car radio 1 2 3 4
8
9
10
Adjusting the fan speed on the car heater or air conditioner 1 2 3 4 5 6 7 8 9
10
Looking at street numbers to locate an address 1 2 3 4 5 6 7
8
9
10
Reading a map 1 2
3
4
5
6
7
5
6
7
8
9
10
Talking with other people in the car 1 2 3 4 5
6
7
8
9
10
Reading the speed on the speedometer 1 2 3 4 5 6
7
8
9
10
Drinking a beverage 1 2 3
7
8
9
10
4
5
6
Changing a tape cassette in a car stereo 1 2 3 4 5 6 7 8 9 10 __________________________________________________________________
109
Please rate the difficulty of performing each of these tasks while driving. Not Difficult Extremely Difficult |------|------|------|------|------|------|------|------|------| 1 2 3 4 5 6 7 8 9 10 Hearing the traffic information report alert tone 1 2 3 4 5 6 7
8
9
10
Listening to the traffic information reports 1 2 3 4 5 6 7 8 9 10 __________________________________________________________________ Listening to the information on the route guidance system 1 2 3 4 5 6 7 8
9
10
Determining the next maneuver you should make from the route guidance system 1 2 3 4 5 6 7 8 9 10 Looking for the next turn indicated by the route guidance system 1 2 3 4 5 6 7 8 9
10
Remembering the next maneuver you should make after hearing it from the route guidance system 1 2 3 4 5 6 7 8 9 10 __________________________________________________________________ Identifying the hazard from the safety advisory warning system 1 2 3 4 5 6 7 8 9
10
From the safety advisory warning system, understanding the location of the hazard 1 2 3 4 5 6 7 8 9 10 Looking out the window for the hazard identified by the safety advisory warning system 1 2 3 4 5 6 7 8 9 10 __________________________________________________________________ Identifying the problem from the vehicle monitoring system 1 2 3 4 5 6 7 8
9
10
Determining where the problem is on the car from the vehicle monitoring system 1 2 3 4 5 6 7 8 9 10 Determining the severity of the problem from the vehicle monitoring system 1 2 3 4 5 6 7 8 9 10 Deciding what action to take based on the problem on the vehicle monitoring system 1 2 3 4 5 6 7 8 9 10
110
APPENDIX H - USABILITY AND UTILITY QUESTIONNAIRE FOR HUD AND IP ROUTE GUIDANCE USERS (BOTH EXPERIMENTS)
Please circle your response: It was easy for me to figure out how the system worked. strongly somewhat neutral somewhat strongly agree agree disagree disagree It is safe for me to use this system while driving. strongly somewhat neutral somewhat agree agree disagree
strongly disagree
I would likely use this system for my daily travel. strongly somewhat neutral somewhat agree agree disagree
strongly disagree
I would likely use this system when driving in unfamiliar areas. strongly somewhat neutral somewhat strongly agree agree disagree disagree I would use this system if I were in a hurry. strongly somewhat neutral somewhat agree agree disagree
strongly disagree
It is easy for me to use the HUD/mirror while driving. strongly somewhat neutral somewhat agree agree disagree
strongly disagree
It is safe for an inexperienced driver to use this system while driving. strongly somewhat neutral somewhat strongly agree agree disagree disagree It is safe for another passenger in the car to use this system while I drive. strongly somewhat neutral somewhat strongly agree agree disagree disagree The route guidance information provided by this system is useful. strongly somewhat neutral somewhat strongly agree agree disagree disagree The traffic information provided by this system is useful. strongly somewhat neutral somewhat strongly agree agree disagree disagree The safety advisory warning information provided by this system is useful. strongly somewhat neutral somewhat strongly agree agree disagree disagree
111
The vehicle monitoring information provided by this system is useful. strongly somewhat neutral somewhat strongly agree agree disagree disagree I would rather use a route guidance system similar to this one than use a standard paper road map to find my way. strongly somewhat neutral somewhat strongly agree agree disagree disagree I would rather use a route guidance system similar to this than use written instructions to find my way. strongly somewhat neutral somewhat strongly agree agree disagree disagree Please RANK from best to worst (1st to 4th) the following in terms of their USEFULNESS to you. (Use each number once.) ___Route Guidance ___Traffic Information ___Safety Advisory Warning System ___Vehicle Monitoring Please RANK from best to worst (1st to 4th) the following in terms of their EASE OF USE to you. (Use each number once.) ___Route Guidance ___Traffic Information ___Safety Advisory Warning System ___Vehicle Monitoring __________________________________________________________________
112
ROUTE GUIDANCE ONLY The compass was useful. strongly somewhat agree agree
neutral
somewhat disagree
strongly disagree
somewhat disagree
strongly disagree
The current block address information was useful. strongly somewhat neutral somewhat agree agree disagree
strongly disagree
The distance to the next maneuver was useful. strongly somewhat neutral somewhat agree agree disagree
strongly disagree
The current town information was useful. strongly somewhat neutral agree agree
The information about upcoming (distant) intersections was useful. strongly somewhat neutral somewhat strongly agree agree disagree disagree The timer countdown bars are useful. strongly somewhat neutral agree agree
somewhat disagree
strongly disagree
The landmarks (traffic lights, bridges, etc.) were useful. strongly somewhat neutral somewhat strongly agree agree disagree disagree __________________________________________________________________ ADDITIONAL QUESTIONS When do you plan on buying a new car? Within 5 months
6-11 months
1-2 years
3-5 years
6+ years
How much do you plan on spending? $______________ How much would you pay for an advanced driver information system (including route guidance, traffic information, safety advisory warning, and vehicle monitoring)? $______________ Additional Comments (optional) ______________________________________________________________________ ______________________________________________________________________ ______________________________________________________________________ ______________________________________________________________________
113
APPENDIX I - USABILITY AND UTILITY QUESTIONNAIRE FOR AUDITORY ROUTE GUIDANCE USERS (BOTH EXPERIMENTS) It was easy for me to figure out how the system worked. strongly somewhat neutral somewhat strongly agree agree disagree disagree It is safe for me to use this system while driving. strongly somewhat neutral somewhat agree agree disagree
strongly disagree
I would likely use this system for my daily travel. strongly somewhat neutral somewhat agree agree disagree
strongly disagree
I would likely use this system when driving in unfamiliar areas. strongly somewhat neutral somewhat strongly agree agree disagree disagree I would use this system if I were in a hurry. strongly somewhat neutral somewhat agree agree disagree
strongly disagree
It is easy for me to use the HUD/mirror while driving. strongly somewhat neutral somewhat agree agree disagree
strongly disagree
It is safe for an inexperienced driver to use this system while driving. strongly somewhat neutral somewhat strongly agree agree disagree disagree It is safe for another passenger in the car to use this system while I drive. strongly somewhat neutral somewhat strongly agree agree disagree disagree The route guidance information provided by this system is useful. strongly somewhat neutral somewhat strongly agree agree disagree disagree The traffic information provided by this system is useful. strongly somewhat neutral somewhat strongly agree agree disagree disagree The safety advisory warning information provided by this system is useful. strongly somewhat neutral somewhat strongly agree agree disagree disagree The vehicle monitoring information provided by this system is useful. strongly somewhat neutral somewhat strongly
115
agree
agree
disagree
disagree
I would rather use a route guidance system similar to this one than use a standard paper road map to find my way. strongly somewhat neutral somewhat strongly agree agree disagree disagree I would rather use a route guidance system similar to this than use written instructions to find my way. strongly somewhat neutral somewhat strongly agree agree disagree disagree Please RANK from best to worst (1 to 4) the following in terms of their USEFULNESS to you. ___Route Guidance ___Traffic Information ___Safety Advisory Warning System ___Vehicle Monitoring
Please RANK from best to worst (1 to 4) the following in terms of their EASE OF USE to you. ___Route Guidance ___Traffic Information ___Safety Advisory Warning System ___Vehicle Monitoring __________________________________________________________________
116
ROUTE GUIDANCE ONLY The distance to the next maneuver was useful. strongly somewhat neutral somewhat agree agree disagree
strongly disagree
The information about upcoming (distant) intersections was useful. strongly somewhat neutral somewhat strongly agree agree disagree disagree The landmarks (traffic lights, bridges, etc.) were useful. strongly somewhat neutral somewhat strongly agree agree disagree disagree __________________________________________________________________ ADDITIONAL QUESTIONS When do you plan on buying a new car? Within 5 months
6-11 months
1-2 years
3-5 years
6+ years
How much do you plan on spending? $______________ How much would you pay for an advanced driver information system (including route guidance, traffic information, safety advisory warning, and vehicle monitoring)? $______________ Additional Comments (optional) ______________________________________________________________________ ______________________________________________________________________ ______________________________________________________________________ ______________________________________________________________________
117
APPENDIX J - SINGLE DRIVER EXPERIMENT SUBJECT INSTRUCTIONS Part 1: driving data
Part 2: video & driving
Part 3: (first few) driving
Before subjects arrive Have ready the bio forms, consent form, both post-test questionnaires, vision tester, labeled videotapes and floppy disks, payment forms and cash, pens, clipboards, written directions to Belleville, map (and phone or CB). Be sure car is ready with the appropriate systems and modes. Car is set-up. HUD is in place. (Route guidance, traffic information, IVSAWS, vehicle monitoring ready.) Make sure splitter camera cable is plugged in to VCR, and the monitors are plugged in. When subjects arrive at UMTRI (in conference room) Hi, are you ______(participants' names)? I'm _______(experimenter). Thank you for coming today. Let's go down to the conference room and get started. This experiment will take about 3 hours for which you will be paid $30.00. The purpose of this experiment is to determine if new advanced driver information systems are easy to use. You will be driving a car on the road today that is equipped with a computerized system. We will be videotaping part of the study, (if younger subject: and also using an eye camera that records pupil characteristics). The car has 4 information systems. These are: route guidance (this information tells you how to get to a certain destination along a given route); traffic information (this will provide you with detailed traffic information); vehicle monitoring (this will alert you to the status of various parts to your vehicle, and tell you about problems that arise); and in-vehicle safety and advisory warning system (IVSAWS) (this will alert you to various nearby safety hazards on the road). You will be using all these systems while driving from Belleville to Canton. First I will explain all the systems to you, and give you a short practice using them, and then we will go out on the route. Before we get started, let's finish up this paperwork. Please read and sign this consent form, and then the bio form. If you have any questions, ask me. Provide forms. Next we need to test your vision. Can you see in the first diamond that the top circle is complete but that the other three are broke? Continue until two in a row wrong. OK, let me explain to you the types of things you will see. (Only for IP and HUD.)
119
1 - Route guidance Route guidance information tells you how to get to a certain destination. It will figure out the best way to get you there, and as you drive, tell you when to turn. (In this experiment, however, you may not be provided with the most direct route, but we're using it to test a variety of driving situations.) For VISUAL: This is an example of a route guidance screen you will see. Throughout the trip, the route guidance system will tell you where to go at intersections and expressway exits. I'll explain the screen: 1. 2. 3. 4. 5. 6. 7.
Compass - direction traveling Current town Current block address Next intersection (in green) and distance in miles to it Within map, white arrows tell you what to do at next intersection (landmarks) White arrow above map tells you the next turn or maneuver and distance Countdown blocks = 20 seconds (time to next maneuver)
As you continue along, this information will change. You'll see other cross streets, addresses and directions along the route because the route guidance system is continually updating the roads you cross or turn onto as you're driving. For AUDITORY: The route guidance system will provide you with instructions auditorially, in a human voiced message. When you start out, it will tell you the distance until the **intersection where you will make a turn, mention a landmark at that intersection (such as a stop sign or traffic light), the name of the street, and the direction to turn. This message will be worded like this, "In 2.5 miles, at the traffic light, at Main St, turn left." When you get very close to that intersection, it will remind you of the street name and direction to turn with a shorter message. These messages will start with the word "Approaching." It will sound like this "Approaching Main St, turn right." Also, if the distance is far between when you hear the original message and the "Approaching" message, you may hear a reminder message that will sound like the original one, with the updated distance. After you've completed an instruction given by the system, that is, after you've made the turn, it will tell you the next instruction. At any time, if you need to hear a message again, just say, "REPEAT," and you will hear it again, with the updated mileage. You can ask for this right after hearing a message, or when you haven't heard a message for a while.
120
An important thing to keep in mind is that before you have to turn, you will hear a message starting with the word "Approaching." That is the final message you will hear before you need to make that turn. THE "APPROACHING" MESSAGE WILL FINISH SPEAKING AND STILL LEAVE YOU WITH ENOUGH TIME TO MAKE THE TURN. That is, the message will NOT be speaking AS YOU MAKE THE TURN. It will give you a few seconds of "advanced warning" telling you that you are nearing the turn. Do you have any questions? 2 - Traffic Information Sometimes instead of route guidance, you will briefly see traffic information describing an accident, congestion, a construction site, or other traffic problem. This will give you detailed information about the situation. You will hear two beeps before that information appears on the screen. Here's what one might look like. Show traffic information screen. Explain information on it. When the traffic information system detects a problem, the route guidance system will re-route you to avoid that traffic problem. 3 - Safety Advisory and Warning You will also receive information about various hazards nearby, for example a police car with its flashers on, an traffic light out-of-order, or a train at the crossing, among other things. It will also tell you where the hazard is, in relation to your car, for example, ahead, or behind, to left, etc., but not how it is moving. Here is an example of what one might look like. Before this message appears you will hear two beeps also. Show screen. This side identifies the hazard, and this will tell you where the hazard is. During the experiment, some of the warnings you receive will not be real. You should proceed with caution for all of them, however. 4 - Vehicle Monitoring Finally, you will receive information that would tell you about the status of parts of your car. Before one of these screens appears, you will hear two beeps. Show an example of vehicle monitoring. This is your car, with the top being the front of your car. If a problem arises, you will hear a tone, and a message will appear identifying it. Depending on the type of problem, you may see a symbol (like the ones you're used to seeing on your instrument panel), and a symbol identifying where the problem is. The types of problems that might arise include: Low fluid levels, high engine temperature, etc. Also, problems are color-coded for their severity. A message in a red box is most urgent, a yellow box is moderate, and a white box is minor. Messages will appear
121
at the top of the screen, and get pushed down the list as new ones appear, so that the new message is on top. Do you have any questions? Answer any questions. On the trip from Ann Arbor to Belleville and on the return leg from Canton, I will ask you to operate several items in the car. These tasks will include: 1) turning the radio on and off, 2) changing stations using the preset buttons, 3) changing the fan speed (faster and slower), 4) reading off the speed of the car, and 5) reading off the radio station frequency (such as 107.1 FM). The requests for these will be "radio on," "radio off," "change station," "fan faster," "fan slower," "vehicle speed," and "station frequency." Do you understand? When these requests are made, you should do them when it is safe, which may not be immediately. These requests will only be made when the in-car information system is not used. Remember, we are not testing your driving ability, we are testing the design of the systems. OK, now that you understand that, let's go down to the car. At the car You can have a seat in the car. If HUD, adjust it so that the entire screen is visible. OK, this is where you will receive the route guidance information, only. And here is where you will receive traffic information, vehicle monitoring, and safety advisory warning. For the first part of the trip out to Belleville, you will go through a short practice to get used to the systems I showed you before. The end of the practice route will send us on our way to Belleville. Do you have any questions? Let's begin then. Why don't you adjust the seat, steering wheel and mirrors. Open garage, start car, and back out. Close garage. Start up inverter, then power source. Start up Mac with keypad. When 486 is ready, type in filename (SUBJ#.AAA) and other information. Click on Aud or Vis PRACTICE, then Set-up, then double click on Start. When around to the front of the building, press continue (numberpad) to begin. Turn right onto Huron Pkwy. **Start saving data on the 486 and the VCR. Go through practice route. Correct for any wrong turns. When done, verbally guide the participant to the beginning of the test route. Stop VCR. (Take 23 South to 94 East. Right onto Rawsonville Rd, then left on Huron River Dr, and right into St. Paul's.) At Belleville OK, this is where we'll begin using the information system, but first we have to put on the eye camera. Save data on the 486. Change filename to SUBJ#.BBB. Quit
122
out of SuperCard, then click on Aud or Vis test sequence. Click on Set-up, then twice on Start. Type in subject name and number. FOR YOUNG: Put on and calibrate the eye camera. :( Eye Mark Calibration Procedure 1. Adjust all axis and focus knobs to the median position (for maximum adjustability). Be sure cables are correctly connected, and turn on power switches. 2.
On the remote, select: Function: EMR; Mode: 1; EMR: •; Camera: C; LED: R (on); Comp.: 1st LED (of 16).
3. Place camera on participant's head. While participant stabilizes camera, experimenter adjust head straps and rear clasp so that pupil is centered vertically in the goggles. 4. Looking in the hand-held monitor locate the pupil. Adjust the focus knob so that the pupil is clear. Center the pupil in he view finder by turning the X-Axis and Y-Axis knobs on the side of the head unit. Next, adjust the LED's stem knob so that the eye spot is at its brightest intensity on the pupil. Adjust the Parallax 5.
On the remote, select: Camera: A; Mode: 2; EMR Spot: +, ; Bar: (on).
6. On the head unit, focus Camera A. For this study, angle the camera down as far as possible (max = 15o). 7. Adjust the eye mark (+) to the center of the cross hairs. Have participant tilt head so that a focal point is centered in image on the view-finder (centered on the cross hairs). Then have the participant stare at that point while experimenter adjust the XAxis and Y-Axis knobs until the eye mark is also centered on the cross hairs. Adjustment of the Electrical Magnification 8. Press the X Up and Y Up buttons on the remote so that the LED Comp is in the 7th position (of 16).
123
9. Ask the participant to look at an object in each corner of the visual fields (as seen on the hand held view finder). While participant is looking at each spot, press the Xand Y-, Up and Down buttons on the remote so that the eye mark and the spot where the participant is looking coincide. 10.
On the remote, select:
Bar:
(off).
For this part you are on your own. You are trying to get to a restaurant in Canton, which is about 35 minutes away. The computer is already programmed to instruct you there. Remember that this is not necessarily the quickest way to get there. Also, please be sure to drive VERY SLOWLY over railroad tracks, and bumpy roads and to obey the speed limit. I won't be able to help you beyond here, unless you get lost. Do you have any questions? When you are ready, you can make a left out of the parking lot. **When ready, start saving data on the 486 and the VCR and click on begin. **IF YOUNG: Remove eye camera halfway through route. Drive through test route, and assist if they get off route. At Canton Hardee's Pull into parking space behind Bob Evan's. Save data on 486. (Keep recording on VCR.) Switch camera splitter to driver only (to the right). OK, we're done with that part. Now I just have a few questions for you. 1. 2. 3. 3. 4.
5.
Before I ask you a few questions, do you have any comments at this point? Overall, how easy was it to use this system? How easy was it when you first started using it? What was easy? What did you like about it? Why? What was difficult? What didn't you like? Why? How easy was it to drive reading from the screens? In terms of how the information was presented, how easy was the Route Guidance system? ...the vehicle monitoring system? ...the safety advisory warning system? ...the traffic information? Is there anything you would change, add, or get rid of?
Save data on the 486, and then give it another filename SUBJ3.CCC. Shut down the Mac. When ready to go back. Direct the driver back to UMTRI verbally. if collecting driving data, save on 486. When back at UMTRI
124
Pull up to the garage. Save data on the 486. Shut down Mac. Shut off the Power source and then the inverter. Open the garage, pull in, turn the car off, and then close up the garage. Provide subject with questionnaires, pen, and clipboard. Make sure all questions are answered. Ask participant to fill out payment form, pay them, and thank them. Walk them to the front door.
125
APPENDIX K - EXAMPLE TRANSCRIPT FOR IP ROUTE GUIDANCE SUBJECTS-INTANDEM TEST SESSION. Comments from the driver (D), a younger female, and the passenger (P), a younger male, are shown in table 44. Table 44. Comments from driver and passenger in IP route guidance condition of subjects-in-tandem experiment. Speaker P D D P D
Comment I think it counts down for you. Oh, does it? Right on Madelon...Angola, that’s this one [pointing to Angola St]. ... Is that the one you want [Madelon St]. OK, here it is [at Madelon St].
D P
School bus ahead to left (IVSAWS) School bus. Stop...ahead to left..? What? What does that mean? [pointing to “ahead to left”] Ahead to left, umm? It’s telling you it’s ahead to the left...stop for a school bus. Make a left, right? [onto Clarence St.] I think that was telling you where it is.
D P
Straight. ... This is cool. It tells you every stop sign.
P
It’s good because it tells you the distance. In the written [instructions] it tells you about 2 miles. In this one, it tells you it is 2 miles
P D P
D P D
Oil change due 300 miles (Vehicle monitoring) Oil change due 300 miles. [laughs] Are you supposed to change it every 300 miles? I don’t know.
P
I’m watching it subtract from it [the mileage countdown to next intersection].
P
Construction (On-the-fly IVSAWS) Oh look, holy cow, how did it know?
D P
Accident (Traffic information) Accident. Accident, go to the right, because the left and middle lanes are blocked...
127
Table 44. Comments from driver and passenger in IP route guidance condition of subjects-in-tandem experiment (continued). Speaker
Comment
D
Accident.
P D P D
Did you watch the address? I know, it changes. I think this is neat. yeah, it’s really neat.
D P D
New traffic light (IVSAWS) New traffic light ahead. They even know if there’s a new traffic light. too bad it doesn’t tell you what kind of road it is, like 2 lane, or ... or tell you how much traffic there is.
Accident ahead (IVSAWS)
D
Michigan left turn screen (Route guidance) You make a right, and then a u-turn. You know what would be good, if it told you where the gas stations were. If it told you if you had to get off an exit... Or if it told you how long this takes..
D
Replace turn signal lamp (Vehicle monitoring) Replace turn signal lamp.
D
Hardee’s [reads screen]...There it is! Past the light.
D P
128
APPENDIX L - EXAMPLE TRANSCRIPT FOR AUDITORY ROUTE GUIDANCE SUBJECTS-IN-TANDEM TEST SESSION Comments from the driver (D), a younger male, and the passenger (P), a younger male, are shown in table 45. Table 45. Comments from driver and passenger in auditory route guidance condition of subjects-in-tandem experiment. Speaker Comment D Your door is open...Thank you. P D P
P
Let me look at some signs here... (Did I miss my turn or something?) ...to see if we’re on Columbia or Huron River Drive...Because that wasn’t point nine five miles. It must have been. Maybe I should have...It said “just before the traffic light,” what traffic light? This is Columbia
D P D P D P D
Construction ahead (IVSAWS) Whoa! Smart. Keep going, to the traffic light. I know. Oh, right, I thought you were going to turn. No. On to...Huron River Dr. What do I do now?
D P
It makes sure you turn right, doesn’t it? Yeah, its pretty good about it.
D
Here we are, and I'm turning right. Off route (Route guidance) I was supposed to make a left there, right? Oh...that’s right.
D
D
P D P D
School bus un/loading, ahead to left (IVSAWS) Do you see a bus? That’s what I'm saying. Maybe it is just in the area. I don’t even see a school crossing sign. It probably was over there [toward left] and not over there [to right] because a bus, if it stops over there, the kids have got to cross. So it’s just warning you.
129
Table 45. Comments from driver and passenger in auditory route guidance condition of subjects-in-tandem experiment (continued). Speaker Comment Oil change due 300 miles (Vehicle monitoring) P Oil change needed 300 miles. D Oh man, [laughs] so maybe at like 13,627 miles. p d P D P D
Are you checking the mileage when it says we’re so many miles away. No, the odometer really isn’t that precise. Does it work? Actually, I have a trip odometer, that’s what I should use. It’s not working? Yeah, it works, but... I’ve been using the overall odometer.
D
Repeat
D
[In 1.5 miles at Haggerty Road north, turn left] That’s what I thought, I wanted to make sure.
D P D
There we are, we’re going to make a left. We’ve got like point four. Point 4? This is probably off then. I pushed it [the trip odometer] kind of late. By the time I pushed it, I was probably off.
D P P D P D
Off route (Route guidance) [at the yellow flashing light, at Haggerty Road South] It said left, didn’t it? This is Haggerty Road, right. I could have sworn it said Haggerty Road. I guess when it said point nine, it meant point nine. Wait until we get point nine miles. What if there’s nothing there? Then the computer will tell us where to go.
D D P D
Now, this might be it. Repeat [experimenter didn’t hear?] Haggerty Rd north. Oh...that’s right, it said that.
D
REPEAT “At I 94 east, enter on the right” (Route guidance)
P
I don’t know about you, but would you like it better if it told you where you were going, before it told you how to get there? Like it said, “in point 9 miles...” Would it be better if it said, “exit at 275, in point 9 miles”?
130
Table 45. Comments from driver and passenger in auditory route guidance condition of subjects-in-tandem experiment (continued). Speaker Comment P P P D P
Accident (Traffic information) North. [driver almost went on 275 south] An accident. Where is that in relation to us, though? It already told you 275 north, so it didn’t have to say bear left after the underpass. But it just wanted to be specific. I think it could have just said exit right on Ecorse Road, let me worry about how far it is. I guess that’s good, if you don’t know where you are.
D
Accident ahead (IVSAWS) Thanks, but I don’t see an accident.
D
New traffic light (IVSAWS) That’s really good to know [sarcastically]. Is that the new pole?
D P D P D P D P D P D P P D
“At Michigan Avenue, turn right, and then make an immediate U-turn” (Route guidance) Boy, I hope I don’t get a ticket for that. No, it’s just a turn around. Yeah. Just say “west on Michigan Ave.,” And you could avoid all that. Well, actually... Because it’s going to tell you how to go left on Michigan Ave. I guess its trying to be specific. I’d rather be listening to the radio than that thing keep breaking in, saying, make a right, and then make a U-turn. I might make a right. See if I don’t know where I'm going. I don’t even know how to get to Canton. I don’t even know where we are now. I guess this would be very helpful in you were completely in an area that you don’t know. Right, especially at night. “Point one mile,” I guess they do that so that you know it’s right there. Because at night, you really can’t see the signs. If it says point one, you know point one is right there. If you come across an intersection, it’s got to be it.
131
Table 45. Comments from driver and passenger in auditory route guidance condition of subjects-in-tandem experiment (continued). Speaker Comment P Well, right there from the time it said it. If you ask it to repeat, and it says it again... D But it re-computes it though... P I don’t know, does it? D Yeah because... Repeat D P D P
See. Remember way back there it said... Did it give us the mileage back there. Yeah. Wait a minute, am I confused, did it say turn left before? Yeah, we’re going to be headed that way. To me, it should say west on Michigan Avenue.
D P D P
I see a real need for this. Do you? What’s the major advantage over a map? A map, you have to continually look at it, and you have to stop. I always look at the map before I start going, I just write an easy line on the paper and follow that. What if it’s somewhere where you really can’t even identify. I drove to Chicago this summer. For the first time, I had never been there. I got there on the same scrap piece of paper my friend gave me over the telephone. From my house to his house in Chicago. It wasn’t hard at all. Another thing, he never gave me mileage. He just said go here, and then when you get there make a left, and then when you get there, make a right.
D P P
D
Replace turn signal lamp (Vehicle Monitoring) I thought I was doing something wrong, thank you. That’s the kind of thing that it should tell you when you first start the car up, it should not bother you with that while you’re driving. Yeah, you’re right.
D
“Destination reached” (Route guidance) I really like that. I like that when it said that.
D P
132
APPENDIX M - TRIP TIMELINE FOR YOUNGER DRIVER IN INDIVIDUAL DRIVER EXPERIMENT Figure 50 shows an event timeline for the whole route driven by a younger subject. (Note, “glance” here was referred to as glance in the text above.) Event Off route Beep Change lanes Enter/exit ramp Right turn Left turn Glance
0
20
40
60
80
100
120
Time (seconds)
Figure 50. Trip timeline for a younger driver.
133
140
160
Event Off route Beep Change lanes Enter/exit ramp Right turn Left turn Glance
170
190
210
230
250
270
290
310
Time (seconds)
Figure 50. Trip timeline for a younger driver (continued).
Event Off route Beep Change lanes Enter/exit ramp Right turn Left turn Glance
320 340 360 380 400 420 440 460 480 500 520 540 560 Time (seconds)
Figure 50. Trip timeline for a younger driver (continued).
134
8 Event Off route 7 Beep6 Change lanes 5 Enter/exit ramp 4 Right turn 3 Left turn 2 Glance 1 0 570
590
610
630
650
670
690
710
730
750
770
Time (seconds)
Figure 50. Trip timeline for a younger driver (continued).
Event Off route Beep Change lanes Enter/exit ramp Right turn Left turn Glance
770
810
850
890 930 Time (seconds)
970
1010
Figure 50. Trip timeline for a younger driver (continued).
135
1050
Event Off route Beep Change lanes Enter/exit ramp Right turn Left turn Glance
1060
1100
1140
1180
1220
1260
1300
Time (seconds)
Figure 50. Trip timeline for a younger driver (continued).
Event Off route Beep Change lanes Enter/exit ramp Right turn Left turn Glance
1320
1360
1400
1440
Time (seconds)
Figure 50. Trip timeline for a younger driver (continued). 136
1480
Event Off route Beep Change lanes Enter/exit ramp Right turn Left turn Glance
1480
1520
1560
1600
1640
1680
Time (seconds)
Figure 50. Trip timeline for a younger driver (continued).
137
1720
APPENDIX N - TRIP TIMELINE FOR OLDER DRIVER IN INDIVIDUAL DRIVER EXPERIMENT Figure 51 shows an event timeline for the whole route driven by a younger subject. (Note, “glance” here was referred to as glance in the text above.) Event Off route Beep Change lanes Enter/exit ramp Right turn Left turn Glance
0
20
40
60
80
100
120
Time (seconds)
Figure 51. Trip timeline for an older driver.
139
140
160
Event Off route Beep Change lanes Enter/exit ramp Right turn Left turn Glance
170
190
210
230
250
270
290
310
330
350
370
Time (seconds)
Figure 51. Trip timeline for an older driver (continued). Event Off route Beep Change lanes Enter/exit ramp Right turn Left turn Glance
380 400 420 440 460 480 500 520 540 560 580 600 620 640 660 680 Time (seconds)
Figure 51. Trip timeline for an older driver (continued).
140
Event Off route Beep Change lanes Enter/exit ramp Right turn Left turn Glance
680
720
760
800
840
880
920
960
Time (seconds)
Figure 51. Trip timeline for an older driver (continued). Event Off route Beep Change lanes Enter/exit ramp Right turn Left turn Glance
990
1030
1070 1110 Time (seconds)
1150
Figure 51. Trip timeline for an older driver (continued).
141
1190
Event Off route Beep Change lanes Enter/exit ramp Right turn Left turn Glance
1210
1250
1290
1330
1370
1410
1450
Time (seconds)
Figure 51. Trip timeline for an older driver (continued). Event Off route Beep Change lanes Enter/exit ramp Right turn Left turn Glance
1450
1490
1530
1570
1610
1650
Time (seconds)
Figure 51. Trip timeline for an older driver (continued). 142
1690
1730
REFERENCES
1
Green, P. (1993). Human Factors of In-Vehicle Driver Information Systems: An Executive Summary (Technical Report UMTRI-93-18), Ann Arbor, MI: The University of Michigan Transportation Research Institute.
2
Green, P., Williams, M., Serafin, C., and Paelke, G. (1991). Human Factors Research on Future Automotive Instrumentation: A Progress Report, Proceedings of the 35th Annual Meeting of the Human Factors Society, pp. 1120-1124.
3
Green, P. (1992). American Human Factors Research on In-Vehicle Navigation Systems (Technical Report UMTRI-92-47), Ann Arbor, MI: The University of Michigan Transportation Research Institute.
4
Brand, J.E. (1990). Attitudes Toward Advanced Automotive Display Systems: Feedback from Driver Focus Group Discussions (Technical Report UMTRI-90-22), Ann Arbor, MI: The University of Michigan Transportation Research Institute.
5
Green, P., and Brand, J. (1992). Future In-Car Information Systems: Input from Focus Groups (SAE paper 920614) Warrendale, PA: Society of Automotive Engineers.
6
Green, P., Serafin, C., Williams, M., and Paelke, G. (1991). What Functions and Features Should Be in Driver Information Systems of the Year 2000? (SAE paper 912792), Vehicle Navigation and Information Systems Conference (VNIS'91), Warrendale, PA: Society of Automotive Engineers, pp. 483-498.
7
Green, P., Williams, M., Serafin, C., and Paelke, G. (1991). Human Factors Research on Future Automotive Instrumentation: A Progress Report, Proceedings of the 35th Annual Meeting of the Human Factors Society, Santa Monica, CA: Human Factors Society, pp. 1120-1124.
8
Serafin, C., Williams, M., Paelke, G., and Green, P. (1991). Functions and Features of Future Driver Information Systems (Technical Report UMTRI-91-16), Ann Arbor, MI: The University of Michigan Transportation Research Institute.
9
Green, P., and Williams, M. (1992). Perspective in Orientation/Navigation Displays: A Human Factors Test, Conference Record of Papers, the Third International Conference on Vehicle Navigation and Information Systems (VNIS’92), (IEEE Catalog # 92CH3198-9), Piscataway, NJ: Institute of Electrical and Electronics Engineers, pp. 221226.
10
Williams, M., and Green, P. (1992). Development and Testing of Driver Interfaces for Navigation Displays (Technical Report UMTRI 92-21), Ann Arbor, MI: The University of Michigan Transportation Research Institute.
11
Paelke, G. and Green, P. (1993). Development and Testing of a Traffic Information System Driver Interface (Technical Report UMTRI 93-20), Ann Arbor, MI: The University of Michigan Transportation Research Institute.
143
12
Serafin, C., Wen, C., Paelke, G. and Green, P. (1993). Development and Human Factors Tests of Car Phones. (Technical Report 93-17), Ann Arbor, MI: The University of Michigan Transportation Research Institute.
13
Hoekstra, E., Williams, M., and Green, P. (1993). Development and Driver Understanding of Hazard Warning and Location Symbols for IVSAWS (Technical Report UMTRI-93-16), Ann Arbor, MI: The University of Michigan Transportation Research Institute.
14
Williams, M., Hoekstra, E., and Green. P. (1993). Development and Evaluation of a Vehicle Monitor Driver Interface (Technical Report UMTRI 93-22), Ann Arbor, MI: The University of Michigan Transportation Research Institute.
15
Green, P., Hoekstra, E., Williams, M., and Wen, C. (1993). Effects of Information Modality and Landmarks on Route Guidance/Traffic Information System Usability (Technical Report UMTRI-93-31), Ann Arbor, MI: The University of Michigan Transportation Research Institute (in preparation).
16
Green, P., Hoekstra, E., and Williams, M. (1993) Further On-the-Road Tests of Driver Interfaces: Examination of a Route-Guidance System and a Car Phone (Technical Report UMTRI-93-35), Ann Arbor, MI: The University of Michigan Transportation Research Institute (in preparation).
17
Green, P. (1993). Measures and Methods Used to Assess the Safety and Usability of Driver Information Systems (Technical Report UMTRI 93-12), Ann Arbor, MI: The University of Michigan Transportation Research Institute.
18
Green, P. (1993). Suggested Procedures and Acceptance Limits for Certifying the Safety and Ease of Use of Driver Information Systems (Technical Report UMTRI-93-13), Ann Arbor, MI: The University of Michigan Transportation Research Institute.
19
Levison and Cramer. (1993). Description of the Integrated Driver Model (BBN Report 7840), Cambridge, MA: Bolt, Beranek and Newman.
20
Levison, W.H. (1993). A Simulation Model for the Driver's Use of In-Vehicle Information Systems (TRB Paper 930935), paper presented at the Transportation Research Board Annual Meeting, Washington, DC., January 10-14, 1993.
21
Green, P., Levison, W., Paelke, G., and Serafin, C. (1993). Suggested Human Factors Guidelines for Driver Information Systems (Technical Report UMTRI-93-21), Ann Arbor, MI: The University of Michigan Transportation Research Institute.
22
Rice, D.P, MacKenzie, E.J., and Associates (1989). Cost of Injury in the United States: A Report to Congress, San Francisco, CA: Institute for Health and Aging, University of California and Injury Prevention Center, The Johns Hopkins University.
23
Paelke, G. (1992). Development of a Traffic Information System Driver Interface. Proceedings of the IVHS-America 1992 Annual Meeting, Washington, DC: IVHS-America, pp. 793-802.
24
Card, S. K., Moran, T., and Newell, A. (1983). The Psychology of Human-Computer Interaction, Hillsdale, NJ: Lawrence Erlbaum Associates.
144
25
Tullis, T. S. (1983). The Formatting of Alphanumeric Displays: A Review and Analysis, Human Factors, 25(6), pp. 657-682.
26
Green, P., and Baker, D. (1987). Page format and user understanding of command language computer manuals. In Mark, L.S., Warm, J.S., and Huston, R.L. (eds.), Human Factors and Ergonomics: Recent Research. New York, NY: Springer-Verlag, Inc.
27
Kames, A.J. (1978, November). A study of the effects of mobile telephone use and control unit design on driving performance. IEEE Transactions on Vehicular Technology, VT-27(4), pp. 282-287.
145