2014 IEEE 10th International Colloquium on Signal Processing & its Applications (CSPA2014), 7 - 9 Mac. 2014, Kuala Lumpur, Malaysia
Integrating Open Source GIS and Google EarthTM for Managing Rural Waterborne Outbreaks Abdul Rauf Abdul Rasam, Noor Adielia Abdul Wahab, Rosmadi Ghazali and Zaharah Mohd Yusoff Centre of Studies for Surveying Science and Geomatics. Faculty of Architecture, Planning and Surveying Universiti Teknologi MARA (UiTM), Malaysia
[email protected],
[email protected]
Abstract— Limitation of cost and staff skill in using GIS technologies for health sectors are common barriers in developing countries. Cholera is the life-threatening disease that gives a major problem to the global region. This study demonstrates the potential applications open source GIS software and Virtual globes technology (e.g. Google EarthTM) in local waterborne outbreaks mapping and analysis. This integrated technologies showed the disease database and map could dynamically display and qualitatively create a model hypothesis regarding relationship between the disease and its potential risk factors. Quantum GIS (QGIS) as the Open Source GIS software used to create geodatabase and map of cholera risk distribution, and then the software was combined with Google EarthTM to analyze the cholera spatial-temporal pattern in the high risk areas (e.g. populous and coastal areas). The technologies are not only strengthen local public health capacity but also assist policy makers and health practitioners to implement GIS and mapping technologies in their disease control programme and research.
water supply and sanitation, or a shift in the population of the camp can increase the risk of cholera infection. However, the outbreak has never arisen from dead bodies. According to WHO (2012), the number of cholera cases reported is continues to rise. From 2004 to 2008, cases increased by 24% compared from 2000 to 2004. But in 2008, a total cases were informed is 190 130 cases from 56 countries, including 5143 deaths. There are still more cases were unaccounted due to limitations in surveillance systems and fear of trade and travel sanctions. The true estimation of the disease is about 3–5 million cases and 100 000–120 000 deaths for every year. From this report, shows the cholera outbreak become increase from a year to year. So, the prevention has to be taken to control the increasing of cholera disease. The existence of cholera cases in the certain area show the presence of the basic infrastructure problem such as water treatment and sanitation practices. Although cholera may be life-threatening, prevention of the disease is normally easy if proper sanitation practices are followed [27]. A conventional method is used by the health authority to conserve their disease surveillance management. The options available to prevent the disease include a good of water supply and sanitation, taking more seriously in personal hygiene, food preparation and health education, and vaccines. The prevention for food preparation including avoid contaminated water, ice and food and avoid ice cream from unreliable sources. Furthermore, health education is general prevention way that aims at communities adopting preventive behaviour for averting contamination. Besides using the conventional method, advanced technology (e.g. geospatial) should be applied to indicate the development of cholera outbreak by year. The technology is an essential tool to control and prevent cholera outbreak. Open Source GIS techniques technology is one of the GIS sources which are the outstanding software and free software that can visualize and analyze the data. The Open Source GIS is used to define the advanced method for control the environmental risk factors on human health. Virtual Globes technology (e.g. Google EarthTM) is also preferred by users in showing simulation and dynamically transmission of the diseases. These software allow researchers to monitor the disease by its location and its relationship between the suitable variable that
Index Terms - Open Source GIS, Google Earth, Quantum GIS (QGIS), Spatial Mapping and Analysis, Waterborne and food borne disease
I.
REVIEW ON GIS APLLICATIONS IN WATERBORNE AND FOODBORNE DISEASES (CHOLERA)
Vibrio cholerae is a type of bacteria that can cause the intestinal infection or cholera. In the other word, cholera is a waterborne and foodborne disease caused by taking of food or water contaminated with the bacterium [27]. When this infection occurs, it can result in an acute, diarrheal illness that may lead to severe dehydration and death within a few hours. According to WHO (2012), there are an estimated 3–5 million cholera cases and 100 000–120 000 deaths due to cholera for every year. The risk factors of cholera disease include exposure to polluted or untreated drinking water and also living in or travelling to the areas where there is cholera disease. A type of Vibrio bacteria has been related with shellfish, especially raw oyster. Cholera transmission is closely related to poor environmental management for example in places with poor sanitation, crowding, war, and food crisis [1,2,3,4,25,26,30]. The incidence of cholera disease also occurs when the basic infrastructure is not available, where minimum requirements of clean water and sanitation are not met. The other risk factors are the consequences of a disaster such as disruption of
978-1-4799-3091-3/14/$31.00 ©2014 IEEE
62
2014 IEEE 10th International Colloquium on Signal Processing & its Applications (CSPA2014), 7 - 9 Mac. 2014, Kuala Lumpur, Malaysia
EarthTM, assisting for the improvement of disease data collation, exploration and visualization.
applicable with the investigated cases as conducted by previous researches in managing vector borne cases [5,32] . II.
METHODOLOGY
III.
Overall steps used in this study were preliminary study, data collection, data processing, data result and analysis (Fig. 1). First step was preliminary study which included the selection on study area, problem statements, aim and objectives, and review study cases. This stage also presented the roughly view about the study area, Kota Kinabalu, Sabah (Fig. 2) which was recorded minimal cases in 2010 and 2011.
RESULT AND ANALYSIS
This section discusses the results obtained from the study which are spatial distribution and pattern analysis of the cases, and exploring open source GIS potentials in the disease management: A. Spatial Distribution of Cholera Cases Figure 3 shows the general geographical distribution of cholera risk in Kota Kinabalu from 2005 to 2011. The point of cases was distinguished with different colors according to the different year. There were seven years of cholera cases involved in the study. The yellow color of point cases represented the cases in 2005 cases which had the highest number of cholera cases while the bright green represented the cases in 2009 which had the lowest number of cholera cases. The numbers of cholera cases were higher in 2005, then the cases were decreased from 2006 to 2009, It can be concluded that almost all point cases of cholera incidence located near to coastal line and river. Coastal water is due to natural cause occurrence of cholera bacteria in the environment. Thus, this statement was proved that the life cycles of cholera bacteria came from natural environment such as coastal water [2,4,30].
Preliminary Study
Data Collection
Data Processing
Mapping and Analysis
Result and Conclusion Fig. 1. General workflow of methodology
Fig. 2. Location of study area (http://en.wikipedia.org/wiki/Kota_Kinabalu).
Data collection was second steps conducted where the main datasets; topographical map and cholera cases were obtained from Department of Surveying and Mapping Malaysia (DSMM) and State Health Department, Sabah (JKN, Sabah) respectively. Next step was data processing which involved particular software and tools. QGIS and Google EarthTM were utilized to map and analyze the distribution of the outbreaks. There were several types of analysis method were carried out for this cholera cases study consisting of point density analysis, kernel density estimation, and buffering analysis. Data analysis was conducted by combining with Google
Fig. 3. Geographical distribution of cholera outbreaks in Kota Kinabalu from 2005 to 2011.
63
2014 IEEE 10th International Colloquium on Signal Processing & its Applications (CSPA2014), 7 - 9 Mac. 2014, Kuala Lumpur, Malaysia
B. General Spatial Pattern Analysis of Cholera Distribution The spatial pattern analysis of cholera distribution from 2005 to 2011 were categorized into main points namely spatial pattern analysis of cholera outbreaks in Kota, temporal pattern analysis of cholera outbreaks in Kota Kinabalu, cholera cases distribution by population and by reservoir. Figure 4 and Figure 5 display the endemic areas of the cases in Kota Kinabalu. It was found out that the pattern of the cases was random and clustered where the area characteristics were lower socio economic groups and poor hygienic environment. These phenomena revealed that those cases could be occurred anywhere especially in unhygienic areas [2,30].
Tuaran
Penampang
Tuaran
Penampang
Fig. 5. Spatial pattern of cholera outbreaks in Kg. Numbak from 2005 to 2011. (Images extracted from Google Earthtm).
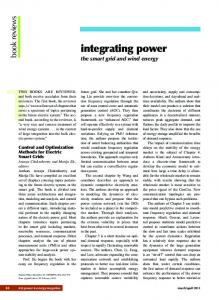
Fig. 6 shows the kernel density of cholera cases distribution by population in Kota Kinabalu from 2005 to 2011. There were three types of dangerous indicator used which were low, medium, and high level. The green colour represents low density, the orange colour represents medium density and the red colour represents the high density. Generally the distribution of the cases was close to the residential area because it showed the sources of food and water that they got from. According to Kaper (1995) [12], the vehicle of transmission for cholera outbreak can be divided into two such as consumption of water from a water system and transmitted by food. It showed that the region of cholera distribution was close to a residential area sharing contaminated food and water sources.
Fig. 4. Spatial pattern of cholera outbreaks in Pulau Gaya from 2005 to 2011. (Images extracted from Google Earthtm).
64
2014 IEEE 10th International Colloquium on Signal Processing & its Applications (CSPA2014), 7 - 9 Mac. 2014, Kuala Lumpur, Malaysia
capable in producing health mapping and analysis with the same contribution of GIS Commercial software. The software has the capabilities to produce mapping, spatial analysis, and management of the disease outbreaks. The potential operations include such as spatial data input, to view and process raster and vector data image, to do the geometric transformation and projection, conduct database management, the data entry and verification, and database management. However, the software has slightly different to joining attribute data to vector data. The data that was come from Excel Worksheet has to convert to .csv (Comma Separated Value) file before joining the data attribute. The software is also capable to process for cartography symbolization, mapping, visualization and data exploration. IV.
Fig. 6. Kernel density of cholera cases distribution by population in Kota Kinabalu from 2005 to 2011.
CONCLUSION
There are several positive inputs from this study which consists of the study of using QGIS as Open Source GIS and Google EarthTM for cholera spatial analyzing in Kota Kinabalu, Sabah. QGIS has the capabilities for cholera spatial analyzing. QGIS can use for creating database, geoprocessing and mapping the cholera outbreaks. For the attribute data management or database, QGIS can verify the data entry. QGIS can also display the data such as for example the point of cases can be differentiated using symbolization. For data analysis, QGIS has capabilities to do buffering, spatial statistic such as point in polygon and point density. The final mapping also can be export as JPEG, PDF, and many types of image format. In conclusion, JKN, Sabah may use QGIS as Open Source GIS for new software to enhance the spatial disease mapping and analysis.
Figure 7 illustrates the overall of cholera cases distribution by reservoir in Kota Kinabalu from 2005 to 2011. The buffering analysis was referred to coastal line and river of the study area. The distance chosen for buffering analysis was 100m for both coastal line and river. There were 258 cholera cases occurred in the coastal and river buffering with distance less than 100m. Only 29 cholera cases occurred in the coastal and river buffering with distance more than 100m. It showed that the disease is related with contaminated water supply such as river, well, seawater and others.
ACKNOWLEDGMENT The authors acknowledge the invaluable guidance and datasets support from State Health Department in Sabah (JKN, Sabah), and Department of Survey and Mapping Malaysia (DSMM). Great thanks to UiTM for Research Intensive Faculty fund. REFERENCES [1] Aarogya.com, “Who is Commonly Affected by Cholera?,” Retrived
December 17, 2012, from www.aarogya.com: http://www.aarogya.com/conditions-and-diseases/cholera/3535who-is-commonly-affected-by-cholera.html. 2012. [2] A.R. Abdul Rasam, A.M. Mohd Noor, N. Ahmad N, and R. Ghazali, “MyGeoHealth: GIS-Based Cholera Transmission Risk System in Sabah, Malaysia,” IEEE Xplore Digital Library, Retrieved March 2012, from http://ieeexplore.ieee.org/stamp/stamp.jsp?arnumber=05759925. 2011 [3] N.A. Abdul Wahab, and A.R. Abdul Rasam. Open Source for Spatial Analysis 0f Cholera in Kota Kinabalu, Sabah, Unpublished Dissertation, UiTM, 2013. [4] M. Ali, M. Emch, J.P. Donnay, M. Yunus, R.B. Sack. “Identifying Environmental Risk Factors for Endemic Cholera: A Raster GIS Approach,” PubMed.gov, Retrieved March 2012, from http://www.ncbi.nlm.nih.gov/pubmed/12135643.2011.
Fig. 7. Cholera cases distribution by reservoir in Kota Kinabalu from 2005 to 2011.
C. The Potential of QGIS Application in Cholera Spatial Analysis and Management The potential of QGIS 1.7.4 and Google EarthTM applications in managing cholera spatial analysis were the main finding of the study. Open Source platform software was
[5] A.Y. Chang, M.E. Parrales, J. Jimenez, M.E. Sobieszczyk, S.M.
Hammer, D.J Copenhaver and R.P. Kulkarni, “Combining Google Earth and GIS mapping technologies in a dengue surveillance system for
65
2014 IEEE 10th International Colloquium on Signal Processing & its Applications (CSPA2014), 7 - 9 Mac. 2014, Kuala Lumpur, Malaysia developing countries,” International Journal of Health Geographics, 2009, 8:49
[6] A. Schoenstadt, “Prevention of Cholera.eMedTV,” Retrieved April [7]
[8] [9] [10]
[11]
[12] [13] [14] [15] [16] [17]
[18]
[19]
[20]
[21]
2012, from http://diarrhea.emedtv.com/cholera/prevention-ofcholera.html. 2006. B. Vanmeulebrouk, U. Rivett, A. Ricketts, and M. Loudon, “Open Source GIS for HIV/AIDS Management,” International Journal of Health Geographics. Medscape news, Retrieved April 2012, from http://www.medscape.com/viewarticle/585055.2009. D. Brendle-Moczuk, Open Geo-Spatial Data & FOSS GIS is The Store Really Open? SFU Vancouver. Victoria: University of Victoria. 2011. Dempsey, “Open Source GIS and Freeware GIS Applications” gislounge.com, Retrieved April 2012, from http://gislounge.com/open-source-gis-applications/. 2011 U. Gandhi, “Blogger,” Retrieved April 12, 2012, from 2010 Ujaval Gandhi. Awesome Inc. template.: http://qgis.spatialthoughts.com/2012/02/tutorial-spatial-analysispoints-in.html.2010. I. Koo I, “Cholera.About.com_Infectious Diseases,” Retrieved April 2012, from http://infectiousdiseases.about.com/od/diseasesbyname/a/cholera.ht m.2010. J.B. Kaper, J.G. Morris, and M.M. Levine, “Cholera,” Clinical Microbiological Reviews. Retrieved April 2012, from http://cmr.asm.org/content/8/1/48. 1995. L.J. Vorvick, J.M. Vyas, and D. Zieve, “Cholera,” A.D.A.M., Inc., Retrieved April 2012, from http://www.ncbi.nlm.nih.gov/pubmedhealth/PMH0001348/. 2010. M. Neteler, H. Mitasova, Open Source GIS a GRASS GIS Approach, New York: Springer Science and Business Media, 2008. Mayo Clinic, “Mayo Clinic,” Retrieved December 17, 2012, from Mayo Foundation for Medical Education and Research: http://www.mayoclinic.com/health/cholera/DS00579.2011. Ministry of Health Malaysia, [moh], Waterborne disease, Malaysia, 2006. Q.R. Mitra, “WhereInCityMedical,” Retrieved December 17, 2012, from Glow Web Services Pvt. Ltd.: http://www.whereincity.com/medical/topic/childhealth/diseases/cholera-59.htm. N. Chaikaew, N.K. Tripathi, M. Souris, “Exploring Spatial Patterns and Hotspots of Diarrhea in Chiang Mai,” International Journal of Health, Retrieved June 2012, from http://www.ijhealthgeographics.com/content/8/1/36.2009. P. Ramsey P. “The State of Open Source GIS,” Refractions Research Inc. Retrieved April 2012, from http://www.refractions.net/expertise/whitepapers/opensourcesurvey/ survey-open-source-2007-12.pdf.2007. Quantum GIS 1.8.0, “Quantum GIS description,” Retrieved December 17, 2012, from Softpedia:
[22] [23]
[24]
[25] [26] [27] [28] [29]
[30]
[31]
[32]
66
http://www.softpedia.com/get/Science-CAD/QuantumGIS.shtml.2012. Quantum GIS, “Home: Quantum GIS,” Retreived December 17, 2012, from Quantum GIS: http://www.qgis.org/.2012. R. Klasco, “Cholera: Symptoms. Better Medicine” Retrieved April 2012, from http://www.localhealth.com/article/cholera1/symptoms.2011. Rytkönen, “Not All Maps Are Equal: Gis And Spatial Analysis In Epidemiology,” International Journal of Circumpolar Health. Retrieved June 2012, from www.circumpolarhealthjournal.net/index.php/ijch/article/.../20108.2 004. S. Steiniger, and E. Bocher, “An Overview on Current Free and Open Source Desktop,” Int. J. of Geographical Information. Retrieved June 2012, from http://terragis.net/docs/presentations/sstein_foss_desktop_gis_overvi ew.pdf.2008. J.A. Suleiman, Sabah Buletin Epidemiologi. Kota Kinabalu: JabatanKesihatanNegeri Sabah.2012. V.V. Thaker, “Cholera. emedicine.medscape.com,” Retrieved April 2012, from http://emedicine.medscape.com/article/962643overview.2011. World Health Organization [WHO], Retrieved April 2012, from http://www.who.int/topics/cholera/en/.2012. Ygoy Health Community. Retrieved December 17, 2012, from ygoy Health Community: http://water.ygoy.com/2010/09/21/effects-ofcholera/.2010. Y. Shirayama, S. Phompida, and K. Shibuya, “Geographic Information System (GIS) Maps and Malaria Control Monitoring: Intervention Coverage and Health Outcome in Distal Villages of Khammouane Province, Laos,” Malaria Journal. Retrieved June 2012, from http://www.ncbi.nlm.nih.gov/pmc/articles/PMC2754997/.2009. A.R. Abdul Rasam, and A.M. Mohd Noor, “Contribution of GIS and remote sensing technologies for managing foodborne diseases in Malaysia”. IEEE Xplore Digital Library, Retrieved December 2013, from http://ieeexplore.ieee.org/xpl/login.jsp?tp=&arnumber=6287172&ur l=http%3A%2F%2Fieeexplore.ieee.org%2Fxpls%2Fabs_all.jsp%3F arnumber%3D6287172.2012. A.R. Abdul Rasam, Distributive effects of pytoplankton and sea surface temperature on cholera epidemics using satellite remote sensing and geographical information system, Masters Thesis, Universiti Teknologi MARA, UiTM, 2011. S.L. Fuentes,D.E. Quiroga, J.A. Farfan-Ale, M.A. Loroño-Pino, J. G.Rejon, S. G-Carro, V. L -Zumbardo, R.N. Vazquez, L. Eisena, Use of Google Earth to strengthen public health capacity and facilitate management of vector-borne diseases in resource poor environments, Bulletin of the World Health Organization, September 2008, 86 (9)