Nov 20, 2015 - information services, k-means, monitoring systems, multilayer .... Intelligent Sensors, Sensor Networks and Information Processing (ISSNIP '11),.
C549etukansi.kesken.fm Page 1 Tuesday, October 13, 2015 10:31 AM
C 549
OULU 2015
UNIVERSITY OF OUL U P.O. Box 8000 FI-90014 UNIVERSITY OF OULU FINLA ND
U N I V E R S I TAT I S
O U L U E N S I S
ACTA
A C TA
C 549
ACTA
UN NIIVVEERRSSIITTAT ATIISS O OU ULLU UEEN NSSIISS U
Jukka-Pekka Skön
University Lecturer Santeri Palviainen
Postdoctoral research fellow Sanna Taskila
Jukka-Pekka Skön
Professor Esa Hohtola
INTELLIGENT INFORMATION PROCESSING IN BUILDING MONITORING SYSTEMS AND APPLICATIONS
Professor Olli Vuolteenaho
University Lecturer Veli-Matti Ulvinen
Director Sinikka Eskelinen
Professor Jari Juga
University Lecturer Anu Soikkeli
Professor Olli Vuolteenaho
Publications Editor Kirsti Nurkkala ISBN 978-952-62-0990-6 (Paperback) ISBN 978-952-62-0991-3 (PDF) ISSN 0355-3213 (Print) ISSN 1796-2226 (Online)
UNIVERSITY OF OULU GRADUATE SCHOOL; UNIVERSITY OF OULU, FACULTY OF TECHNOLOGY
C
TECHNICA TECHNICA
ACTA UNIVERSITATIS OULUENSIS
C Te c h n i c a 5 4 9
JUKKA-PEKKA SKÖN
INTELLIGENT INFORMATION PROCESSING IN BUILDING MONITORING SYSTEMS AND APPLICATIONS
Academic dissertation to be presented with the assent of the Doctoral Training Committee of Technology and Natural Sciences of the University of Oulu for public defence in Kuusamonsali (YB210), Linnanmaa, on 20 November 2015, at 12 noon
U N I VE R S I T Y O F O U L U , O U L U 2 0 1 5
Copyright © 2015 Acta Univ. Oul. C 549, 2015
Supervised by Professor Kauko Leiviskä Professor Mikko Kolehmainen Docent Pertti Pasanen
Reviewed by Professor Risto Kosonen Doctor Markku Virtanen
Opponents Professor Risto Kosonen Professor Jarek Kurnitski ISBN 978-952-62-0990-6 (Paperback) ISBN 978-952-62-0991-3 (PDF) ISSN 0355-3213 (Printed) ISSN 1796-2226 (Online)
Cover Design Raimo Ahonen
JUVENES PRINT TAMPERE 2015
Skön, Jukka-Pekka, Intelligent information processing in building monitoring systems and applications University of Oulu Graduate School; University of Oulu, Faculty of Technology Acta Univ. Oul. C 549, 2015 University of Oulu, P.O. Box 8000, FI-90014 University of Oulu, Finland
Abstract Global warming has set in motion a trend for cutting energy costs to reduce the carbon footprint. Reducing energy consumption, cutting greenhouse gas emissions and eliminating energy wastage are among the main goals of the European Union (EU). The buildings sector is the largest user of energy and CO2 emitter in the EU, estimated at approximately 40% of the total consumption. According to the International Panel on Climate Change, 30% of the energy used in buildings could be reduced with net economic benefits by 2030. At the same time, indoor air quality is recognized more and more as a distinct health hazard. Because of these two factors, energy efficiency and healthy housing have become active topics in international research. The main aims of this thesis were to study and develop a wireless building monitoring and control system that will produce valuable information and services for end-users using computational methods. In addition, the technology developed in this thesis relies heavily on building automation systems (BAS) and some parts of the concept termed the “Internet of Things” (IoT). The data refining process used is called knowledge discovery from data (KDD) and contains methods for data acquisition, pre-processing, modeling, visualization and interpreting the results and then sharing the new information with the end-users. In this thesis, four examples of data analysis and knowledge deployment are presented. The results of the case studies show that innovative use of computational methods provides a good basis for researching and developing new information services. In addition, the data mining methods used, such as regression and clustering completed with efficient data pre-processing methods, have a great potential to process a large amount of multivariate data effectively. The innovative and effective use of digital information is a key element in the creation of new information services. The service business in the building sector is significant, but plenty of new possibilities await capable and advanced companies or organizations. In addition, end-users, such as building maintenance personnel and residents, should be taken into account in the early stage of the data refining process. Furthermore, more advantages can be gained by courageous co-operation between companies and organizations, by utilizing computational methods for data processing to produce valuable information and by using the latest technologies in the research and development of new innovations.
Keywords: data integration, data mining, energy consumption, indoor air quality, information services, k-means, monitoring systems, multilayer perceptron, selforganizing map
Skön, Jukka-Pekka, Älykäs tiedonjalostaminen rakennusten monitorointijärjestelmissä ja sovelluksissa Oulun yliopiston tutkijakoulu; Oulun yliopisto, Teknillinen tiedekunta Acta Univ. Oul. C 549, 2015 Oulun yliopisto, PL 8000, 90014 Oulun yliopisto
Tiivistelmä Rakennus- ja kiinteistösektori on suurin fossiilisilla polttoaineilla tuotetun energian käyttäjä. Noin 40 prosenttia kaikesta energiankulutuksesta liittyy rakennuksiin, rakentamiseen, rakennusmateriaaleihin ja rakennuksien ylläpitoon. Ilmastonmuutoksen ehkäisyssä rakennusten energiankäytön vähentämisellä on suuri merkitys ja rakennuksissa energiansäästöpotentiaali on suurin. Tämän seurauksena yhä tiiviimpi ja energiatehokkaampi rakentaminen asettaa haasteita hyvän sisäilman laadun turvaamiselle. Näistä seikoista johtuen sisäilman laadun tutkiminen ja jatkuvatoiminen mittaaminen on tärkeää. Väitöskirjan päätavoitteena on kuvata kehitetty energiankulutuksen ja sisäilman laadun monitorointijärjestelmä. Järjestelmän tuottamaa mittaustietoa on jalostettu eri loppukäyttäjiä palvelevaan muotoon. Tiedonjalostusprosessi koostuu tiedon keräämisestä, esikäsittelystä, tiedonlouhinnasta, visualisoinnista, tulosten tulkitsemisesta ja oleellisen tiedon välittämisestä loppukäyttäjille. Aineiston analysointiin on käytetty tiedonlouhintamenetelmiä, kuten esimerkiksi klusterointia ja ennustavaa mallintamista. Väitöskirjan toisena tavoitteena on tuoda esille jatkuvatoimiseen mittaamiseen liittyviä haasteita sekä rohkaista yrityksiä ja organisaatioita käyttämään tietovarantoja monipuolisemmin ja tehokkaammin. Väitöskirja pohjautuu viiteen julkaisuun, joissa kuvataan kehitetty monitorointijärjestelmä, osoitetaan tiedonjalostusprosessin toimivuus erilaisissa tapauksissa ja esitetään esimerkkejä kuhunkin prosessivaiheeseen soveltuvista laskennallisista menetelmistä. Julkaisuissa on kuvattu energiankulutuksen ja sisäilman laadun informaatiopalvelu sekä sisäilman laatuun liittyviä dataanalyysejä omakoti- ja kerrostaloissa sekä koulurakennuksissa. Innovatiivinen digitaalisen tiedon hyödyntäminen on avainasemassa kehitettäessä uusia informaatiopalveluita. Kiinteistöalalle on kehitetty lukuisia informaatioon pohjautuvia palveluita, mutta ala tarjoaa edelleen hyviä liiketoimintamahdollisuuksia kyvykkäille ja kehittyneille yrityksille sekä organisaatioille.
Asiasanat: asuinrakennukset, energiankulutus, ilmanlaatu, informaatiopalvelu, julkiset rakennukset, laskentamenetelmät, mallintaminen, mittaaminen, tiedonlouhinta
Acknowledgements This work was done at the Research Group of Environmental Informatics at the University of Eastern Finland during the years 2009-2013. The work was mainly carried out in the framework of AsTeKa (Commercializing a monitoring system for energy efficiency and healthy housing), INSULAVO (Improving the energy efficiency of buildings in Eastern Finland) and Asko (The effect of repair and supplement construction to energy efficiency and indoor air quality) projects funded by Tekes (The Finnish Funding Agency for Technology and Innovation), the European Regional Development Fund (ERDF), and the Ministry of the Environment. I would like to thank Ouman Oy, Granlund Kuopio Oy, Finnenergia Oy, Liikelaitos Kuopion Energia, Osuuskunta Suomen Asuntomessut, Niiralan Kulma Oy, Skanska Oy, and Saint-Gobain Rakennustuotteet Oy for their financial support and cooperation. First of all, I would like to thank my supervisors, Professor Kauko Leiviskä (University of Oulu) and Professor Mikko Kolehmainen (University of Eastern Finland), for supervising my thesis and for their guidance throughout my postgraduate studies. Without their support, this work would not have been possible. I am also grateful to my other supervisor Docent Pertti Pasanen (University of Eastern Finland) for his valuable comments during this time. Also, I would like to thank the preexaminers, Professor Risto Kosonen (Aalto University) and Director, Dr. Markku J. Virtanen (Global EcoSolutions Ltd.) for valuable comments to improve the quality of this thesis. Thank you for reviewing my thesis. I am grateful to my co-authors Mika Raatikainen, Markus Johansson, Okko Kauhanen, Docent Mauno Rönkkö, Professor Martti Juhola (University of Tampere), Professor Kary Främling (Aalto University) and Docent Ulla Haverinen-Shaughnessy for the fruitful collaboration and their valuable contribution during the work. I would also like to thank Ms. Marja-Leena Patronen and Ms. Karin Koivisto, who have helped me in the project management. I am forever grateful to my parents Pirkko and Juha for everything they have done for me. I wish to thank my future wife Niina, for her unwavering love, support, and constant understanding during this process.
Kuopio, 4th of April 2015
Jukka-Pekka Skön
7
8
Abbreviations ASHRAE BACnet BAS BMU CO2 DB DC DDC EU HVAC IA IAP IAQ IoT KDD LMO LOO LVQ M2M MLP MPC OGC PPM R R2 RBFN RH RMSE SBS SD SOM SVM SWE TVOC
American Society of Heating, Refrigerating and Air-conditioning Engineers Building Automation and Control Network Building Automation System Best-Matching Unit Carbon Dioxide Davies-Bouldin Index Digital Control Direct Digital Control European Union Heating, Ventilation, and Air Conditioning Index of Agreement Indoor Air Pollution Indoor Air Quality Internet of Things Knowledge Discovery from Data Leave Many Out Leave One Out Learning Vector Quantization Machine to Machine Multilayer Perceptron Model Predictive Control Open Geospatial Consortiums Parts Per Million Pearson’s Correlation Coefficient Coefficient of Determination Radial Basis Function Network Relative Humidity Root Mean Square Error Sick Building Syndrome Standard Deviation Self-Organizing Map Support Vector Machine Sensor Web Enablement Total Volatile Organic Compounds 9
URL VOC WSN
10
Uniform Resource Locator Volatile Organic Compounds Wireless Sensor Network
List of original publications This thesis consist of an overview and the following five peer-reviewed original publications, which are referred to throughout the text by their Roman numerals: I
Skön J-P, Kauhanen O & Kolehmainen M (2011) Energy Consumption and Air Quality Monitoring System. Proceedings of the 7th International Conference on Intelligent Sensors, Sensor Networks and Information Processing (ISSNIP ’11), Adelaide, Australia: 163–167. II Skön J-P, Johansson M, Raatikainen M, Haverinen-Shaughnessy U, Pasanen P, Leiviskä K & Kolehmainen M (2012) Analysing Events and Anomalies in Indoor Air Quality Using Self-Organizing Maps. International Journal of Artificial Intelligence 9(A12): 79–89. III Skön J-P, Johansson M, Raatikainen M, Leiviskä K & Kolehmainen M (2012) Modelling Indoor Air Carbon Dioxide (CO2) Concentration Using Neural Network. World Academy of Science, Engineering and Technology 61: 879–883. IV Skön J-P, Raatikainen M, Johansson M, Leiviskä K & Kolehmainen M (2013) Assessing Indoor Air Quality Measurement Correlations and Variations in School Buildings. International Proceedings of Chemical, Biological & Environmental Engineering 51: 16–22. V Skön J-P, Rönkkö M, Raatikainen M, Juhola M, Främling K & Kolehmainen M (2013) Research on Computational Intelligence for Co-Learning Enabled Healthy and Sustainable Housing. Proceedings of the Scientific Cooperations International Conferences in Electrical and Electronics Engineering, Advances in Control Engineering (ACE ’13), Istanbul, Turkey: 57–64.
11
12
Contents Abstract Tiivistelmä Acknowledgements 7 Abbreviations 9 List of original publications 11 Contents 13 1 Introduction 15 1.1 Background ............................................................................................. 15 1.2 Building automation and smart homes .................................................... 16 1.3 Indoor air quality..................................................................................... 18 1.4 Computational intelligence ..................................................................... 20 1.5 Data mining ............................................................................................. 20 1.6 Research problem .................................................................................... 21 1.7 Aims of the thesis .................................................................................... 22 1.8 The author’s contribution ........................................................................ 22 1.9 The structure of the thesis ....................................................................... 23 2 Monitoring system, environment, and data 25 2.1 Overview ................................................................................................. 25 2.2 Measurements ......................................................................................... 26 2.3 Data transfer unit ..................................................................................... 27 2.4 Challenges in indoor measurements........................................................ 27 2.4.1 Wireless sensor networks ............................................................. 28 2.4.2 Sensors ......................................................................................... 28 2.4.3 Sampling frequency ...................................................................... 28 2.5 Indoor air quality data ............................................................................. 29 2.6 Development directions .......................................................................... 30 3 Data pre-processing, computational methods, and model validation 33 3.1 Data pre-processing................................................................................. 33 3.2 Feature extraction and variable selection ................................................ 34 3.3 Computational methods .......................................................................... 35 3.3.1 Self-organizing maps .................................................................... 35 3.3.2 Multilayer perceptron ................................................................... 37 3.3.3 K-means clustering ....................................................................... 38 3.4 Model evaluation..................................................................................... 39 13
4 Results of the data analysis 43 4.1 Problem identification ............................................................................. 43 4.2 Data acquisition and storage ................................................................... 44 4.3 Data pre-processing ................................................................................. 45 4.4 Data mining ............................................................................................. 46 4.5 Interpretation of results ........................................................................... 53 4.6 Knowledge deployment .......................................................................... 56 5 Discussion 59 5.1 Benefits of continuous monitoring and challenges of implementation ........................................................................................ 60 5.2 Data-driven problem solving and information services .......................... 61 5.3 Innovative use of data ............................................................................. 62 5.4 Ideas for future work ............................................................................... 63 6 Conclusion 65 References 67 Original publications 73
14
1
Introduction
1.1
Background
Nowadays, we are living in an information society, which can be defined briefly as a creative society that is based on interaction (Himanen 2004). In the information society, information and communication technology has a major role, enabling access to the available information and services that aim to improve the quality of life. Although new technology has a major role in the information society, the most important thing is the way of doing things. (Castells & Himanen 2002, Castells 2004). Energy efficiency in housing and a healthy living environment is one of the fields where new technology and services are needed. Recently increased interest in energy efficiency is thought to have a detrimental effect on indoor air quality (IAQ). For example, in Nature, there is a discussion about low-energy buildings and their relation to carbon emission (Butler 2008) and in Science, about the relationships between healthiness and the environment (Holdren 2007). In addition, the building sector is the largest user of energy and CO2 emitter in the European Union (EU), with approximately 40% of the total consumption. Moreover, global warming has set in motion a trend for cutting energy costs to reduce the carbon footprint. As a result, reducing energy consumption, cutting greenhouse gas emissions and eliminating energy wastage are among the main goals of the EU. Improvements in the energy efficiency of buildings have led to a situation where modern homes are often more airtight than older ones and synthetic building materials have been used more (Jones 1999). Therefore, the occurrence of illnesses related to poor ventilation has driven growing attention towards the monitoring of indoor air quality. As a result, new low-cost sensors and signal processing technologies have been developed to measure indoor air quality (Zampolli et al. 2004). In recent years, increasingly reliable and flexible communication systems have been developed. The development of automation technology for buildings has led to the development of wireless sensor networks which do not need wired connections for communication. Despite the progress of wireless sensor networks, wireless communication inside buildings is still a challenge. Developing systems for continuously measuring and monitoring for example indoor air quality (IAQ), energy consumption, and the presence of occupants in buildings provides a good basis for creating intelligent and adaptive buildings. However, machine learning and computational methods are needed to compensate for 15
the changes in its environment and occupancy behavior because each house has its own unique heating, ventilation and air conditioning (HVAC) properties. This thesis focuses on a wireless building monitoring and control system, concrete IAQ measurements in buildings, intelligent data analysis, and the methods behind them. 1.2
Building automation and smart homes
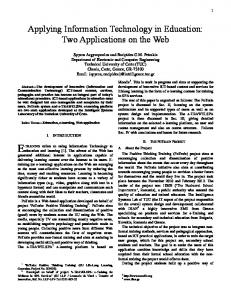
Building automation systems (BAS) are centralized, interlinked networks of software and hardware, offering advanced functionality that controls and monitors the living environment in a building (Figure 1). In the early 1990s, digital control (DC) and direct digital control (DDC) devices made it possible to build true automation systems (Kastner et al. 2005). Unfortunately, at that time, there were no standards for this digital communication and manufacturers created their own communication protocols. Movements towards open communication systems took place by the late 1990s and the American Society of Heating, Refrigerating and Air-conditioning Engineers (ASHRAE) developed the BACnet (for Building Automation and Control Networks) communication protocol, which became the open standard in the building industry (Kastner et al. 2005). BACnet is a non-proprietary and open protocol communications standard. The protocol can be applied widely in all kinds of systems found in buildings nowadays, for example HVAC, lightning, maintenance, and access control. Thanks to its design, it can use a wide range of network technologies for communication. Other interoperability protocols widely used today are LonWorks and Modbus. For the interoperability issue, LonWorks, developed by the Echelon Corporation in 1988, offers a different type of solution. At the core of this technology is a proprietary communications protocol called LonTalk. A communication protocol is a set of rules to manage communications within a network of cooperating devices (Snoonian 2003). Both protocols, BACnet and LonWorks, have been accepted and adopted by the international standard organizations (ANSI/CEA 709.1 and IEEE 1473-L). A third protocol, the Modbus, was developed by Modicon, Inc. during the 1970s for use in industrial automation systems. It is a truly open standard and supports serial and Ethernet protocols. Modbus is widely used in the industrial manufacturing environment (Tylman 2013). Each protocol has its advantages and disadvantages. Therefore, protocols must be selected based on the needs of the facility and its ability to support a particular protocol.
16
Management Trend logs
Cost allocation
Global strategies Lighting
HVAC
Automation and Control Fault detection
Intrusion Alarms
…
Comfort Security Safety Economy Access Control
Monitoring
Visualization
Safety Alarms Centralized manual intervention
Fig. 1. Functional aspects of building automation system (modified from Kastner et al. 2005).
Today’s BAS provides us with an enormous amount of data on actual building operation. Xiao and Fan (2014) used data mining in a building automation system to improve the operational performance of buildings. The results indicate that data mining is a useful and efficient tool to discover the knowledge underlying large BAS datasets. Data mining techniques can be integrated into a BAS and used for multiple purposes, including prediction, diagnosis, and optimization. The major issue for energy and control management in building automation is to stabilize the conflict between the total energy consumption and users’ comfort. Yang and Wang (2012) implemented multi-objective optimization methods in a multi-agent system to find the Pareto-optimal solutions. Simulation results are useful for balancing different conflicting design or control objectives in comfort management and complex building energy applications. Lehmann et al. (2013) used an approach based on model predictive control (MPC) to improve a building’s energy efficiency. It is a promising method to archive energy saving due to improved control. A little later, Meerbeek et al. (2014) studied motorized exterior blinds in Dutch offices. The results were interesting, as a large 17
majority of the occupants switched off the automatic mode of the blind system permanently. In addition, improvements were necessary to increase the acceptance of automated blind systems. The popularity of home automation (the residential extension of building automation) and smart homes has increased greatly in recent years due to much higher affordability and user friendliness through smartphones and their connectivity (Kovatsch et al. 2010). Smart homes have a strong connection to a concept called the “Internet of Things” (IoT). The term IoT is used as an umbrella keyword to cover several aspects related to extensions of the Internet and the Web into the physical world. Installing buildings with advanced IoT technologies may help by reducing for example heating and water consumption as well as improving the quality of life (Miorandi et al. 2012). Smart homes are residential buildings equipped with devices that communicate with each other using communication channels in order to achieve goals that benefit the end-users, their family members, caregivers, and their therapists and doctors (Ding et al. 2011). These goals are, for example, the management of energy consumption, home-based health care and assistance for elderly users (Jiang et al. 2004, Ricquebourg et al. 2006). In the near future, demand-side-load management will change the way people behave and use energy. Missaoui et al. (2014) analyzed a global model-based anticipative building energy management system that manages appliances such as heating and washing machines from a grid point of view. The application can find a compromise between the energy cost and users’ comfort, taking into account the occupants’ expectations and physical constraints, for example energy price and power limitations. Overall, the simulation results are promising, and the proposed algorithm reduced electricity costs by approximately 20%. 1.3
Indoor air quality
Since the early 1970s, research has been directed towards indoor air pollution (IAP) and its harmful health effects with increasing intensity (Samet et al. 1987, Pasanen et al. 1998, Wolkoff 2013). Research in this field was subsequently stimulated by the concerns that reduced ventilation of buildings for the purpose of energy conservation would increase pollutant concentrations and lead to harmful effects on health (Samet et al. 1987). In developed countries, people may spend approximately 65% of their time in residences (Leech et al. 2002, Brasche & Bischof 2005). Therefore, the 18
quality of indoor air is extremely important. The IAP sources worldwide can be categorized into three major pollutant types as follows (Smith & Mehta 2003): –
Organic and inorganic compounds (household products, building materials, combustion residues, fuel constituents, and tobacco combustion), – Particles (solid fuel, tobacco smoke, combustion particles, secondary organic aerosols), and – Biological particles (mouldy wood, vegetable matter, moisture damage in building structures, dirty ventilation systems). In HVAC systems, as well as emissions from building materials affects the IAQ parameters, including relative humidity, temperature, carbon dioxide, and volatile organic compounds (VOC). In recent years, the development of novel data logging units and effective processing of large databases has allowed the switching to continuous measurements, which are more reliable than single or short time measurements (Skön et al. 2012). The concentration of carbon dioxide in indoor air is commonly used as a surrogate for ventilation rate. A generally recommended level for CO2 in indoor air is below 1000 ppm, which is the limit set by the American Society of Heating, Refrigerating and Air-conditioning Engineers (ASHRAE) as a standard value (Škrjanc & Šubic 2014). However, it does not guarantee that the ventilation rate is in every situation adequate. CO2 concentration is regarded as indicator for the efficiency of the ventilation rate. Maintaining a CO2 concentration of below 1000 ppm usually leads to acceptable air quality with respect to body odors (Apte et al. 2000). The Finnish guideline value for indoor temperature is 21°C and respectively, for relative humidity it is 20-60% during the heating season (Sosiaali- ja terveysministeriö 2003). VOCs originate for example from water, plasticizers, paints, and personal care products (Samet et al. 1987). At the moment, there are no standards for VOCs in nonindustrial settings. Approximately half of the studies concerning non-residential and non-industrial buildings suggest that the risk of sick building syndrome (SBS) symptoms decreased significantly when ventilation rates were increased so that CO2 concentrations in indoor air were reduced below 800 ppm (Seppänen et al. 1999). SBS consists of a group of mucosal, skin, and general symptoms. The most common symptom is the sensation of a stuffy or blocked nose (Burge 2004). Increasing symptoms related to temperatures above 23°C have been one of the findings in northern European studies (Jaakkola & Heinonen 1989, Skov & Valbjorn 1989). However, there is an 19
association between increasing temperature, inadequate ventilation and overcrowding which makes it difficult to define the causative factor. Naturally, the humidity of indoor air is dependent on the outdoor climate and for example, in parts of Scandinavia, the humidity may be below 10% during the heating season. There is some evidence that increasing the humidity of indoor air to around 25% is associated with a decrease in symptoms (Reinikainen et al. 1990). 1.4
Computational intelligence
When dealing with big data or smaller datasets, it is common to have no clue or idea what you are looking for. Illustratively, the situation can be compared to finding a needle in a haystack. Computational methods provide useful information for this. The term computational intelligence was first introduced by Bezdek in 1994. According to Bezdek, computational intelligence can be defined as follows: “… A system is computationally intelligent when it: deals with only numerical (low-level) data, has a pattern recognition component, does not use knowledge AI sense; and additionally when it (begins to) exhibit (i) computational adaptivity; (ii) computational fault tolerance; (iii) speed approaching human-like turnaround, and (iv) error rates that approximate human performance” Computational intelligence aims to use adaptive, learning, or evolutionary computation to create intelligent programs, at least in some sense. The methods used commonly include neural networks, evolutionary programming, or fuzzy systems (Lu et al. 2007). Computational intelligent methods have been applied to numerous eservices, for example personal e-banking, one-stop e-shopping, online sport services and online user behavior analysis, giving benefits to online customers (Lu et al. 2007). 1.5
Data mining
Data mining is a part of the knowledge discovery process, comprising several steps to handle a lot of data. Data mining can be regarded as consisting of description and summarization, descriptive modeling, predictive modeling (classification and regression), discovering patterns and rules or retrieving similar objects (Hand et al. 2001). Fayyad et al. (1996) presented a non-trivial process called knowledge discovery from data (KDD) for identifying valid, novel, potentially useful and 20
ultimately understandable patterns in data. Data mining is the central activity in the process of KDD concerned with applying computational methods to actually find patterns in data. The other phases in the KDD process are concerned with preparing data for data mining, as well as evaluating the discovered patterns (Figure 2). Data acquisition and storage
Defined problem
Selected data
Problem identification
Data pre-processing
Pre-processed data
Applications
Data mining Knowledge
Patterns, predictions, visualization
Knowledge deployment Evaluations / conclusions
Fig. 2. Overview of the knowledge discovery from data (KDD) process (modified from Fayyad et al. 1996).
1.6
Research problem
This thesis discusses continuous indoor air quality measurements starting at system development and moving to the challenges related to continuous measurements and data analysis together with the technology behind them. In addition, in this thesis the selected indoor air parameters used are temperature, relative humidity, carbon dioxide, and volatile organic compounds, because these parameters can be measured continuously at reasonable cost. The problem is basically three-fold. The first problem is which indoor air quality parameters should be measured and where to measure them. The second problem is how to measure indoor air quality parameters reliably at 21
low cost, especially in existing buildings. The last, but not least, problem is how to use and interpret the results from indoor air quality measurements. Most people spend the majority of their lives indoors and many health problems have been linked to indoor air quality. Therefore, the cost-effective continuous monitoring of indoor air quality is important, especially in existing buildings. Many factors have set challenges for continuous measurements, for example, the costs of measuring equipment, system installation, and maintenance. In addition, analyzing a large amount of measurement data brings its own challenges. The importance of developing systems for the continuous measuring and monitoring of indoor air quality (IAQ), energy consumption, and presence of occupants in buildings provides a good basis for creating intelligent, adaptive buildings in the near future. 1.7
Aims of the thesis
The main aims of this thesis are to study and develop a wireless building monitoring and control system, study the challenges of measurement and wireless data transmission in buildings, analyze the measured data using intelligent computational methods and present the technology behind them. The technology developed in this thesis relies heavily on BAS and in some parts on the concept of IoT. An additional aim is to encourage researchers and companies to use data to develop new innovative products, for example, data-driven soft sensors to measure indoor air quality. Furthermore, the focus is on the applications of intelligent computational methods, rather than on the theoretical issues of algorithms behind these methods. 1.8
The author’s contribution
The publications of this thesis originate from several research projects carried out mainly in the Department of Environmental Science, University of Eastern Finland (formerly the University of Kuopio) during 2009-2013. The author has had a major role in each publication. The author’s contribution in each publication is explained below. In Paper I, the author was responsible for innovating an end-user interface, and carried out the writing process and was responsible for writing the paper. Okko Kauhanen coded the end-user interface and gave assistance in the writing process. Mikko Kolehmainen’s role was supervisory. 22
In Paper II, the author created the data processing core and carried out parts of the numerical computations and writing, while Markus Johansson gave assistance with the numerical calculations. Mika Raatikainen assisted with the writing process. The work was done under the supervision of Ulla-Haverinen-Shaughnessy, Pertti Pasanen, Kauko Leiviskä, and Mikko Kolehmainen. In Paper III, the author was responsible for selecting, innovating and implementing the model. The author designed and conducted mainly the model computations and statistical evaluating of the model. The author analyzed the results jointly with the co-authors and was responsible for writing the paper. Markus Johansson gave assistance with the numerical calculations. Mika Raatikainen assisted in writing the paper. The role of Kauko Leiviskä and Mikko Kolehmainen was supervisory. In Paper IV, the author performed the data analysis and analyzed the results jointly with the co-authors. The author was responsible for writing the paper. Mika Raatikainen and Markus Johansson gave assistance in writing the paper. The role of Kauko Leiviskä and Mikko Kolehmainen was supervisory. In Paper V, the author was responsible for writing the paper together with Mauno Rönkkö. Mika Raatikainen gave assistance in writing the paper. The role of Martti Juhola, Kary Främling, and Mikko Kolehmainen had a supervisory role. 1.9
The structure of the thesis
Chapter 1 presents an introduction to the study, the aims of the studies, the author’s contribution and the structure of the thesis. Chapter 2 explains the idea of the monitoring system and challenges related to indoor measurements and presents the data used in this study. Chapter 3 introduces the data pre-processing phases, the main computational methods, and the model validation methods used in this thesis. Next, the main results achieved are presented in Chapter 4. Discussion and ideas for future work are presented in Chapter 5. Finally, conclusions are presented in Chapter 6.
23
24
2
Monitoring system, environment, and data
2.1
Overview
In 2009, an environmental informatics research group started to develop a costeffective energy consumption and indoor air quality monitoring system to research the effects of energy efficient construction on indoor air quality. This system is described in Paper I. The main components and features of a wireless building monitoring and control system are presented in Figure 3, which is the next development version of an earlier energy consumption and indoor air quality monitoring system presented at the Kuopio Housing Fair in 2010. Skön et al. (2012) presents more information on this wireless building monitoring and control system.
IAQ MEASUREMENTS
SENSOR NETWORK SENSOR 1
DATA TRANSFER UNIT CONTROL
SENSOR 2
BUILDING AUTOMATION DEVICES
CONSUMPTION MEASUREMENTS
SENSOR n
ELECTRICITY WATER HEAT
INTERNET USER INTERFACE
MONITORING SERVICES
Data analysis, user views, ...
Fig. 3. Overview of monitoring and control system (Reprinted with permission from Scientific Cooperations).
The new version is based mostly on commercial products and their integration. Common features of the developed monitoring system are: – – –
a data transfer unit for networking and management over the Internet, the possibility to connect a wide range of sensors to the system, data transfer from sensors to the data transfer unit can be carried out in a wired or wireless way, 25
– –
2.2
low installation costs, and the possibility to control building automation devices using the Modbus protocol. Measurements
The measuring equipment consists of sensors, which are used to measure indoor and outdoor air quality and energy consumption (Table 1). Sensors are wirelessly or wired (not often used) connected to a data transfer unit. Wireless data transfer is carried out using ZigBee technology owing to its good features, for example ultra-low power consumption and easy installation. In more detail, ZigBee is a wireless technology developed as an open global standard to address the unique needs of low-cost, lowpower wireless machine-to-machine (M2M) networks. The ZigBee standard operates on the IEEE 802.15.4 physical radio specification and in unlicensed bands including 2.4 GHz, 900 MHz, and 868 MHz. Table 1. Examples of sensors connected to the monitoring system. Manufacturer and model
Parameter/Specification
Unit
Temperature, relative humidity
°C, %, ppm
Indoor sensors E+E Elektronik G.m.b.H., EE80
and carbon dioxide Tongdy Control Technology Co.,
Carbon monoxide
ppm
Volatile organic compounds
ppm
Dwyer Instruments Inc., Dwyer
Differential pressure across the
Pa
MS-221
building envelope
Ltd., F2000TSM-CO-C101 Tongdy Control Technology Co., Ltd., TSM-VOC-L100
IR-TEC International Ltd., OS-550 Occupancy sensor
Form C (Nc/No)
Kamstrup A/S, Multical® 601
l, kWh, kWh
Water, heat and electricity consumption
Aktif Enerji Insaat Sanayive
Heat and electricity consumption
kWh, kWh
Temperature, relative humidity,
°C, %, Pa, m/s, °, mm
Ticaret Ltd., Co., BSC1111 Outdoor sensors Vaisala Ltd., WXT520
barometric pressure, wind speed, wind direction, rainfall E+E Elektronik G.m.b.H., EE21FT3A26/T02
26
Temperature and relative humidity °C, %
The environmental informatics research group has developed two radio adapter cards to connect sensors to the ZigBee radio transceiver: for voltage output sensors and pulse output sensors. Usually, the voltage range is from 0V to 10V, and a maximum of four sensors can be connected to one ZigBee radio transceiver (Digi International Inc., XBee PRO S2B). In the case of the pulse output sensor, the radio adapter card includes a micro-controller, which calculates the sum of the pulses, and it is connected to the ZigBee radio serial port. In addition, a single radio adapter card is able to read pulses from three different channels. 2.3
Data transfer unit
Data collection, pre-processing, and transfer via the Internet were carried out using ConnectPort X4 (Digi International Inc.). Its custom-made software has been developed in research projects carried out by the environmental informatics research group. In addition, the developed software allows the use of measurements for control purposes, for example to modify the control curve for heating regulators. The data transfer unit can be connected to the Internet either wirelessly via a 3G connection or by Ethernet. The server collects the measurements from the data transfer unit and saves them in a database. The end users can view the measurements using a web application. 2.4
Challenges in indoor measurements
Wireless or wired indoor measurements are challenging in multiple ways. In our measurements, we used ZigBee networks for data transfer in sensor networks. The following facts support the choice of the selected technology. The ZigBee network uses 16-bit node addressing, which theoretically allows nearly 216 devices on the same network and the use of mesh network topology (ZigBee Alliance 2014). ZigBee utilizes the globally used 2.4 GHz frequency band in data transmission. Therefore, radios are low priced and easily available. The following measurement challenges and experiments that were gathered are related to wireless sensor networks (WSN), sensors and sampling frequency based on our own experience.
27
2.4.1 Wireless sensor networks In the schools and apartment houses studied, distances from the data transfer unit (ZigBee coordinator) to the sensor nodes (ZigBee routers) are in the range of 10 to 40 meters. We have noticed that, in some cases, the radio range is not enough even though the sensor is about 10 meters from the coordinator. Often, these types of data transmission problems occur in cases where the sensor or sensors are installed on a different floor than the data transfer unit. This can be explained by the frequency band. Since the ZigBee technology uses the 2.4 GHz frequency band, metal tubes, cables, and reinforced concrete in the wall and floors for instance can easily cause reflection even though the distance is very short. In addition, we have noticed that people can cause the attenuation of the radio signal. This is reflected in the missing measurement values during working hours. Overall, based on our expertise and previous research done by Paavola (2011), ZigBee technology is well suited to indoor data transmission in sensor networks, as long as the sensors are not far away from each other or the network nodes are placed in a such way that the mesh network would work well. Of course, this is not always possible due to furnishing and decoration. If the distances between network nodes are long, it would be better to use different communication technology such as 433 or 868 MHz frequency band radios. 2.4.2 Sensors In long-term measurements or if the measurement sensor is not ideal, several types of deviations can be observed, for example noise (random deviation of the signal varying in time), long-term drift (a slow degradation of sensor properties), and sensitivity (specified value may differ in practice). 2.4.3 Sampling frequency It is important to choose the right measurement frequency due to two facts: information accumulates in the database and, in the end, it will be full. Secondly, different measurements require diverse measurement frequencies, for example changes in temperature appear slower than the fluctuations in electricity consumption.
28
2.5
Indoor air quality data
The indoor air quality data from schools and apartment houses include 2 859 507 rows with 242 variables in columns. The measured variables are presented in Table 2. Table 2. The variables of the indoor air quality data. Building type
Variable
Data inputs
Residential house 1
Temperature
10
Residential house 2
School 1
School 2
School 3
School 4
School 5
School 6
School 7
School 8
Relative humidity
10
Carbon dioxide
10
Temperature
10
Relative humidity
10
Carbon dioxide
10
Temperature
5
Relative humidity
5
Carbon dioxide
5
Total volatile organic compounds
1
Temperature
5
Relative humidity
5
Carbon dioxide
5
Total volatile organic compounds
1
Temperature
5
Relative humidity
5
Carbon dioxide
5
Total volatile organic compounds
2
Temperature
5
Relative humidity
5
Carbon dioxide
5
Total volatile organic compounds
1
Temperature
5
Relative humidity
5
Carbon dioxide
5
Total volatile organic compounds
2
Temperature
7
Relative humidity
7
Carbon dioxide
7
Total volatile organic compounds
2
Temperature
5
Relative humidity
5
Carbon dioxide
5
Total volatile organic compounds
2
Temperature
5
29
Building type
School 9
School 10
2.6
Variable
Data inputs
Relative humidity
5
Carbon dioxide
5
Total volatile organic compounds
1
Temperature
5
Relative humidity
5
Carbon dioxide
5
Total volatile organic compounds
2
Temperature
5
Relative humidity
5
Carbon dioxide
5
Total volatile organic compounds
2
Development directions
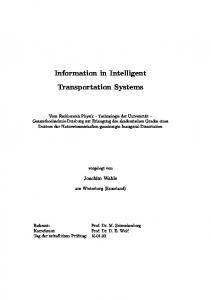
Paper V presents a unique idea for creating a state-of-the-art adaptive building automation system. The key factor is to enhance low-cost technologies using machine learning and computational intelligence. Nonetheless, as each house or building has its own unique HVAC properties, the methods developed for learning need to be interoperable and adaptive. Moreover, to compensate for the joint effects of changes in the housing environment and occupancy behaviors, the methods need to empower co-learning processes. In general terms, co-learning is a situation in which two or more people learn or attempt to learn something together (Dillenbourg 1999). Colearning is unavoidable, when external stimuli such as the climate change also cause changes in lifestyle. Combining all this technology and related measurement data would provide a unique opportunity to evaluate factors and costs over a whole life cycle. In addition, this would also facilitate the measurement-based sustainability analysis that is critical for validating and refining current sustainability models. Figure 4 depicts these factors for co-learning in the context of the Adaptive House. To summarize, the proposed idea requires at minimum the following steps to achieve the expected results: – –
– 30
the development of detection and classification methods in the context of machine learning, research on novel, reusable methods for low-cost home automation. In particular, the methods developed have to support co-learning processes and sustainability assessment, research on the theoretical foundations for novel, co-learning aware computational intelligence. The goal is to merge previously gained
–
–
expertise on complex systems, emergent dynamics, and formal methods to support co-learning processes in computational methods, such as data mining, inductive learning, and fuzzy control, development and validation of models utilizing measurement data coming from the existing living labs for life-cycle and health impact assessment, and validation of the developed methods in a real-life demonstration.
Fig. 4. Factors for co-learning in the Adaptive House (Reprinted with permission from Scientific Cooperations).
31
32
3
Data pre-processing, computational methods, and model validation
3.1
Data pre-processing
Proper data pre-processing is an important step in data analysis and it cannot be carried out blindly or completely automated due to the fact that the connection between the expected phenomenon and measurements is not always clear (Pyle 1999). Han & Kamper (2000) present the procedures for data pre-processing that are typically as follows: –
data cleaning (filling the missing values, smoothing noisy data, identifying outliers, and correction of inconsistencies), – data integration (the merging of data from multiple datasets), – data transformation (smoothing, aggregation, generalization, normalization, and attribute construction), and – data reduction (dimensionality reduction, numerosity reduction, and discretization). In addition, descriptive data summarization can be used in providing analytical information for data pre-processing. Descriptive data summarization was used widely in Paper IV to assess indoor air quality in school buildings. Furthermore, for example in dimension reduction, features can be extracted from the data, providing further information for some particular context (described in more detail in the next chapter). Although numerous methods have been developed for data pre-processing, the research area is still active due to the large amount of inconsistent data and the complexity of the problem (Han & Kamper 2000). Different data pre-processing methods were used in this thesis. In Papers II, III, and IV, data cleaning was used. This meant the identification of outliers or measurement errors and their removal. In addition, in Papers II and III, data transformation was made using variance scaling. In variance scaling, the data vectors are linearly scaled to have a variance equal to one, as follows: =
̅
,
≠ 0,
(1)
where ̅ is the average of values in vector and denotes the standard deviation of those values. Variance scaling equalizes the effect caused by variables having a different range in the data. Also, it reduces the effect of possible outliers in the data. 33
Due to the large amount of data and limited computing power, data reduction is usually one of the aims in data pre-processing. In this thesis, instance selection was applied in indoor air quality data (Paper III). As a result, randomly selected training and validation sets were used in the modeling phase. In addition, value discretization was applied in Paper II, and histograms were used to present CO2 variable distributions in the discovered clusters. Also, in Paper II, a self-organizing map (SOM) was used in data size reduction before clustering with the K-means algorithm. 3.2
Feature extraction and variable selection
The selection of a feature extraction method or methods is an important factor in achieving high modeling performance. A large number of feature extraction methods are reported in the literature (Trier et al. 1996). In Paper III, nine features were extracted from the indoor air quality data (temperature, relative humidity, and carbon dioxide) measured every ten seconds using a time window of one hour. The extracted features were minimum, maximum, kurtosis, skewness, standard deviation, average, median, root mean square, and sum. The definitions for each feature are described in Paper III. Minimum, maximum, standard deviation, average, root mean square, and sum are simple, useful, and commonly used features. Skewness is a measure of symmetry in the distribution of indoor air quality data and the value of skewness can be positive, negative, or even undefined. Respectively, kurtosis is a descriptor of the shape of a probability distribution. It measures how much a distribution is peaked at the center of distribution (Kim 2013). As in feature selection, choosing the most relevant variables is one of the main problems in modeling. The main aim is to select variables that describe the modeling problem adequately and fulfill the accuracy requirements. Especially, in data-driven models, the selection of the correct input variables to present a modeling problem is one of the main issues. Noisy or irrelevant input variables may disturb the training process and lead to a complex model structure and poor generalization power. In addition, the omission of relevant input variables leads to an inaccurate model, where part of the output behavior remains unexplained by the selected input variables. Consequently, many linear or nonlinear variable selection algorithms have been developed for variable selection. For example, there are methods based on correlation analysis and genetic algorithms (Guyon & Elisseeff 2003). In Paper III, correlation analysis was used to select input variables for the multilayer perceptron (MLP) model because it is fast and efficient. In addition, Niska 34
et al. (2006) have shown that moderately good results can be achieved by applying correlation analysis to variable selection compared with other more sophisticated and intelligent methods such as sensitivity analysis and genetic algorithms. 3.3
Computational methods
The general aims of the study have served as a basis when selecting the computational methods for the analysis of indoor air quality data. As a rule of thumb, the selection of methods proceeds as follows: generic, robust, and nonlinear methods have been selected for the analysis. Also, another important criterion for choosing the computational methods is the computation time, which must remain reasonable. Algorithm and parameter selection used by each method has been done using standard methods; no large-scale parameter optimization processes have been performed. The self-organizing maps (SOM) are an ideal method to be used in the early stages of data analysis because they provide a projection upon which different kinds of data properties can be shown (Vesanto 2002). The SOM is efficient for visualizing dependencies and interrelation between variables of high-dimensional data (Laine 2003). K-means was selected for the clustering method of SOM, because it is simple, widely used, and easy to implement. Nowadays, multilayer perceptron (MLP) is widely used in different applications including air quality forecasting (Feng et al. 2015, Hoi et al. 2013) and it can be considered as a standard neural network. When combined with a back-propagation algorithm, MLP is a highly effective method computationally (Haykin 2009). For these reasons, SOM, MLP and K-means methods have been selected for indoor air quality data analysis. Other widely used artificial neural networks (ANN) are, for example a support vector machine (SVM), radial basis function networks (RBFN), and learning vector quantization (LVQ), but they are not discussed in this dissertation. The methodological basis for self-organizing maps (SOM), multilayer perceptron (MLP) network and K-means clustering studied in this thesis is given in the following section. 3.3.1 Self-organizing maps The self-organizing map (SOM) is one of the best-known unsupervised neural learning algorithms, developed by Teuvo Kohonen in the early 1980s. Its common purpose is to find the prototype vectors that represent the input dataset and at the same time realize a continuous mapping from an input space to a lattice. In this lattice, the 35
input vectors with common features result in the same or neighboring neurons, preserving the topological order of the original data. The common application fields of SOM have been, for example exploratory data analysis and pattern recognition (Kohonen 2001). The SOM learning is initiated by assigning random values to the weight vectors (also called reference or prototype vectors) of the network. The weight vector can be defined as follows: =
,
,…,
,
(2)
where is the weight vector, m refers to the index of the neuron, and p is the number of variables. At the beginning of training, the SOM is initialized. In linear initialization, the SOM is initialized linearly along the dimensions of the map, with respect to the greatest eigenvectors of training data. In random initialization, the map is initialized using arbitrary values for weight vectors. In the original incremental SOM, input vectors are presented to the algorithm one-by-one in a random order. The best matching unit (BMU) is the neuron with the smallest Euclidean distance to the input vector: ( ,
)=
min
−
,
(3)
is the input vector, and includes all weight where c is the index of BMU, vectors. The BMU and a group of its neighboring neurons are then trained according to the following update rule: ( + 1) =
( )+ℎ
( )
( ),
−
(4)
where is the weight vector, m is the index for the neuron updated, t is the iteration round, and h is the neighborhood function. A widely used neighborhood function is the Gaussian function: ℎ
( )= ( )
‖
‖ ( )
,
(5)
symbolize the location vectors of two where ( ) is the learning rate factor, and neurons, and ( ) defines the width of the kernel. In summary, the training of SOM includes the following steps: i. initialize the map, ii. find the BMU of the input vector using the Euclidean distance (Equation 3), 36
iii. move the weight vector of the BMU towards the input vector (Equation 4), iv. move the weight vectors of the neighboring neurons, according to the neighborhood function (Equation 5), towards that input vector, using the update rule (Equation 4), v. repeat steps (ii)-(iv) for all input vectors successively, vi. repeat steps (ii)-(v) until the algorithm converges, and vii. find the final BMUs for the input vectors (Equation 3). In Paper II, the SOM was used to cluster indoor air quality data to research quality variations in indoor air. The training data for SOM contained 30 variance scaled inputs. A SOM was constructed having 100 neurons in a 10 x 10 hexagonal grid. Linear initialization and batch training were used in the training of the map. The Gaussian function was used as the neighborhood function. The map was taught with 10 epochs and the initial neighborhood had a value of 6. More detailed information about constructing the SOM is presented in Paper II. 3.3.2 Multilayer perceptron A multilayer perceptron (MLP) is the most commonly used feed-forward network. MLP networks are usually applied in supervised learning problems, having a number of applications for prediction, classification, and function approximation. The MLP network consists of processing elements, known as neurons or nodes, and connections (Haykin 1999). The processing elements are arranged into an input layer, hidden layer(s) and output layer. The input layer distributes input signals to the hidden layer. Neurons in the hidden layer sum its input, handle it with a transfer function and distribute the result to the next layer, which is typically an output layer or in the case of several hidden layers, to the next hidden layer. The units in the output layer compute their output similarly. Typically, the sigmoid transfer function is used in the hidden layer and the linear transfer function in the output layer when modeling a continuous function. The architecture of a multilayer perceptron with two hidden layers is presented in Figure 5.
37
Fig. 5. The structure of a multilayer perceptron with two hidden layers (modified from Haykin 1999).
The back-propagation algorithm (also called the generalized Widrow-Hoff delta rule) is often used in the supervised learning of an MLP network. Basically, backpropagation learning consists of two steps: a forward pass and a backward pass. In the forward pass, the predicted outputs corresponding to given inputs are calculated. Next, the difference between the predicted and known output is calculated. This error signal is then propagated backwards in the network by calculating the local gradients of the neurons and adjusting each weight value according to the local gradient and the current signal value. Thereafter, the network weights can be adapted using any gradient-based optimization algorithm. However, major problems associated with the basic back-propagation algorithm are slowness in learning, poor generalization ability, and local minima. In Paper III, an MLP network was used to predict CO2 concentration in ten rooms. The MLP model was built up using extracted features on indoor air measurements of relative humidity and temperature. 3.3.3 K-means clustering K-means clustering (MacQueen 1967) is a well-known non-hierarchical clustering algorithm based on the calculation of squared errors and is one of the most popular methods for clustering, because it is simple, fast, and easy to implement. K-means 38
was applied in Paper II to the clustering of the self-organizing map weight vectors. The basic version begins by randomly picking k cluster centers, assigning each point to the cluster whose mean is closest in the sense of Euclidean distance, which was used as a similarity measure. The next steps involve computing the mean vectors of the points assigned to each cluster, and using these as a new cluster in an iterative approach until the convergence criterion is met. The algorithm aims to minimize the following objective function: =∑
( )
∑
−
,
(6) ( )
( )
− is a chosen distance measure between a data point and the where cluster center , is an indicator of the distance of the data points from their respective cluster centers. In the K-means algorithm, the number of clusters has to be predefined, and depending on the case specific application, the number of clusters may not be known a priori. The optimal number of clusters can be determined using the Davies-Bouldin index (Davies & Bouldin 1979): = ∑
max ,
,
(7)
where k is the number of clusters, is the average distance of the input vectors associated with cluster i to the center of that cluster, is that of the input vectors associated with cluster j, and denotes the distance between clusters i and j. As a result, the Equation 7 shows that a small values of the DB-index correspond to clusters the centers of which are far from each other. The optimal value of clusters is indicated by the minimum value of the index. The Davies-Bouldin index was used in Paper II to solve the optimal number of clusters. The DB-index was calculated 15 times and the mean value of the index was used when selecting the optimal number of clusters. This is due to the fact that the DB-index varies a little between calculations because the initial starting point is set randomly. 3.4
Model evaluation
The evaluation of the model is an essential part of the model development process. Concerning computational models, model evaluation helps to find the best model that represents the data and it ensures for example, that the model is programmed and implemented properly. In data mining, evaluating model performance with the data used for training is not acceptable because it easily leads to over-optimistic and over39
fitted models. In generally, over-fitted models have a poor predictive performance. To avoid overfitting, validation uses a test set of data that the data mining algorithm was not trained on (Hawkins 2004). There are two methods of evaluating models in data mining: hold-out and cross-validation. In the hold-out method, the dataset is randomly divided into three subsets: – –
–
the training set is a subset of the dataset for building models, the validation set is a subset of the dataset used to evaluate the performance of the model built in the training phase. It is used to finetune the parameters of the model and to prevent overfitting, and the test set is a subset of the dataset to assess the performance of a model. If model performance is much better in the validation set than in the test set, overfitting is probably the reason.
K-fold cross-validation (leave many out (LMO) and leave one out (LOO)) is commonly used validation method for regression models (Snee 1977, Michaelsen 1987). In the LMO method, the dataset is divided into k subsets of equal size. Models are built k times, each time leaving out one of the subsets from training and using it as the test set. If k equals the sample size, the method is then called leave one out (LOO). The LOO method is used when only a limited amount of data is available. The hold-out and LMO methods are commonly used in the case of large datasets. Several statistical measures have been presented to provide a numerical description of the “goodness” of the model (Willmott 1981, Willmott et al. 1985). Basically, the validation statistics are based on the calculation of validation error e, which is the difference between the observed data point and the predicted data point for data lines , … , in the validation set: =
−
.
(8)
The coefficient of determination (R2) is the most common statistical measure and indicates how much of the observed variance is accounted for by the model. R2 can be written as follows: ∑
=1−∑
(
)
(
)
,
(9)
where is the observed mean of the variable. The index of agreement (IA) is easily understandable and gives a relative and dimensionless measure of the model accuracy limited to range 0-1. Value 1 indicates 40
a perfect fit between the observed and predicted data. It is ideal for making a crosscomparison between models. The index of agreement can be calculated as follows: =1−
∑ ∑
| |
(|
|)
.
(10)
The root mean square error (RMSE) is also a common performance indicator and indicates how much of the variability in the variable observed is accounted for by the prediction. It can be divided into its systematic (RMSEs) and unsystematic (RMSEu) components using a least-squares estimate of the predicted data point. The RMSE can be calculated using the following equation: =
∑
.
(11)
In Paper III, predictive modeling using an MLP network was used. For this approach, the dataset was divided into training and validation sets. The goodness of the models was evaluated using K-fold cross-validation to calculate the performance indicators R2, IA, and RMSE on each of the MLP models built.
41
42
4
Results of the data analysis
4.1
Problem identification
Problem identification is the first task of the KDD process and it starts by identifying the right problems to solve (Pyle 1999). This is not as easy as it seems and problem identification should give answers to questions, for example why this kind of data analysis has to be done and who the new monitoring service is intended for (Veryzer 1998). Also, it is very important to understand the needs of potential customers or end-users. This can be said to be probably the most important factor in the development of a new product (Karol & Nelson 2007). In this thesis, data mining was applied in Papers I-IV to analyze and utilize measured data. For each of these cases, problem identification was carried out at the beginning of the project. This work consisted of a questionnaire to survey the desired properties for the end-user interface to be developed, meetings, discussions, and of course documentation of these issues. In Paper V, a twofold research problem is identified and operations are presented for achieving the proposed goal. Descriptions of the main problems of each of Papers I-V are presented in the following paragraphs. Developing a new system to monitor energy consumption and air quality is challenging in many ways (Paper I). Thus, the main problems were identified as follows: The system developed has to complete existing monitoring systems, it has to be cost-effective and real-time and the end-user interface has to be simple, sufficiently novel, and innovative. The identified problems are very common when developing anything new. Paper II focused on continuous indoor air quality measurements and data analysis of a six-floor apartment building (built in the 80’s). This building is equipped with mechanical exhaust ventilation, which was a very common ventilation system in buildings of that time. The ventilation system might cause problems with indoor air quality. Therefore, the problem can be defined as follows: The large amount of data has to be analyzed effectively and reveal dependencies between data variables to analyze events and anomalies in indoor air quality. Carbon dioxide (CO2) is a very good indicator for indoor air quality. On the other hand, measuring CO2 is expensive compared to measurement of temperature and relative humidity (Paper III). In addition, the power consumption in CO2 sensors is high and this leads to short operating times when using battery-powered sensors. Thus, the following problem was raised and defined: Is it possible to build up a 43
reliable and generalizable prediction model using temperature and relative humidity measurements as input variables to predict CO2 concentrations and utilize it for the development of a soft sensor? Many reasons have led to more energy efficient construction or improvements in energy performance in buildings. Therefore, adequate ventilation and continuous measuring of indoor air quality are very important. In addition, in Western Europe people may be exposed indoor air for up to 20 hours per day. As a result, in school buildings, students especially are at risk of health problems caused by poor indoor air quality. From this point of view, the problem was identified in Paper IV as follows: Is the indoor air quality adequate in the ten schools studied and what kind of challenges are related to continuous indoor air quality measurements in different environments? This problem has partly led to research of two schools in more detail, because their ventilation systems are similar, but the average number of students in the classrooms differs. Paper V describes the needs of a new kind of building automation system improving real-time housing energy efficiency, healthiness, safety and security, as well as comfort, considering the residents’ lifestyle. Combined with that, the following problems were identified: Healthy and sustainable housing requires interdisciplinary state-of-the-art know-how. In more detail, the research requires expertise starting from measurement device technologies, including reliability and quality aspects, to computational methods for indicator mining and machine learning to be used in home automation appliances, reaching finally aspects of health monitoring and diagnosis of occupants. The presented problems are a good starting point for applying data mining to develop of new computational solutions, monitoring systems and services to serve end-users, different stakeholders, and produce new business opportunities. 4.2
Data acquisition and storage
Data acquisition has a major role in the KDD process and requires skills in database management, data manipulation, and data integration. In the online information services, automated and continuous data acquisition is required. In Papers I-IV, the measuring equipment consists of sensors attached to a data transfer unit. Relative humidity, temperature, and carbon dioxide are measured with a single sensor. TVOC concentrations are measured with a separate sensor. Sensors were installed approximately 1.4-1.8 meters above the floor and far from ventilation ducts and the vicinity of windows and doorways. The data transfer units’ custom-made software 44
was developed at the University of Eastern Finland. The data transfer unit is connected to the Internet either wirelessly via 3G-connection or by Ethernet. The server collects the measurements from the data transfer unit and saves them in a database having specific identification keys, for example a timestamp, sensor ID, and the location of measurement. Before the storage process, the voltage signal is converted to actual measurement units, for example 2V to 20° C for indoor air temperature. The end-users, for example the residents, can view the measurements through the Silverlight client, which is partially described in chapters 4.4 and 4.5. 4.3
Data pre-processing
Data pre-processing is an important phase in the KDD process. It describes all types of processing done on raw data to prepare it for any other processing procedure. Data pre-processing includes procedures such as data cleaning, integration, transformation, and reduction. The data presented via the end-user interface were cleaned of outliers and smoothed using the moving average method to ensure a visually clearer presentation (Paper I). The server database contained the original data from sensor. In Paper II, data for analysing events and anomalies in indoor air quality using self-organizing maps and the raw indoor air quality data were pre-processed for data analysis. This means data cleaning (removing outliers or missing values) and transformation (variance scaling the data). After these pre-processing tasks, the data were in the proper format. When modeling the carbon dioxide (CO2) concentration in indoor air using a neural network in Paper III, data pre-processing proceeded as follows. First, data were cleaned of outliers and missing values. Then, the data were transformed using the variance scaling method and finally, data reduction was made by extracting the features using a time window of one hour. After these pre-processing tasks, the data were in the proper format consisting of timestamps, room ID’s, and extracted features for modeling carbon dioxide (CO2) concentration. Data for assessing correlations of indoor air quality measurements and variations in school buildings (Paper IV) were cleaned of outliers (for example measurement errors) and transformed to the hourly level, because the changes in indoor air quality occur slowly.
45
4.4
Data mining
The essential part of the KDD process is extracting patterns from data and finding unknown dependencies between different variables. These tasks are executed by applying selected computational methods to the data and interpreting the results. In this thesis, data mining tasks focused on the use of unsupervised clustering and regression methods for the intelligent analysis of indoor air quality data. In more detail, a clustering method was used as a data compression tool to reduce the dimensionality of the data and a regression method was used to predict the future behavior of the phenomena. The energy consumption and air quality monitoring system was described in Paper I. The front page of the Silverlight client has meters that show the consumption of water, heating, and electricity for the most recent week and month (Figure 6).
Fig. 6. Overview of consumption meters. The consumption profiles are calculated from the historical data of water, electricity and heating consumption measurements of the building. Normal consumption levels are denoted by 0% (Reprinted with permission from the Institute of Electrical and Electronics Engineers).
Each building has a set of load profiles associated with it, which gives the expected consumption for normal circumstances. The readings of the front page meters were obtained by comparing the measured consumption to the predictions given by the profiles. The load profiles were calculated from historical water, 46
electricity, and heating consumption measurements of the building or from consumption data of similar buildings. In addition, the load profiles were constructed by fitting weighted multiples of sine and cosine curves to historical consumption time series data. If outdoor temperature measurements were available, temperature correction coefficients were calculated for the consumption variables. These coefficients were used to remove the influence of the outside temperature from the time series. For example, if a house is electrically heated, electricity consumption is highly dependent on the outside temperature. It was necessary to apply temperature correction to obtain a reliable comparison between the current consumption and the profile. In Paper II, indoor air quality data were analyzed by applying an SOM method, which produces a continuous two- or three-dimensional mapping from a multidimensional input space. The research was conducted in a six floor apartment building (built in the 80’s) located in Kuopio, Finland, from January to May 2011. The IAQ data were collected continuously in 6 apartments from 10 rooms on the 2nd and 6th floors, using the energy consumption and air quality monitoring system presented in Paper I. The collected data were coded into inputs for the SOM and all the input values were normalized by variance scaling before training the map. An SOM consisting of 100 neurons in a 10 x 10 hexagonal grid was constructed. The linear initialization and batch training algorithm were used in the training of the map. The map was taught with 10 rounds. The Gaussian function was used as the neighborhood function and the initial neighborhood had a value of 6. After training of the SOM, the weight vectors were clustered using the K-means algorithm and the Davies-Bouldin index was used to evaluate the goodness of the clustering. The DB index varies slightly between the calculations because the initial starting point was set randomly. The DB index was calculated 15 times and the mean value of the index was used when selecting the optimal number of clusters. In this case, the optimal number of clusters was set to 8. The descriptions for each cluster are given in Table 3.
47
Table 3. The results of clustering. The table shows the properties of each cluster needed in order to understand the natural grouping of the indoor air quality data. Cluster
Description
c1
Relative humidity is low and the indoor temperature is at the normal level. Overall, CO2 concentration is at the recommended level. The season is early spring.
c2
This situation is similar to cluster 1. Room temperatures are slightly higher. The season is early spring.
c3
Indoor temperatures are high and relative humidity is at normal level. The season is early summer.
c4
Indoor air is very dry (relative humidity is very low). The season is winter.
c5
This situation is similar to clusters 4 and 7. In addition, CO2 concentration is high in some apartments. The season is winter.
c6
Indoor temperatures are high and the relative humidity is below the recommended levels. The season is early spring.
c7
This situation is similar to clusters 4 and 5. Only the CO2 concentration is higher in different rooms. The season is winter.
c8
Indoor air quality is mainly good with respect to all measured parameters. The season is spring.
Paper III presents an approach to modeling the concentration of carbon dioxide (CO2) in indoor air applying neural networks and indoor air quality measurements. The research was conducted in an apartment building located in Kuopio, Finland, from May to October 2011. Indoor air quality data were collected continuously in 8 apartments from 4 bedrooms and 8 living rooms using the energy consumption and air quality monitoring system presented in Paper I. Before the modeling phase, the data were pre-processed. This meant removing outliers, scaling the data, and extracting the selected features using a time window of 60 minutes. After pre-processing, the input variables of the MLP model were selected using correlation analysis (Figure 7).
48
Fig. 7. Correlation map of extracted features (variables); Variable pairs are regrouped by similarity using K-means clustering. Selected variables were 5 (Max RH), 6 (Max T), 9 (Skewness RH), 14 (Average T), 16 (Median T), 18 (RMS T) and 20 (Sum T). The negative linear relationship was reasonable (0.2 < R < 0.3) between mean CO2 and selected variables (Reprinted with permission from World Academy of Science, Engineering and Technology).
Selected variables and their delayed values were used in training the MLP model. The model parameter selection was based on experience and knowledge. Parameters were set as follows: 10 neurons were set in the hidden layer, the back-propagation learning was based on the Levenberg-Marquardt algorithm, the performance function was the regularized mean squared error, a hyperbolic sigmoid tangent was used for the hidden layers and a linear for the output layer. Room-specific performance indicators in MLP models were estimated using hold-out cross-validation by repeating model training 5 times on each model. The training dataset consisted of measurements of relative humidity and temperature in 9 rooms and the rest of the data were used as a validation 49
dataset. Statistical indicators were used to provide a numerical description of the goodness of the model. There were four indicators, namely the index of agreement (IA), coefficient of determination (R2), root mean square error (RMSE), and their statistics (mean ± S.D). Figure 8 shows the plot of the predicted versus observed values of the mean CO2 concentration and the LS fitting line.
Fig. 8. The plot of the predicted versus observed values of the mean CO2 concentration and the LS fitting line (Reprinted with permission from World Academy of Science, Engineering and Technology).
The validation results showed that the MLP model is a good estimator of CO2 concentration, but in exceptional situations the model cannot predict correctly. In Paper IV, indoor air quality measurements were compared in ten school buildings, located in Kuopio, Finland, and a more detailed comparison was made for two selected school buildings (schools 2 and 3). All selected school buildings differ from each other in several ways, for example school number 10 has been constructed recently and its heated volume is large. In contrast, the heated volume of school number 2 is also large, but the construction year was 1968. Therefore, the building 50
automation technology is very different, having different functions in the selected school buildings. As in Papers II and III, indoor air quality data between the years 2011 and 2012 were gathered using an energy consumption and air quality monitoring system presented in Paper I. The results of the Pearson’s correlation analysis are presented in Figure 9. As an example, in school number 10, the correlation between temperature and total volatile organic compounds differs from the other school significantly and R reaches the value of +0.78. This can be explained as follows: the school was constructed in 2011 and the materials used in furnishing and decoration are new and therefore evaporate more volatile organic compounds than older ones and the evaporation rate depends on temperature.
Fig. 9. Correlation map of measurements school by school. Number 1 is temperature, number 2 is relative humidity, number 3 is carbon dioxide and number 4 is volatile organic compounds (Reprinted with permission from IACSIT Press).
Figure 10 presents statistical information on schools 2 and 3, grouped by weekday. A significant difference between schools was found in the statistical CO2 distributions. Variations in CO2 concentration from Monday to Friday are greater in school number 2 than in school number 3. In addition, CO2 concentration reaches a value of 1943 ppm in school number 2. Based on a more detailed analysis, this was a single situation and which occurred in one of the classrooms on Thursday January 26 2012 from 5.00 pm to 9.00 pm. During that time, the ventilation was switched off. The results indicate
51
that the concentration of CO2 remains more even and lower (nearly always below 900 ppm) in school number 3 thanks to adequate ventilation.
Fig. 10. Statistical information of measurements presented as a box plot diagrams, grouped by weekday. A box represents the central 50% of the data. Its lower and upper boundary lines are the 25% and 75% quartile of the data. The central line, marked in red, indicates the median of the data. Points beyond the whiskers (remaining data) are displayed using a red plus sign (Reprinted with permission from IACSIT Press).
52
4.5
Interpretation of results
An important phase in the KDD process is the analysis and interpretation of results. Nowadays, there is a need for a new generation of computational theories and tools to assist people in extracting valuable information from the rapidly growing volumes of digital data. These theories and tools are the topic of the emerging field of KDD (Fayyad et al. 1996, Pyle 1999). The basic principle for bringing the results of data mining to the end-users is the following: methods and technologies must be hidden in the service, results have to be presented in an easily understandable way and tailored for each end-user group. Normally the interpretation of results includes interpreting the discovered patterns. This process usually includes several steps, as well as possible visualization of the extracted patterns, removing redundant or irrelevant patterns, and translating the useful ones into terms understandable by end-users (Fayyad et al. 1996). Different kind of result interpretations are presented in Papers I-IV. In Paper I, the end-user interface of the energy consumption and air quality monitoring system, presented in Figure 11, was targeted at property maintenance and residents. First, when accessing the client, the end-user has to give a username and a password. An alternative way to log in is to pass an encrypted token in the url, which contains an identification key and a timestamp. This is beneficial for third party software, which has a link to the Silverlight client. In these cases, the user has already logged into another software program and there is no need to ask for credentials a second time. Indoor air quality information is accessible through its own section. The end-user can select a time window in a similar way as with the consumption data. Various time window sizes are available: month, week, day, and tiny window. The end-user can specify the size of the tiny window to a range of desired hours within a day. When data is retrieved from the server, it is averaged or summed to a suitable resolution for the time window. This makes interpreting and visualizing the results easier. For most types of indoor measurements, it is also necessary to select one or more rooms from a floorplan. Weather information is also provided. Rainfall, outdoor temperature, wind direction, and wind speed can be inspected in the same manner as consumption and air quality time series data. The program also has features to generate pdf reports from consumption and air quality measurements. The reports contain monthly consumption totals and average bedroom air quality for the few past months. In addition, the residents keep a diary,
53
where they report various events that could affect air quality. This information can be used, for example in research.
Fig. 11. Screenshots of the end-user interface of the energy consumption and air quality monitoring system.
In Paper II, the end-user of the refined information was the rental housing company Niiralan Kulma Oy, providing services in the Kuopio area. In Figure 12, clustering methods were used to analyze indoor air quality data to provide information on the air quality and adequate ventilation rate of different rooms. This visualization is and easy and simple way to compare indoor air quality between the rooms. For example, there are major differences in the temperature readings and CO2 concentrations between rooms. On the other hand, relative humidity, which indicates how moist the air is, seems to be similar in all rooms. As the owners of the buildings, Niiralan Kulma Oy has utilized these results to assess the quality of indoor air in their apartments.
54
Fig. 12. Analyzing events and anomalies in indoor air quality of rooms. The rooms are marked as follows: living room is LR and bedroom is BR. The 2nd floor rooms are called 6BR, 6LR, 8LR, 10BR and 10LR. Respectively, the 6th floor rooms are called 26BR, 26LR, 28LR, 30BR and 30LR (Reprinted with permission from CESER Publications).
In Paper III, end-users of the results may be the scientific community or industry. New information is produced related to CO2 concentration prediction. This prediction based only on measurements of relative humidity and temperature, is challenging. Prediction accuracy is reasonable in normal situations, as shown in Figure 13, but in exceptional situations, the model cannot predict CO2 concentrations well enough. To produce a more valuable result, more additional information is needed as model input, such as information on presence and electricity consumption, to improve the goodness of the model.
55
Fig. 13. Time series plot of observed versus predicted mean CO2 concentration (Reprinted with permission from the World Academy of Science, Engineering and Technology).
In the case of the analyzing indoor air quality in school buildings (Paper IV), the endusers of the refined information was the City of Kuopio. Long-term continuous measurements, together with statistical and correlation analysis, provided valuable information related to indoor air quality in schools (Figures 9 and 10). On the other hand, researchers received valuable information on the challenges related to continuous indoor air quality measurements. 4.6
Knowledge deployment
Knowledge deployment is the final phase of the KDD process. It means the use of the data mining within a target environment. Discovered knowledge has to be organized and presented in a way that the end-user can use it. Depending on the requirements, this step can be as simple as generating a report or as complex as implementing a 56
repeatable knowledge deployment process. Cios et al. (2007) have subdivided this step into: – planning deployment, – planning monitoring and maintenance, – generating of final report, and – reviewing the process steps. A key element in successful knowledge deployment is close co-operation with endusers. In this thesis, a few examples of knowledge deployment are presented. In Papers I-IV, the energy consumption and air quality monitoring system offered valuable information on energy consumption and air quality in town houses, apartment houses, and schools. In addition to historical information, the system includes, for example, electricity consumption profiles in each town house and this allows the current electricity consumption to be compared to normal circumstances (Paper I). This information can help in saving energy. In addition, the system offers information on local weather conditions. The end-users such as property maintenance personnel and residents were able to use and utilize this information via an Internet service. In Papers II and IV, the results of data mining were deployed in the assessment of indoor air quality in buildings. The data mining results were submitted to the building maintenance personnel in the form of a report. In this manner, it was possible to carry out a simple deployment of the data mining results and concrete benefits were observed by the end-users. In the case of the neural network application (Paper III), data-based modeling was utilized to predict CO2 concentration in indoor air using measurements of relative humidity and temperature. Computational methods such as feature extraction, variable selection and neural networks were used to build an MLP model of CO2 concentration. Afterwards, the accumulated experience related to developing predictive models was utilized in research projects. Generally, knowledge deployment is a necessary phase in a successful KDD process. This step completes the KDD process and is a vital step on the way to successful data-based approaches or Internet applications.
57
58
5
Discussion
The aims of this thesis were to introduce the developed building monitoring and control system, and to present and utilize computational methods for the indoor air quality data analysis. In addition, novel examples were developed and new valuable information was provided to end-users (such as residents and property maintenance personnel). The KDD process in each case consisted of problem identification, data acquisition, pre-processing, data mining, visualization, interpreting the results and knowledge deployment. As the final important step, the knowledge deployment was carried out in close co-operation with the end-users. In this thesis, the energy consumption and air quality monitoring system, and challenges related to wireless data transfer were presented in Papers I and IV. In addition, various data mining methods were applied to present divergent datasets in a major application field, namely healthy and sustainable buildings (Papers I-IV). A summary of the KDD process tasks used in Papers I-IV is presented in Table 4. Table 4. Summary of KDD process tasks used in Papers I-IV. Paper
I
II
III
IV
Problem
Develop cost-
Possible indoor
Measuring CO2
Possible indoor
identification
effective and
air quality
concentration is
air quality
real-time
problems in an
expensive,
problems in
monitoring
apartment house,
predict CO2
schools,
system with novel
effective
concentrations
challenges
end-user
identification of
and utilize model
related to
interface
events and
to develop of a
measurements in
anomalies in
soft sensor
different
extensive indoor
environments are
air quality data Data acquisition
Pre-processing
not clear
Distributed data
Dataset from
Dataset from
Dataset from
collection system
energy
energy
energy
from data transfer
consumption and
consumption and
consumption and
units to server
indoor air quality
indoor air quality
indoor air quality
monitoring
monitoring
monitoring
system
system
system
Data cleaning
Data cleaning
Data cleaning
Data cleaning
(outliers detection
(outliers detection
(outliers detection
(outliers detection
and removal),
and removal),
and removal),
and removal),
Data
data
reducing size of
reducing size of
transformation
transformation
data,
data
using moving
using variance
transformation
59
Paper
I
II
III
average,
scaling
using variance
temperature
IV
scaling
compensation Data mining
Fitting weighted
Compressing
Predictive
Solving the
multiples of sine
data using SOM,
modeling using
correspondence
and cosine
clustering SOM
MLP
between
curves to
weight vectors
variables using
historical
using K-means
correlation
consumption time
analysis,
series data
statistical analysis
Interpretation of
End-user
Simple
Summary of
Statistical
results
interface of the
visualization
validation and
information on
energy
describing and
performance of
indoor air quality,
consumption and
comparing indoor
built MLP models
comparison of
indoor air quality
air quality
indoor air quality
monitoring
between rooms
between schools
system Knowledge
Historical
Report containing
Experience on
Report containing
deployment
information on
information on
deployment of
information on
energy
apartment house
predictive models
schools’ indoor
consumption and
indoor air quality
and predicting
air quality for
indoor air quality,
for building
CO2
building
consumption
maintenance
concentration
maintenance
comparisons for
personnel
personnel
minimizing energy usage
Furthermore, a unique idea to create a state-of-the-art adaptive buildings automation system is proposed in Paper V. It describes the needs of a new kind of building automation system to improve the energy efficiency of real-time housing, health, safety and security, as well as comfort, considering the residents’ lifestyles and how this goal can be achieved. 5.1
Benefits of continuous monitoring and challenges of implementation
Indoor air quality is a significant concern for building managers, employees, businesses and tenants, because it can impact comfort, health, well-being, and even productivity. Continuous monitoring of IAQ is vitally important, because people 60
spend 90 percent of their time indoors. This research work highlighted a number of benefits related to continuous monitoring which can be highlighted as follows: – – – – –
a continuous IAQ monitoring system eliminates the problems associated with single point measurements, it provides the possibility to monitor multiple IAQ parameters in realtime, it provides valuable information to the end-users, it provides the possibility to develop new information services, and in this way, it creates new business opportunities and jobs.
As presented in Paper IV, many challenges have been identified related to wireless sensor networks, sensors, and sampling frequency. Further, especially when the IAQ monitoring system is retrofitted and data transmission is based on ZigBee technology, problems may start to accumulate. To be precise, based on our expertise and research, ZigBee technology is well suited for indoor data transmission in sensor networks, provided that the sensors are not far away from each other or the network nodes are placed in such way that the mesh network would work well. Of course, furnishing and decoration will set their own challenges. As far as the distances between network nodes are concerned, if they are long and wireless data transmission is only the reasonable option, it would be better to use different communication technology such as 433 or 868 MHz frequency band radios, because 433/868 MHz provides better penetration through walls and a higher theoretical free-air range. 5.2
Data-driven problem solving and information services
This thesis presents four cases of data-driven problem solving. Case-specific raw data, data processing, and computational methods create a good basis for developing new information services. In this context, an information service is a service, which provides data, knowledge, and information in some form. First, the case of the energy consumption and air quality monitoring system was based on developing the monitoring system and continuous monitoring service. The system consisted of sensors, data transfer units and monitoring services. The data collected were refined, for example consumption load profiles were constructed by fitting weighted multiples of sine and cosine curves to historical consumption time series data. The results of data processing were provided to end-users using a webbased interface. Secondly, indoor air quality data were analyzed by applying 61
clustering methods. A dataset including indoor air quality data from six apartments from January to May 2011 was clustered using SOM and K-means. Finally, the results of the data analysis were handed over to the building maintenance personnel. Thirdly, measured indoor air quality data were used to create a predictive model for CO2 concentration and the MLP model was developed and used in prediction of CO2 concentration. Fourthly, indoor air quality measurements from ten schools were analyzed by applying statistical methods. The dataset includes measurements from October 2011 to July 2012. Finally, the results of the schools data analysis were handed over to the building maintenance personnel. The computational methods used were appropriate for different kinds of multidimensional data analysis such as prediction, regression, and clustering. These methods are well-known and widely used in data mining. The innovation comes from combining the different methods together and constructing continuous monitoring systems. An example of a well-known application where computational intelligence is applied is weather forecasts, but many application areas can still be found. In addition, there are many data sources available with no costs, for example related to the environment, and this makes the development of new applications possible. 5.3
Innovative use of data
Digital data is now ubiquitous and many organizations know the potential value of information. In addition, the costs related to acquiring, storing, processing, and using this information are also known. The use of big data has become a key basis of competition and growth for the individual company. Moreover, from the point of view of competitiveness and potential capture of value, all companies need to take big data seriously. Innovative data usage provides solutions for the creation of valuable information and cost reduction. For instance, on the basis of a McKinsey Global Institute report, services enabled by personal-location data can allow consumers to capture $600 billion in economic surplus (Manyika et al. 2011). From this point of view, utilization of big data and developing information services have a broad market. In the environmental field, sensor networks have been broadly established and web services have been used as a standard way to create distributed applications and manage data. The concept of the Sensor Web (Open Geospatial Consortium 2007) has been constructed by the Open Geospatial Consortiums (OGC) Sensor Web Enablement (SWE). The OGS’s SWE standards enable developers to make all kinds of sensors and real-time sensor systems, which are accessible and useable via the Web. In more detail, SWE aims to develop systems or applications where all sensors: 62
– are connected to the Web, – report a position, – metadata of sensors is registered, and – are readable remotely. Also, the remote control of sensors should be possible. The vision of SWE is to define and approve the standards foundation for “plug-and-play” Web-based sensor networks. The monitoring system, data-driven problem solving and information services described in this thesis are supported well by this vision. The SWE standards that have been built and prototyped by members of the OGC include solutions for describing sensor systems and processes (SensorML), encoding observations and measurements from a sensor (O&M), describing transducers and supporting real-time steaming of data to and from a sensor system (TransducerML or TML), requesting, filtering, and retrieving observations and sensor system information (SOS), requesting user-driven acquisitions and observations (SPS), publishing and subscribing alerts from sensors (SAS), and the asynchronous delivery of messages or alerts from SAS and SPS services (WNS) (Open Geospatial Consortium 2007). The public sector has become one of the largest information producers and users. In addition, public organizations manage information related to, for example satellite images, maps and population, company and patent registers. On the basis of this information, many services are provided to citizens, such as navigation services and weather forecasts. On the other hand, the public sector has not published all their data. In future, more flexible data access, co-operation with the public sector and companies could generate new business, companies, and jobs. 5.4
Ideas for future work
At present, the monitoring platforms have made good progress and a lot of research has been done, for instance Zhao et al. (2013) have developed an energy monitoring system for large buildings, Sharmin et al. (2014) have monitored building energy consumption, thermal performance and indoor air quality, while Hajdukiewicz et al. (2015) have developed a method to investigate the environmental and structural performance of buildings, and Batista et al. (2014) have researched comfort and energy performance and continuous monitoring of buildings. In spite of this, there is still a lot of work to do on monitoring indoor air quality and energy consumption. As presented in Paper V, by researching computational intelligence for colearning enabled healthy and sustainable housing, there is potential to develop 63
breakthrough methods at least for the domains of adaptive control, data analysis, and machine learning. The strong connection with real-life data and applications could help to validate improved energy efficiency and indoor climate, as well as the safety of buildings and their inhabitants. In addition, the research methods developed could create new ways of studying and exploring subjective experience; in particular, in the context of housing and automation. In fact, subjective experience is one of the key motivations for the adaptive control of HVAC properties. Subjective experience is a challenging research topic, because it may vary both spatially and temporally. Such a phenomenon is manifested in housing, for instance, as occupants tend to prefer different temperatures in different rooms, also depending on the season. One ambitious goal is to develop methods to obtain key factors and causalities governing subjective experience using machine learning. Such methods will also open new ways to study other phenomena, such as human perception, individual wellness factors (e.g. stress), and environmental issues. These intelligent methods could have an immediate applicability in industry for the improvement of HVAC devices. The extensive research and development of unique systems is needed to respond to future challenges of energy efficiency in buildings and residential comfort. In addition, new kinds of innovations have the opportunity to be widely applied in both new buildings and the renovation of existing buildings.
64
6
Conclusion
Innovative and effective use of digital data are the key factors in the creation of future information services. Therefore, there should be more focus on developing monitoring systems and efficient data processing methods. In addition, it was noticed in this work that end-users, such as building maintenance personnel and residents, should be taken into account in the early stages of the data refining process. Research work during this thesis has highlighted a number of factors, and the following list includes the main recommendations: –
The building and construction materials have a major influence the choice of wireless data transfer technologies. – The measurement arrangement and data processing need to be planned well in advance. – Valuable information and new approaches can be produced by merging different computational and data processing methods. – Data quality has a key role when developing new information services. – The developed information services must provide only the necessary information to the end-users and all other functionalities or technologies have to be hidden. The service business in the building sector is significant, but plenty of new possibilities await capable and advanced companies or organizations. Furthermore, better advantages can be detected by courageous and ambitious co-operation between companies and organizations, by utilizing computational methods for data processing to produce valuable information, and by using the latest technologies in the research and development of new innovations.
65
66
References Apte MG, Fisk WJ & Daisey JM (2000) Association between indoor (CO2) concentrations and sick building syndrome symptoms in US office buildings: an analysis of the 1994–1996 BASE study data. Indoor Air 10: 246–257. Batista A, Freitas M & Jota F (2014) Evaluation and improvement of the energy performance of a building’s equipment and subsystems through continuous monitoring. Energy and Buildings 75: 368–381. Bezdek JC (1994) “What is computational intelligence?” Computational Intelligence: Imitating Life, (eds) Zurada J, Marks R & Robinson C, Piscataway, IEEE Press, 1–12. Brasche S & Bischof W (2005) Daily time spent indoors in German homes – baseline data for the assessment of indoor exposure of German occupants. International Journal of Hygiene and Environmental Health 208(4): 247–253. Burge PS (2004) Sick building syndrome. Occupational & Environmental Medicine 61: 185–190. Butler D (2008) Architects of a low-energy future. Nature 452: 520–523. Castells M & Himanen P (2002) The information society and the welfare state: the Finnish model. Oxford University Press. Castells M (2004) The information age: economy, society and culture, vol 2: the Power of Identity. 2nd ed. Oxford: Blackwell. Cios K, Pedrycz W, Swiniarski R & Kurgan L (2007) Data mining – A knowledge discovery approach. Springer. Davies D & Bouldin D (1979) A cluster separation measure. IEEE Transactions on Pattern Analysis and Machine Intelligence 2: 224–227. Dillenbourg P (1999) Collaborative learning: cognitive and computational approaches. Advances in Learning and Instruction Series. New York, NY: Elsevier Science, Inc. Ding D, Cooper RA, Pasquina PF & Fici-Pasquina L (2011) Sensor technology for smart homes. Maturitas 69: 131–136. Dorian P (1999) Data preparation for data mining. 1st ed. Morgan Kaufmann. Fayyad U, Piatetsky-Shapiro G & Smyth P (1996) From data mining to knowledge discovery in databases. AI Magazine 17: 37–54. Feng X, Li Q, Zhu Y, Hou J, Jin L & Wang J (2015) Artificial neural networks forecasting of PM2.5 pollution using air mass trajectory based geographic model and wavelet transformation. Atmospheric Environment 107: 118–128. Guyon I & Elisseeff A (2003) An Introduction to Variable and Feature Selection. Journal of Machine Learning Research 3: 1157–1182. Hajdukiewicz M, Byrne D, Keane M & Goggins J (2015) Real-time monitoring framework to investigate the environmental and structural performance of buildings. Buildings and Environment 86: 1–16. Han J & Kamper M (2000) Data mining: concept and techniques. Morgan Kaufman Publishers. Hand D, Mannila H & Smyth P (2001) Principles of data mining. Cambridge MA, MIT Press. 67
Hawkins DM (2004) The problem of overfitting. Journal of Chemical Information and Modeling: 44: 1–12. Haykin S (1999) Neural networks: a comprehensive foundation. 2nd edition. Prentice-Hall, Upper Saddle River, New Jersey. Haykin S (2009) Neural networks and learning machines. 3rd edition. Pearson Education Inc. Upper Saddle River, New Jersey. Himanen P (2004) Challenges of the global information society. Parliament of Finland, Committee for the future. Hoi KI, Yuen KV & Mok KM (2013) Improvement of the multilayer perceptron for air quality modelling through an adaptive learning scheme. Computers & Geosciences 59: 148–155. Holdren JP (2007) Energy and sustainability. Science 315(5813): 737. Jaakkola JJK & Heinonen OP (1989) Sick building syndrome, sensation of dryness and thermal comfort in relation to room temperature in an office building; need for individual control of temperature. Environmental International 15: 163–168. Jiang L, Liu D-Y & Yang B (2004) Smart home research. Proceedings of the 3rd International Conference on Machine Learning and Cybernetics, Shanghai, China: 659–663. Jones AP (1999) Indoor air quality and health. Atmospheric Environment 33(28): 4535– 4564. Karol R & Nelson B (2007) New product development for dummies. Wiley Publishing. Kastner W, Neugschwandtner G, Soucek S & Newman HM (2005) Communication systems for building automation and control. Proceedings of the IEEE 93(6): 1178– 1202. Kim H-Y (2013) Statistical notes for clinical researchers: assessing normal distribution (2) using skewness and kurtosis. Restorative Dentistry & Endodonts 38(1): 52–54. Kohonen T (2001) Self-organizing maps. 3rd ed. Berlin, Springer-Verlag. Kovatsch M, Weiss M & Guinard D (2010) Embedded internet technology for home automation. Proceedings of the 15th International conference on Emerging Technologies and Factory Automation (ETFA ’10), Bilbao, Spain. Laine S (2003) Using visualization, variable selection and feature extraction to learn from industrial data. Doctoral thesis, Helsinki University of Technology, Finland. Leech J, Nelson W, Burnett R, Aaron S & Raizenne ME (2002) It’s about time: a comparison of Canadian and American time-activity patterns. Journal of Exposure Analysis and Environmental Epidemiology 12: 427–432. Lehmann B, Gyalistras D, Gwerder M, Wirth K & Carl S (2013) Intermediate complexity for model predictive control of integrated room automation. Energy and Buildings 58: 250–262. Lu J, Ruan D & Zhang G (2007) E-Service intelligence – methodologies, technologies and applications. Studies in Computational Intelligence 37. Berlin Heidelberg, SpringerVerlag.
68
MacQueen J (1967) Some methods for classification and analysis of multivariate observations. Proceedings of the 5th Berkeley Symposium on Mathematical Statistics and Probability, Volume 1: Statistics. Berkeley, University of California Press: 281– 297. Manyika J, Chui M, Brown B, Bughin J, Dobbs R, Roxburgh C & Byers A (2011) Big data: the next frontier for innovation, competition, and productivity. McKinsey Global Institute. Meerbeek B, Kulve te M, Gritti T, Aarts M, Loenen van E & Aarts E (2014) Building automation and perceived control: a field study on motorized exterior blinds in Dutch offices. Buildings and Environment 79: 66–77. Michaelsen J (1987) Cross-validation in statistical climate forecast models. Journal of Climate and Applied Meteorology 26: 1580–1600. Miorandi D, Sicari S, De Pellegrini F & Chlamtac I (2012) Internet of things: vision, applications and research challenges. Ad Hoc Networks 10: 1497–1516. Missaoui R, Joumaa H, Ploix S & Bacha S (2014) Managing energy smart homes according to energy prices: analysis of a building energy management system. Energy and Buildings 71: 155–167. Niska H, Heikkinen M & Kolehmainen M (2006) Genetic algorithms and sensitivity analysis applied to select inputs of a multi-layer perceptron for the prediction of air pollutant time series. Proceedings of the 7th International Conference of Intelligent Data Engineering and Automated Learning. IDEAL 2006. Burgos, Spain, Springer Verlag. Lecture Notes in Computer Science: 224–231. Open Geospatial Consortium (2007) OGC White Paper – Sensor Web Enablement: Overview and high level architecture. Paavola M (2011) An efficient entropy estimation approach. Ph.D. Thesis, Acta Universitatis Ouluensis C Technica 394. Pal NR & Pal S (2002) Computational intelligence for pattern recognition. International Journal of Pattern Recognition and Artificial Intelligence. 16: 773–779. Pasanen A-L, Korpi A, Kasanen J-P & Pasanen P (1998) Critical aspects on the significance of microbial volatile metabolites as indoor air pollutants. Environment International 24(7): 703–712. Pyle D (1999) Data preparation for data mining. San Francisco, Morgan Kaufmann. Reinikainen LM, Jaakkola JJK, Helenius T & Seppänen O (1990) The effect of air humidification on symptoms and environmental complaints in office workers. A six period cross-over study. Indoor Air 90 1:775–780. Ricquebourg V, Menga D, Durand D, Marhic B, Delahoche L & Loge C (2006) The smart home concept: our immediate future. Proceedings of the 1st International Conference on E-Learning in Industrial Electronics, Hammamet, Tunisia: 23–28. Samet JM, Marbury MC & Spengler JD (1987) Health effects and sources of indoor air pollution. Part I. American Review of Respiratory Disease 136(6): 1486–1508. Seppänen OA, Fisk WJ & Mendell MJ (1999) Association of ventilation rates and CO2 concentrations with health and other responses in commercial and institutional buildings. Indoor Air 9: 226–252. 69
Sharmin T, Gül M, Li X, Ganev V, Nikolaidis I & Al-Hussein M (2014) Monitoring building energy consumption , thermal performance, and indoor air quality in a cold climate region. Sustainable Cities and Society 13: 57–68. Skön J-P, Johansson M, Kauhanen O, Raatikainen M, Leiviskä K & Kolehmainen M (2012) Wireless building monitoring and control system. World Academy of Science, Engineering and Technology 65: 706–711. Skov P & Valbjorn O (1989) The sick building syndrome in the office environment; the Danish town hall study. Environmental International 13: 339–349. Škrjanc I & Šubic B (2014) Control of indoor CO2 concentration based on a process model. Automation in Construction 42: 122–126. Smith KR & Mehta S (2003) The burden of disease from indoor air pollution developing countries: comparison of estimates. International Journal of Hygiene and Environmental Health 206: 279–289. Snee RD (1977) Validation of regression models: methods and examples. Technometrics 19: 415–428. Snoonian D (2003) Smart buildings. IEEE Spectrum. 40(8): 18–23. Sosiaali- ja terveysministeriö (2003) Asumisterveysohje – asuntojen ja muiden oleskelutilojen fysikaaliset, kemialliset ja mikrobiologiset tekijät. Sosiaali- ja terveysministeriön oppaita 2003:1, Oy Edita Ab, Helsinki. Tier ØD, Jain AK & Taxt T (1996) Feature extraction methods for character recognition – a survey. Pattern Recognition 29(4): 641–662. Tylman W (2013) Native support for Modbus RTU protocol in snort intrusion detection system. Advances in Intelligent Systems and Computing 224: 479–487. Veryzer RW (1998) Discontinuous innovations and the new product development process. Journal of Product Innovation Management 15: 304–321. Vesanto J (2002) Data exploration process based on the Self-organizing map. Doctoral thesis, Helsinki University of Technology, Finland. Willmott CJ (1981) On the validation of models. Physical Geography 2: 184–194. Willmott CJ, Ackleson S, Davis R, Feddema J, Klink K, Legates D, O’Donnell J & Rowe C (1985) Statistics for the evaluation and comparison of models. Journal of Geophysical Research 90(C5): 8995–9005. Wolkoff P (2013) Indoor air pollutants in office environments: assessment of comfort, health, and performance. International Journal of Hygiene and Environmental Health 216: 371–394. Xiao F & Fan C (2014) Data mining in building automation system for improving building operational performance. Energy and Buildings 75: 109–118. Yang R & Wang L (2012) Multi-objective optimization for decision-making of energy and comfort management in building automation and control. Sustainable Cities and Society 2: 1–7. Zampolli S, Elmi I, Ahmed F, Passini M, Cardinali GC, Nicoletti S & Dori L (2004) An electronic nose based on solid state sensor arrays for low-cost indoor air quality monitoring applications. Sensors and Actuators B: Chemical 101(1-2): 39–46.
70
Zhao L, Zhang J-L & Liang R-B (2013) Development of and energy monitoring system for large public buildings. Energy and Buildings 66: 41–48.
71
72
Original publications I
Skön J-P, Kauhanen O & Kolehmainen M (2011) Energy Consumption and Air Quality Monitoring System. Proceedings of the 7th International Conference on Intelligent Sensors, Sensor Networks and Information Processing (ISSNIP ’11), Adelaide, Australia: 163–167. II Skön J-P, Johansson M, Raatikainen M, Haverinen-Shaughnessy U, Pasanen P, Leiviskä K & Kolehmainen M (2012) Analysing Events and Anomalies in Indoor Air Quality Using Self-Organizing Maps. International Journal of Artificial Intelligence 9(A12): 79–89. III Skön J-P, Johansson M, Raatikainen M, Leiviskä K & Kolehmainen M (2012) Modelling Indoor Air Carbon Dioxide (CO2) Concentration Using Neural Network. World Academy of Science, Engineering and Technology 61: 879–883. IV Skön J-P, Raatikainen M, Johansson M, Leiviskä K & Kolehmainen M (2013) Assessing Indoor Air Quality Measurement Correlations and Variations in School Buildings. International Proceedings of Chemical, Biological & Environmental Engineering 51: 16–22. V Skön J-P, Rönkkö M, Raatikainen M, Juhola M, Främling K & Kolehmainen M (2013) Research on Computational Intelligence for Co-Learning Enabled Healthy and Sustainable Housing. Proceedings of the Scientific Cooperations International Conferences in Electrical and Electronics Engineering, Advances in Control Engineering (ACE ’13), Istanbul, Turkey: 57–64.
Reprinted with permission from Institute of Electrical and Electronics Engineers (I), CESER Publications (II), World Academy of Science, Engineering and Technology (III), IACSIT Press (IV) and Scientific Cooperations (V). Original publications are not included in the electronic version of the dissertation.
73
74
C549etukansi.kesken.fm Page 2 Tuesday, October 13, 2015 10:31 AM
ACTA UNIVERSITATIS OULUENSIS SERIES C TECHNICA
532.
Leinonen, Mikko (2015) Finite element method and equivalent circuit based design of piezoelectric actuators and energy harvester dynamics
533.
Leppäjärvi, Tiina (2015) Pervaporation of alcohol/water mixtures using ultra-thin zeolite membranes : membrane performance and modeling
534.
Lin, Jhih-Fong (2015) Multi-dimensional carbonaceous composites for electrode applications
535.
Goncalves, Jorge (2015) Situated crowdsourcing : feasibility, performance and behaviours
536.
Herrera Castro, Daniel (2015) From images to point clouds : practical considerations for three-dimensional computer vision
537.
Komulainen, Jukka (2015) Software-based countermeasures to 2D facial spoofing attacks
538.
Pedone, Matteo (2015) Algebraic methods for constructing blur-invariant operators and their applications
539.
Karhu, Mirjam (2015) Treatment and characterisation of oily wastewaters
540.
Panula-Perälä, Johanna (2015) Development and application of enzymatic substrate feeding strategies for small-scale microbial cultivations : applied for Escherichia coli, Pichia pastoris, and Lactobacillus salivarius cultivations
541.
Pennanen, Harri (2015) Coordinated beamforming in cellular and cognitive radio networks
542.
Ferreira, Eija (2015) Model selection in time series machine learning applications
543.
Lamminpää, Kaisa (2015) Formic acid catalysed xylose dehydration into furfural
544.
Visanko, Miikka (2015) Functionalized nanocelluloses and their use in barrier and membrane thin films
545.
Gilman, Ekaterina (2015) Exploring the use of rule-based reasoning in ubiquitous computing applications
546.
Kemppainen, Antti (2015) Limiting phenomena related to the use of iron ore pellets in a blast furnace
547.
Pääkkönen, Tiina (2015) Improving the energy efficiency of processes : reduction of the crystallization fouling of heat exchangers
548.
Ylä-Mella, Jenni (2015) Strengths and challenges in the Finnish waste electrical and electronic equipment recovery system : consumers’ perceptions and participation Book orders: Granum: Virtual book store http://granum.uta.fi/granum/
C549etukansi.kesken.fm Page 1 Tuesday, October 13, 2015 10:31 AM
C 549
OULU 2015
UNIVERSITY OF OUL U P.O. Box 8000 FI-90014 UNIVERSITY OF OULU FINLA ND
U N I V E R S I TAT I S
O U L U E N S I S
ACTA
A C TA
C 549
ACTA
UN NIIVVEERRSSIITTAT ATIISS O OU ULLU UEEN NSSIISS U
Jukka-Pekka Skön
University Lecturer Santeri Palviainen
Postdoctoral research fellow Sanna Taskila
Jukka-Pekka Skön
Professor Esa Hohtola
INTELLIGENT INFORMATION PROCESSING IN BUILDING MONITORING SYSTEMS AND APPLICATIONS
Professor Olli Vuolteenaho
University Lecturer Veli-Matti Ulvinen
Director Sinikka Eskelinen
Professor Jari Juga
University Lecturer Anu Soikkeli
Professor Olli Vuolteenaho
Publications Editor Kirsti Nurkkala ISBN 978-952-62-0990-6 (Paperback) ISBN 978-952-62-0991-3 (PDF) ISSN 0355-3213 (Print) ISSN 1796-2226 (Online)
UNIVERSITY OF OULU GRADUATE SCHOOL; UNIVERSITY OF OULU, FACULTY OF TECHNOLOGY
C
TECHNICA TECHNICA