model of the important Lean Manufacturing System variables from its implementation aspects. Keywords: ISM, Interpretive structural modelling, Lean.
International Journal of Applied Engineering Research ISSN 0973-4562 Volume 13, Number 1 (2018) pp. 85-90 © Research India Publications. http://www.ripublication.com
Interpretive Structural Modelling for Implementing Lean Manufacturing System 1
Ajay Kumar Pandey, 2Vijay Kumar 1,2
Assistant Professor Department of Mechanical Engineering School of Engineering Presidency University, Itgalpura,Bengaluru-64
Abstract 2. ISM APPROACH In Indian context Lean Manufacturing System plays a very important role and emerged as an area of research. Its requirement has increased due to defects in semi- finished and finished products with subsequent increase in cost. The concept of lean manufacturing was developed for maximizing the utilization of resources through minimization of waste. The purpose of this study is to analyze and develop a structural model of the important Lean Manufacturing System variables from its implementation aspects.
2.1. An overview of ISM methodology ISM was first proposed by Warfield in 1973. Warfield developed a methodology to find out the relationship between various complex issues. It is an interactive learning process in which a set of various issues (directly or indirectly related) is structured into a comprehensive model which is systematically drawn upon finite or discrete mathematics. When the relationship in between elements is not clear it complicates the system’s structure. Hence, a methodology like ISM is required which helps to find out the structure within the system. The terminology used in the ISM methodology to represent the relationship in between the variables are: For any two random elements ‘i’ and ‘j’ V: when i influences j A: when j influences i X: when both influences each other O: when there is no relation in between i and j First, we represent the available information in the matrix in terms of ‘V’, ‘A’, ‘X’ and ‘O’ called Structural Self-Interaction Matrix (SSIM). Then this information is converted into binary form in Initial Reachability Matrix (IRM) by the following rules. If the value of (i, j) in the SSIM is V, then in the Initial Reachability Matrix (i, j) becomes 1 and (j, i) becomes 0. If the value of (i, j) in the SSIM is A, then in the Initial Reachability Matrix (i, j) becomes 0 and (j, i) becomes 1. If the value of (i, j) in the SSIM is X, then in the Initial Reachability Matrix (i, j) and (j, i) both becomes 1. If the value of (i, j) in the SSIM is O, then in the Initial Reachability Matrix (i, j) and (j, i) both becomes 0. The flow diagram is shown in the figure 2 showing all the steps involved in ISM approach.
Keywords: ISM, Interpretive structural modelling, Lean manufacturing system 1. INTRODUCTION Lean concepts are mostly evolved from Japanese industries and Toyota contributed the most. Lean Manufacturing is a waste reduction technique, but in practice it maximize the value of the product by minimization of waste. Elimination of these wastes is achieved through the successful implementation of lean elements. Lean manufacturing is used as a conceptual framework in many industrial companies (Womack & Jones, 1994) and can be best explained as eliminating waste in a production process (Womak & Jones, 1996). Basically, lean manufacturing seeks to produce a product that is exactly what the customer wants at right time, (Womack & Jones, 1994). The lean transition is, an organizational culture transition to manage lean, specifically during the initial phases, is more about managing the change process than managing lean tools and techniques (Csokasy & Parent, 2007). An Interpretive Structural Modelling (ISM), (a wellestablished methodology for identifying relationships among specific factors) is used to obtain the relationship between various variables important in implementation of lean management. The main objectives of this paper are: 1. By using interpretive structural modelling establish the relationship among these identified variables 2. To propose a structural model 3. Use MICMAC analysis to classify the identified variables into four categories
2.2.
ISM approach to modelling
The following paragraphs shall illustrate the structural relationship among variables as derived from ISM approach. • Identification of variables In the process of literature review 9 important variables are identified. These 9 variables are separately presented in the Table 1.
The remainder of this paper is organized as follows. Section 1 presents the Introduction. In section 2, an overview of ISM methodology is presented. The details of ISM approach to model variables are presented in section 3. MICMAC analysis. Section 4 are the findings and discussion. And section 5 presents Conclusion and further research direction.
85
International Journal of Applied Engineering Research ISSN 0973-4562 Volume 13, Number 1 (2018) pp. 85-90 © Research India Publications. http://www.ripublication.com Table 1: Identification of variables SN Variables Researchers 1 Employee skill Yu Lin & Hui Ho (2008); Womack, Jones & Roos (1990). 2 Value addition Womack & Jones (1996) Poppendieck (2002); Heizer 3 Efficient scheduling & Render (2006); Womack et al. (1990) 4 Quality control Panizzolo (1998) 5 Efficient technology Edwards (1996) 6 Improved quality of Forza (1996); Shah & Ward raw material (2003); Taj (2008) 7 Safety and Walder, Karlin & Kerk ergonomics (2007). 8 Marketing Womack & Jones (1996). Proper floor space 9 Heragu (1997) utilization
Initial Reachability Matrix is converted to Final Reachability Matrix (table 4)
• Modelling with ISM approach After the identification of variables the next steps are to model with ISM approach and find out the structural relationship between the variables. • Contextual relationship establishment among risks To identify the contextual relationship in between these 9 variables authors have obtained opinions from experts from the company and academic. On the basis of these opinions the contextual relationships and associated direction is decided. Based on the contextual relationship, a Structural SelfInteraction Matrix (SSIM Table 2) is developed.
2.3 Level partitioning on the basis of reachability and antecedent set After creation of Final Reachability Matrix the reachability and antecedent set is obtained. The reachability set is a combination of the variable i and other variables which influenced by it. Similarly the antecedent set consists of the variable j and other variable which influence it. After finding both sets (reachability and antecedent) the intersection set which consists of the common elements of both the sets is formed. The variables in which reachability and intersection set are same are given top priority in ISM hierarchy and that variable is removed from all the sets. And this process is repeated till all the levels are identified.
Table 2. SSIM (Structural Self Interaction Matrix) Variables 9 8 7 6 5 4 3 1
V
X
V
V
V
V
V
2
A
A
A
A
A
A
A
3
V
A
V
A
A
X
4
V
A
V
A
A
5
V
A
V
V
6
V
A
V
7
A
A
8
V
9
X
Table 3. IRM (Initial Reachability Matrix) Variables 9 8 7 6 5 4
3
2
1
1
1
1
1
1
1
1
1
1
1
2
0
0
0
0
0
0
0
1
0
3
1
0
1
0
0
1
1
1
0
4
1
0
1
0
0
1
1
1
0
5
1
0
1
1
1
1
1
1
0
6
1
0
1
1
0
1
1
1
0
7
0
0
1
0
0
0
0
1
0
8
1
1
1
1
1
1
1
1
1
9
1
0
1
0
0
0
0
1
0
2 Table 4. FRM (Final Reachability Matrix)
V
Variables
•
Development of the Initial Reachability Matrix (IRM) The SSIM (Table 2) is converted into a binary matrix, called as Initial Reachability Matrix (IRM). The relationship symbols V, A, X, O is replaced by 1 and 0 according to the rules explained in section 2 (table 3). • Development of the Final Reachability Matrix (FRM) After considering the transitivity among risk variables the
1
2
3
4
5
6
7
8
9
1
1
1
1
1
1
1
1
1
1
2
0
1
0
0
0
0
0
0
0
3
0
1
1
1
0
0
1
0
1
4
0
1
1
1
0
0
1
0
1
5
0
1
1
1
1
1
1
0
1
6
0
1
1
1
0
1
1
0
1
7
0
1
0
0
0
0
1
0
0
8
1
1
1
1
1
1
1
1
1
9
0
1
0
0
0
0
1
0
1
2.4 Conical matrix A conical matrix can be developed by clubbing together variables in the same level across rows and columns of the final reachability matrix. Summing up the number of ones in the rows gives the driving power and similarly summing up number of ones in the columns gives dependence power.
86
International Journal of Applied Engineering Research ISSN 0973-4562 Volume 13, Number 1 (2018) pp. 85-90 © Research India Publications. http://www.ripublication.com
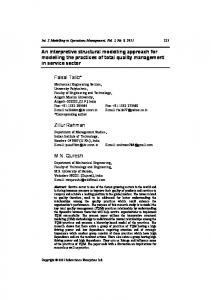
2.3.1 Development of diagraph 2.3.2 Development of ISM model On the basis of conical matrix an initial digraph including The digraph is converted in to an ISM model by replacing the transitivity links is obtained, and when the indirect links are nodes by the names of variables as shown in figure 1. removed, a final digraph is developed as shown in figure 1 Table 5. Iteration 1 Variables Reachability Set Antecedent Set Level Intersection Set 1
1,2,3,4,5,6,7,8,9
1,8
1,8
2
2
1,2,3,4,5,6,7,8,9
2
3
2,3,4,7,9
1,3,4,5,6,8
3,4
4
2,3,4,7,9
1,3,4,5,6,8
3,4
5
2,3,4,5,6,7,9
1,5,8
5
6
2,3,4,6,7,9
1,5,6,8
6
7
2,7
1,3,4,5,6,7,8,9
7
8
1,2,3,4,5,7,8,9
1,8
1,8
1,3,4,5,6,8,9
9
9 2,7,9 Table 6. Iteration 2 Variables
Reachability Set
Antecedent Set
Intersection Set 1,8
1
1,3,4,5,6,7,8,9
1,8
3
3,4,7,9
1,3,4,5,6,8
3,4
4
3,4,7,9
1,3,4,5,6,8
3,4
5
3,4,5,6,7,9
1,5,8
5
6
3,4,6,7,9
1,5,6,8
6
7
7
1,3,4,5,6,7,8,9
7
8
1,3,4,5,7,8,9
1,8
1,8
1,3,4,5,6,8,9
9
9 7,9 Table 7. Iteration 3 Variables
Reachability Set
Antecedent Set
I
II
Intersection Set
1
1,3,4,5,6,8,9
1,8
1,8
3
3,4,9
1,3,4,5,6,8
3,4
4
3,4,9
1,3,4,5,6,8
3,4
5
3,4,5,6,9
1,5,8
5
6
3,4,6,9
1,5,6,8
6
8
1,3,4,5,8,9
1,8
1,8
1,3,4,5,6,8,9
9
9 9 Table 8. Iteration 4 Variables
Reachability Set
Antecedent Set
Level
Intersection Set 1,8
Level
III Level
1
1,3,4,5,6,8
1,8
3
3,4
1,3,4,5,6,8
3,4
IV
4
3,4
1,3,4,5,6,8
3,4
IV
5
3,4,5,6
1,5,8
5
6
3,4,6
1,5,6,8
6
8
1,3,4,5,8
1,8
1,8
87
International Journal of Applied Engineering Research ISSN 0973-4562 Volume 13, Number 1 (2018) pp. 85-90 © Research India Publications. http://www.ripublication.com Table 9. Iteration 5 Variables
Reachability Set
Antecedent Set
1
1,5,6,8
1,8
1,8
5
5,6
1,5,8
5
6
6
1,5,6,8
6
8
1,5,8
1,8
1,8
Table 10. Iteration 6 Variables
Reachability Set
Antecedent Set
V
1,5,8
1,8
1,8
5
5
1,5,8
5
8
1,5,8
1,8
1,8
8
Reachability Set
Antecedent Set
1,5,8
Level
Intersection Set
1
Table 11. Iteration 7 Variable s 1,5,8 1
Level
Intersection Set
VI
Intersection Set
Level
1,8
1,8
VII
1,8
1,8
VII
Table 12. Conical Matrix 1
2
3
4
5
6
7
8
9
Driver Power
1
1
1
1
1
1
1
1
1
1
9
2
0
1
0
0
0
0
0
0
0
1
3
0
1
1
1
0
0
1
0
1
5
4
0
1
1
1
0
0
1
0
1
5
5
0
1
1
1
1
1
1
0
1
7
6
0
1
1
1
0
1
1
0
1
6
7
0
1
0
0
0
0
1
0
0
2
8
1
1
1
1
1
1
1
1
1
9
9
0
1
0
0
0
0
1
0
1
Dependence Power
2
3
4
8
2
7
3 47/47
Variables
9
6
6
3.
3. MICMAC ANALYSIS MICMAC method was developed by Duperrin and Godet (1973), it is a structural analysis tool which describes a system using a matrix that links up its constituent components. They developed two hierarchies, one based on driver power and the second based on dependence power to study the diffusion of impacts. To analyse the driving and dependence power of the risk variables MICMAC (Matrice d’Impacts croisesmultiplication appliqúe an classment (cross-impact matrix multiplication applied to classification) analysis is performed. This is done to classify the variables into four categories as follows: 1. Autonomous Variables: The variables which have weak driving and dependence power comes under the category of autonomous. They are relatively less connected to the system. 2. 2. Linkage Variables: The variables which have strong driving and dependence power comes under the category of linkage. They are also not very stable.
4.
3. Dependent Variables: The variables which have weak driving but strong dependence power comes under the category of dependent. Independent Variables: The variables which have strong driving power but weak dependence power comes under the category of independent.
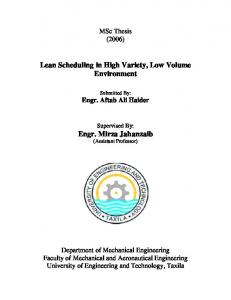
It is generally observed that a variable with a very strong drive power is called the ‘key variable’ and falls into the category of independent or linkage. The driving and dependence power of variables is shown in table 12. After that a driving power and dependence power diagram is drawn (figure 2). This diagram has been divided into four clusters. First cluster includes ‘autonomous variables’, second cluster includes ‘dependent variables’’, third cluster includes ‘linkage variables’’ and fourth cluster contains ‘independent variables’’.
88
International Journal of Applied Engineering Research ISSN 0973-4562 Volume 13, Number 1 (2018) pp. 85-90 © Research India Publications. http://www.ripublication.com
4.
driving power, which means they are the key variables and can be considered as the root cause of the problem. The variables ‘Efficient Scheduling’ and ‘Quality Control’ falls under linkage category.
FINDINGS AND DISCUSSION
The main objective of this research was to identify and analyse the variables that affect the implementation of Lean Management. An ISM based model was developed to find out the structural relationship among 9 selected variables. Some of the important findings of this study are as follows: From the driving power and dependence power diagram it is observed that variables ‘Employee Skill’, ‘Marketing’, ‘Improved quality of raw material’ and ‘Efficient Technology’ come under independent variable category. The variables ‘Employee Skill’, ‘Marketing’ have the highest
2
Value addition
7
Safety and ergonomics
9
3
The risk variables ‘Proper floor space utilization’, ‘Safety and ergonomics’ and ‘Value addition’ have strong dependence power and weak driving power so they fall under dependence variables category. These variables comes on the top of the ISM hierarchy and hence can be considered as the most important and implementers should focus on these.
Proper floor space utilization
4
Quality control
Efficient scheduling
Improved quality of raw material
6
5 Efficient technology 8
1
Employee skill
Diagraph
Marketing
ISM Model Figure 1: Diagraph and ISM Model
5. CONCLUSION Waste minimization and improving efficiency have been identified as key objectives of lean manufacturing system implementation. To model the structural relationship among them Interpretive Structural Modelling (ISM) is used. Further, MICMAC analysis is performed to find out the driving power and dependency of variables. Results of the
study indicates that the implementation of the lean manufacturing system can be improved by considering the key variables. For future research directions Fuzzy ISM technique or structural equation modelling (SEM) can be used and also more variables can be included.
89
International Journal of Applied Engineering Research ISSN 0973-4562 Volume 13, Number 1 (2018) pp. 85-90 © Research India Publications. http://www.ripublication.com 9
1, 8
D 8 R I V 7 I N 6 G
5 6
Linkage
Independent
P 5 O W E 4.5 R 4
3,4
3
9
2
Dependent
1
Autonomous
0
1
2
7 2
3
4
5
6
7
8
9
DEPENDENCE POWER Figure 2: Driving power and dependence diagram.
References [1] Csokasy, D.L., & Parent, P.D. (2007). Managing lean Manufacturing. Society of Manufacturing Engineers: Dearborn, MI TP07PUB2. [2] Duperrin, J.C. and Godet, M., 1973. Méthode de hiérarchisation des éléments d'un système: essai de prospective du système de l'énergie nucléaire dans son contexte sociétal. [3] Edwards, D.K. (1996). Practical guidelines for lean manufacturing equipment. Product Inventory Manage J Second Quarter, 51-55 [4] Forza, C., (1996). Work organization in lean production and traditional plants, what are the differences? International Journal of Operations & Production Management, 16, 42-62. [5] Heizer, J., & Render, B., (2006). Operations Management. 8th ed. Upper Saddle River, NJ: Pearson Prentice-Hall. [6] Panizzolo, R. (1998). Applying the lessons learned from 27 lean manufacturers. The relevance of relationships management. International Journal of Production and Economics, 55(3), 223-240. [7] Poppendieck, M. (2002). Principles of lean thinking. Technical Report, Poppendieck LLC.
[8] Shah, R., & Ward, P.T. (2007). Defining and developing measures of lean production. Journal of Operations Management, 25, 785-805. [9] Taj, S. (2008). Lean Manufacturing performance in china: Assessment of 65 manufacturing plants. Journal of Manufacturing Technology Management, 19(2), 217-234. [10] Walder, J., Karlin, J., & Kerk, C. (2007). Integrated lean thinking & ergonomics: utilizing material handling assist device, solutions for a productive workspace. MHIA White Paper, USA. [11] Womack, J.P., Jones, D.T., & Roos, D. (1990). The Machine That Changed the World. New Yor: Harper Perennial. [12] Womak, J.P., & Jones, D.T. (1996). Lean Thinking: Banish waste and create wealth in your corporation. New York: Simon and Schuster. [13] Yu Lin, C., & Hui Ho, Y. (2008). An Empirical Study on Logistics services provider, intention to adopt Green Innovations. Journal of Technology, Management and Innovation, 3(1), 17-2.
90