Intraday Time and Order Execution Quality Dimensions Ryan Garvey and Fei Wu*
Abstract We examine intraday execution quality patterns on Nasdaq stocks using proprietary order-level data from a U.S. broker dealer. Orders submitted midday execute slower than orders submitted around the open and close. However, midday orders have lower execution costs. Our results indicate that execution speed and execution cost exhibit offsetting intraday time-dependent patterns and these patterns appear to be induced by variations in informed trading levels. While some traders concentrate their trading activity around the open and close, others prefer to trade midday. Traders have varying preferences for when to trade, and offsetting patterns exist between speed and cost. These factors highlight the complexity in defining an optimal trading time, which, among other things, is dependent on the dimensional preferences of individual traders.
*Ryan Garvey is with Duquesne University, Pittsburgh, PA. 15282. Telephone 412-396-4003, fax 412-396-4764, email
[email protected]. Fei Wu is with Massey University, Palmerston North, New Zealand. Telephone 64-6-3505799 ext. 4744, fax 64-6-350-5651, email
[email protected]. We would like to thank the editor, Avanidhar Subrahmanyam, and an anonymous referee for very helpful comments and suggestions on prior drafts. We are also grateful to executives at the U.S. securities firm for providing proprietary data. The Reuters tick history data used in this study were obtained from the Security Industry Research Centre of Asia-Pacific Limited (SIRCA).
1
1. Introduction Execution quality is an important aspect of financial markets. Among its multiple dimensions, the cost dimension (i.e. execution cost) has traditionally been the focus of researchers,1 perhaps, due to data limitations. More recently, there has been increasing interest among academics, practitioners and regulators in the speed dimension (i.e. execution speed) of execution quality. And new data sources have become available for researchers to examine execution speed. Execution speed and execution cost are inherently integrated and both measures of execution quality are important to traders. Faster execution speed, among other things, allows traders to more quickly react to changing market conditions and to resolve uncertainties concerning execution price. The importance of execution speed, in addition to execution cost, is exemplified by its inclusion in market center execution quality reports and its influence on policy decisions, such as the Securities and Exchange Commission’s recently adopted Regulation National Market System (NMS). Recent empirical studies have examined execution speed, along with execution cost, when assessing execution quality (e.g., Boehmer et al. 2007, Boehmer 2005, and Battalio et al. 2003). In general, these studies emphasize that both cost and speed are important dimensions of execution quality and that focusing on only one of them when assessing execution quality can be quite misleading. Boehmer et al. (2007) find that market centers reporting low execution costs and fast fills subsequently receive more order flow, and Battalio et al. (2003) and Boehmer (2005) document a negative relation between execution speed and execution cost across markets. Boehmer (2005) finds that the differential in cost and speed across markets is monotonically related to order size. For example, as order size increases, NYSE executions become more costly and faster relative to Nasdaq executions.
He
rationalizes this result with how informed traders submit their orders under different market structures.
1
See, for example, Lee (1993), Easley et al., (1996), Huang and Stoll (1996), Bessembinder and Kaufman (1997a, b), Bessembinder (1999), and Bacidore et al., (2003).
2
While prior studies highlight the importance and inverse relation between speed and cost across markets, there is little known about the time varying proprieties of execution quality dimensions and their tradeoff patterns, particularly within an intraday timeframe. Given that a rich literature exists on intraday variations in securities behavior,2 it is worthwhile to examine if intraday time dependent patterns exist with the multiple dimensions of execution quality. A better understanding of intraday order execution quality patterns has many useful applications for creating optimal market designs, improving securities regulation, and helping traders manage their order submission strategies more efficiently. The main objective of our paper is to examine how (if) execution quality dimensions of speed and cost vary across the trading day.3 We exploit a unique dataset which encompasses more than 5.2 million Nasdaq stock orders (9 billion traded shares) originating from 2,979 U.S. brokerage accounts during October 1999 to August 2003. The data provide a valuable setting for examining intraday patterns of order execution speed and cost. These intraday patterns cannot be precisely observed, at least from the perspective of a trader, using widely employed transaction databases or existing orderlevel information databases. For example, prior studies examining execution quality using transaction data, such as the NYSE Trade and Quote (TAQ) database, cannot assess execution speed and execution cost is evaluated in terms of the parts (the trades) rather than the sum of the parts (the originating order).
Some researchers have examined execution quality using various order-level information
databases including proprietary dealer audit trail data (e.g. Battalio et al., 2003), market center execution quality reports (e.g. Boehmer, 2005), the NYSE Trade, Order, Record, and Quote (TORQ)
2
See, for example, studies by Wood et al. (1985), Harris (1986), Jain and Joh (1988), Foster and Viswanathan (1993), Brock and Kleidon (1992), and Chan et al. (1995). 3 While speed and cost are arguably two of the more important dimensions of execution quality, other dimensions exist for some traders. For example, Moulton (2005) finds evidence that trading precise quantities (quantity dimension) is important to foreign exchange traders and many U.S. equity traders have voiced concern (see GAO, 2005) about the continual decline in market transparency and rise in order-splitting or multiple-trade order executions (trade dimension).
3
database (e.g. Harris and Hasbrouck, 1996), and the NYSE System Order Database (SOD) (e.g. Peterson and Sirri, 2002). However, some of these data are aggregated in a much lower frequency than ours and thus they are not suitable for intraday analysis.4 Moreover, these data are dealer or market center databases. They are not linked to specific traders and so they do not reveal a traders originating order which is often worked across multiple markets and or dealers. Thus, they provide a different measure of order execution quality than we do.5 Our analysis differs from most in that we examine execution quality from a trader’s perspective by tracing the entire order execution process, beginning from a trader’s original order submission to each trade execution. We find that Nasdaq orders submitted around the open and close are executed more quickly than midday orders, but they suffer from higher execution costs.6 Controlling for order size, market conditions, tick size, and stock and trader characteristics, we find that the execution cost for marketable orders in the 9:30 to 10:00 a.m. period is 5.96% higher than that for the midday benchmark period (12:31 to 1:00pm). We also find that the execution cost for the 3:31 to 4:00 p.m. period is 2.28% higher than that for the midday benchmark period. On the other hand, midday orders take longer to execute despite their lower execution cost. For example, the 9:30 to 10:00 a.m. period has an average order execution speed 8.53% faster than the midday benchmark period and the 3:31 to 4:00 p.m. period has an average order execution speed 13.67% faster than the midday benchmark period. The offsetting intraday patterns of speed and cost can be explained by variations in informed trading levels. It is well known that intraday patterns in trading volume, price volatility, and bid-ask 4
For example, Boehmer uses market center execution quality reports initiated by SEC Rule 11Ac1-5 (Dash 5). Dash 5 reports are published monthly by market centers for each stock, in four order size categories: 100-499, 5001,999, 2,000-4,999, and 5,000-9,999 shares. 5 Some researchers have used trader-defined data to examine execution quality, but these studies have been largely confined to institutional investment managers who do not execute their own orders. The data often lacks information on either the originating order (e.g. Chan and Lakonishok, 1997) or how the various parts of the order are worked by the firms’ broker in the marketplace (e.g. Keim and Madhaven, 1997). 6 The main trading hours in U.S. equity markets are 9:30 a.m. to 4:00 p.m. In our empirical analysis, we split the trading day into thirteen half-hour periods. We use the phrase “around the open” to refer to orders in half-hour periods that are closer to the 9:30 a.m. start time and “around the close” to refer to orders in half-hour periods that are closer to 4:00 p.m.
4
spreads exhibit a U-shape, or a near U-shape pattern, across the trading day. Financial theory posits that higher levels of informed trading around the open and close cause these patterns (e.g., Admati and Pfleiderer, 1988). Informed traders prefer to trade around the open and close because liquidity trading is more concentrated, which enables informed traders to better conceal their identity. If spreads widen and volatility increases around the open and close of trading, then order execution cost (e.g. effective spread), on average, should rise, too. On the other hand, order execution speed, on average, should decline around the open and close of trading if more informed traders enter the market and if informed traders information is short-lived. Short information horizons and informed traders preference for executing quickly are both reasonable assumptions in competitive securities markets. On Nasdaq, informed traders are often characterized as splitting up their orders and trading quickly against published dealer quotes and public limit orders in the different execution venues (or submitting marketable type orders). Thus, marketable orders submitted around the open and close should, on average, have fewer conditions (e.g., price specifications, routing procedures, etc.) attached to them that might potentially slow down their execution speed. On the other hand, uninformed traders placing limit (non-marketable) orders in the marketplace around the open and close should, on average, have their orders executed more quickly due to the increasing presence of informed traders, who will seek to rapidly trade against posted limit orders. We find signs indicating that trading does become more informative around the open and close of trading. For example, order size is smaller, marketable order submissions increase, and price impacts are more pronounced (i.e. more positive for marketable orders and more negative for non-marketable orders) around the open and close of trading. Smaller order sizes, more marketable orders, and higher price impacts are all indicators of more informed trading. More informed trading around the open and close would result in execution speed taking on a humped-shape pattern and execution cost taking on a U-shape pattern across the trading day. These two offsetting patterns are clearly evident in our data.
5
Our findings add to the complex dynamic of execution quality. Traders presumably have different preferences for execution speed, execution cost, and/or other dimensions of execution quality based on their different trading strategies and objectives. For example, in our sample some traders concentrate their trading activity around the open and close while others prefer to trade during the middle of the day. If the various dimensions of execution quality do not exhibit uniform time varying patterns, and traders have different preferences for the various dimensions of execution quality, then attempts to define an “optimal trading time” or a “best execution” become much less clear and highly dependent upon trader’s individual preferences and or order submission strategies.7 The remainder of our paper proceeds as follows. In the next Section, we briefly describe our data and its unique aspects. The empirical results are laid out in Section 3 and in Section 4 we put forward a potential explanation for our empirical findings. Section 5 provides concluding remarks.
2. Data The data for our study are obtained from a large U.S. broker-dealer. The firm had several trading operations. Our analysis focuses on the firm’s brokerage operation, where they provided direct access trade execution software and administrative trading support to both institutional and retail clients. Direct access brokerages allow their clients to choose where and how their order is routed for execution.8 Thus, direct access users directly observe quotes and orders in the marketplace and then they either attempt to access them or they put their own quotes and orders in the marketplace. This differs from more traditional brokerage firms who take care of their clients’ order execution process.
7
Macey and O’Hara (1997) note that “… while the obligation to give customers the benefits of best execution of orders is one of the most well-established principles of securities law, and despite the fact that the concept of best execution is continually referred to in cases, treatises, law refer articles, exchange rules, and administrative proceedings, no clear definition of best execution exists” (p.190). 8 A sizeable portion of trading volume in U.S. equity markets flows through these brokerage firms. Bear Stearns (Goldberg and Lupercio, 2004) notes that approximately 40% of Nasdaq and NYSE trading volume is executed by active traders (25+ trades per day) who trade through Direct Access brokers.
6
Direct access brokers can attract more experienced traders who trade often and in large trade sizes.9 Many of the firms’ clients had the direct access trade execution software on their desktop. However, the firm did have branch offices for trading throughout the United States. Most of the firm’s clients were situated in or nearby 39 metropolitan areas. The sample period for our study is October 7, 1999 to August 1, 2003. The data are in the form of a transaction database. For every order request, we have information such as the identity of the trader, the time of submission (execution), the market(s) where the order was sent, the original volume submitted, the executed volume, the execution price, the stock symbol, the order type, the contra party (if given up), the location of the trader in the U.S., and various other information. If the order received multiple fills, we have the information listed for each fill. The firm mainly attracted clients who had an interest in trading Nasdaq listed stocks. Nasdaq listed stocks comprise 95% of the trades in our overall data. The reason for this is that Nasdaq stocks trade in multiple trading venues. The primary benefit of using a direct access broker is the ability to route orders to various trading venues. In contrast, NYSE-listed trading is mainly confined to a single trading location.10
Therefore, clients opened an account at our firm with the primary intent of
benefiting their Nasdaq trading. In total, our data consists of over 10 billion executed shares with a trade value exceeding $101 billion. There are over 6 million orders and 8 million trades. The orders are submitted by 3,258 accounts on 4,667 securities. The overall data is filtered to include Nasdaq listed stocks during the main trading hours. We filtered the data to include Nasdaq stocks because these stocks represent a majority of the orders in our data and because of structural differences between how orders are executed in 9
For example, the average trade size in our sample is 1,218 shares. The average trade size on Nasdaq stocks during 2003 was 579 shares (Source: Nasdaq Market Center reports). 10 More than 80% of NYSE-listed volume was executed at the NYSE during our sample periods. This figure has remained fairly constant over the years, but it is likely to change with the NYSE’s recent acquisition of Archipelago and a push toward more automated electronic trading. Source for NYSE volume: www.nyse.com/pdfs/NYSEMarketQualityFeb2003.pdf.
7
dealer and specialist markets. Because trading before the open or after the close also occurs in a different manner, we excluded these orders too. Finally, we excluded orders on stocks in which we were not able to obtain relevant summary trading data from The Center for Research and Security Price (CRSP) database or intraday data from the Reuters tick history database.11 We link trading information from these two publicly available data sources to our proprietary data when conducting our empirical analysis. In total, we analyze more than 90% of the trading activity (trades) originating out of our sample firm’s direct access brokerage operation. And we examine the trading activity of 2,979 traders on 4,386 stocks. It is important to point out the data’s advantages to better understand intraday order execution quality. Suppose one of our traders feels Microsoft is undervalued and they wish to purchase 5,000 shares. At 9:40:10 a.m., the trader notices that there are 10,000 shares available in the Nasdaq market center with an $30.10 offering price, 5,000 shares available in The National Stock Exchange with an offering price of $30.11, and 20,000 shares available in The American Stock Exchange with an offering price of $30.12. The trader submits an order through the firms trading software with the parameters of executing at the best price available (across all market centers), paying no more than $30.12, and with an expiration time of 30 seconds. The order subsequently executes 1,000 shares on Nasdaq at 9:40:13 a.m. with a price of $30.10, 500 shares on The National Stock Exchange at 9:40:20 with a price of $30.11, 3,000 shares on The American Stock Exchange at 9:40:30 with a price of $30.12, and the remaining 500 shares go unexecuted. A researcher examining a transaction database, such as NYSE TAQ, would observe the initial Nasdaq best offer quote of $30.10 at 10,000 shares. These 10,000 shares at a price of $30.10 are not truly accessible, though, due to competition among other traders in the marketplace. The researcher would also observe the three trades.12 These trades may look favorable when examining
11
For information on Reuters tick history database, see http://about.reuters.com/productinfo/tickhistory/. Transaction data does not label trades as buys or sells, which is an important factor in assessing execution quality. Thus, researchers often use algorithms (e.g. Lee and Ready, 1991) to estimate which side initiated the 12
8
them at the effective spread in each individual market, but the cost of executing (along with the speed of executing) should be looked at in terms of the overall order placed, not each individual trade. Finally, the 500 unexecuted shares are completely unobservable to the researcher. In our data, the time to execute the entire order, the various prices paid across the order, the multiple trades associated with the order, the percentage of the order filled, etc. are all common features of order execution that are observable to us and subsequently analyzed.
However, these features are not recognizable in
commonly used transaction data. Publicly available order-level information databases would also not properly assess execution quality with this particular order. For example, a researcher examining market center execution quality (Dash 5) reports from Nasdaq would still only capture a small part of a trader’s execution. Narrowly computing order execution quality measures based on Nasdaq market execution is misleading, at least from the trader’s perspective. Therefore, our study provides a different perspective on execution quality by analyzing trader’s entire order execution process. Table 1 provides a summary of our data. We split the trading day observations into 13 half-hour periods and report trading activities accordingly. In aggregate, our trader’s intraday trading activity follows a similar pattern to the general U-shape market volume pattern. Aggregate trading measures such as the number of orders, trades, volume, and dollar value in the 9:30 to 10:00 a.m. period are more than twice that of the 12:31 to 1:00 p.m. period. Trading activity steadily declines from the morning to midday periods and then increases leading up to the close. The periods around the close are larger than the midday periods but the difference is not nearly as large as the difference with the morning period. While overall trading activity in our data follows a U-shape across the trading day, this does not mean that all traders follow this pattern individually.
trade and transaction costs are estimated accordingly (e.g. effective spreads). Another problem with transaction data is that it fails to uncover hidden quotes or reserve sizes with observable quotes. Many markets allow dealers these options and orders often interact with hidden quotes and reserve sizes after displayable quotes have been accessed. Bessembinder (2003a) provides an overview of some issues involved with estimating trade execution cost from transaction data.
9
To see this individual variation, we segregate traders by how they concentrate their trading in three trading periods, morning (9:30 to 11:00 a.m.), midday (11:01 a.m. to 2:30 p.m.), and closing (2:31 to 4:00 p.m.). We find that approximately one-half of the traders can either be classified as U-shape (concentrate their trading in the morning and closing periods) or humped-shape traders (concentrate their trading in the midday period).13 There are 910 and 543 U-shape and humped-shape traders respectively. Very few of the traders solely concentrate their trading at a particular time each day. For example, there are 52 traders who solely trade in the morning and closing period, while 94 traders exclusively trade in the midday period.
3. Empirical results 3.1. The speed and cost dimensions of execution quality Our empirical analysis is focused around examining the relation between execution speed and execution cost across the trading day. Execution speed and execution cost will vary according to the type of order submitted. Because direct access users (and other professional traders) have the ability to attach numerous conditions to their orders (e.g., price specifications, routing procedures, expiration times, etc.), we classify orders more generally as either marketable, which are market orders and marketable limit orders with a buy (sell) limit price set greater (less) than or equal to the national best offer (bid), or non-marketable, which are limit orders priced away from the inside quotes and not immediately executable. There are 2.3 million marketable orders and 2.9 million non-marketable orders executed by 2,979 traders on 4,386 stocks. Execution speed is computed as the difference in seconds
13
We calculate the percentage of trading (share basis) that occurs in each of the three periods on a daily basis. Because the midday period is three and one-half hours, and the opening and closing periods are only one and onehalf hours, we multiply the trading values in the morning/closing periods by 3.5/1.5 prior to calculating the trading percentages. We then calculate the average percentage for each trader in one of three periods. If both the morning and closing period percentages are greater than the midday period percentage, the trader is classified as a U-shape trader. On the other hand, if the midday period is greater than both the morning and closing periods, the trader is classified as a humped-shape trader.
10
between the original order submission time and the final trade execution time (share weighted across multiple trade orders). For marketable buy (sell) orders, we measure execution cost by calculating the effective spread, which is computed as twice the (negative) difference between the share-weighted execution price and the NBBO quote midpoint at the time of order submission.14 In order to calculate the effective spread, each order on every stock is matched with the corresponding national best bid or offer (NBBO) at the time of order submission using historical intraday tick data from Reuters. While the effective spread is a suitable measure of execution cost with marketable orders, it is not suitable for assessing execution cost with non-marketable orders. Limit orders are priced orders that execute on the opposite side of the market to marketable orders. This makes comparing the limit order execution price with the current quote midpoint less relevant for assessing execution cost. While limit orders enable traders to avoid paying the spread, they are susceptible to an adverse selection cost when (if) they execute. For example, a limit buy (sell) order is more likely to execute when the market price is falling (rising). Thus, it is important to compare the limit order execution price with the future market price in order to assess the severity of the adverse selection cost. We estimate non-marketable order execution cost following an approach used by Peterson and Sirri (2003), which complements a similar methodology used by Harris and Hasbrouck (1996). The ex post cost of executing a limit buy order is computed as the difference between the share-weighted execution price and the national best bid price five minutes after execution. The ex post cost of executing a limit sell order is computed as the difference between the national best offer price five minutes after execution and the share-weighted execution price. The mean (median) execution speed for marketable orders is 12 (4) seconds and for nonmarketable orders 65 (16) seconds. The standard deviation for marketable (non-marketable) orders is 54.7 (144.2). For execution costs, the mean (median) for marketable orders is 9.3 (3.1) cents and for 14
We also estimate our results using the raw execution speed and cost difference (not share-weighted). The results are qualitatively similar to those reported.
11
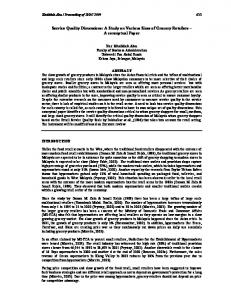
non-marketable orders 2.2 (0.3) cents. The standard deviation for marketable (non-marketable) orders is 27.6 (41.5). Figure 1 plots the mean execution speed and execution cost within each half hour of the trading day for both marketable orders and non-marketable orders. Order execution is slower during the middle of the trading day for both order types. Orders submitted around the open and close periods are executed more quickly than orders executed during the midday periods. For example, the average execution speed for marketable (non-marketable) orders in the 9:30 to 10:00 a.m. period is 11 (55) seconds and the average execution speed in the 3:31 to 4:00 p.m. period is 9 (59) seconds. In contrast, the average execution speed in the 12:31 to 1:00 p.m. period is 14 (77) seconds. While execution speed is representative of a humped-shape pattern, execution cost is representative of a U-shape pattern. For example, the average execution cost for marketable (non-marketable) orders submitted in the 9:30 a.m. to 10:00 a.m. period is 12.0 (2.4) cents and the average execution cost in the 3:31 to 4:00 p.m. period is 10.3 (3.6) cents. In contrast, the average execution cost in the 12:31 to 1:00 p.m. period is 8.3 (1.8) cents. While the graphs depict an intraday tradeoff between speed and cost, we would like to more formally test the statistical significance of the relation between the half-hour intraday time periods. Moreover, there are multiple order/stock/trader characteristics and market conditions that can impact both execution speed and execution cost. For example, the size of an order or the volatility in the market could reasonably impact both speed and cost. Therefore, we examine the intraday tradeoff between speed and cost while simultaneously controlling for various factors that might impact execution speed and execution cost. For execution cost, we estimate an ordinary least square (OLS) regression that takes the format:
12
where execution cost represents the effective spread (or ex-post cost) for each order i at time t. The independent variables include 12 half-hour time dummies, D, which represent each half-hour time interval, j, of the trading day (the 12:31 to 1:00 p.m. interval is represented in the intercept term), and a series of control variables: size of the order (shares), limit order aggressiveness (non-marketable orders only), which is computed for buy orders by subtracting the NBBO midpoint at the time a trader submits their order from the limit price and for sell orders by subtracting the limit price from the NBBO midpoint, NBBO percentage spread at the time of order submission (100*(ask price –bid price )/midpoint price), depth at the inside price, which for marketable buy (sell) orders is the ask (bid) depth at the time of order submission and vice versa for non-marketable orders, total trading volume on the stock within the half-hour interval, price volatility within the half-hour interval, which is computed by subtracting the minimum execution price from the maximum execution price and dividing the difference by the average execution price within the half-hour interval, a dummy variable that takes the value of 1, or 0 otherwise, if the order is placed after decimalization,15 the prior year-end market capitalization for the stock, the prior year-end price for the stock, and the prior year average daily turnover for the stock (volume / shares outstanding).16
15
On Nasdaq, stocks were phased into decimal pricing over three phase-in dates beginning March 12, 2001 and ending April 9, 2001. Our post-decimal period runs from April 16, 2001 to August 1, 2003. We begin one week after the last phase-in date to take out any unusual effects which may have occurred immediately after the event. 16 We use the Center for Research and Security Price (CRSP) database to obtain related stock data. While we use continuous variables to control for stock-specific effects, an alternative approach is to classify stocks into groups and use category dummies in the regression. We use this alternative approach as a robustness check for our reported results. Since our sample includes more than 4,000 stocks and over 2 million orders, we categorize stocks into groups that share similar characteristics in order to make our computations more feasible. The traded stocks are sorted into 125 classification groups using a 5*5*5 portfolio sorting procedure based on average annual market capitalization, turnover and price data over the period 1999 through 2003. The inverse relation between speed and cost occurs in the regression using the alternative classification procedure.
13
In addition to the order (order size and order price), market condition (spread, depth, volume, and volatility), tick size (decimalization), and stock (market capitalization, price, and turnover) control variables listed above, we also control for trader-specific effects. Because there is close to 3,000 traders in our sample, we classify traders into groups and use category dummies in the regression to make our computations more feasible.17 The traders are sorted into 25 groups using a 5*5 sorting procedure based on two trader characteristics: 1) the average daily number of orders executed and 2) the average order size. Traders who have the highest (rank #1 out of 5) average daily number of orders executed and the highest average order size are classified as group 1, traders who have the highest average daily number of orders executed and the second highest (rank #2 out of 5) average order size are classified as group 2, and so forth for the remaining 25 combinations. How active a trader is, or the size in which a trader trades in, may serve as good proxies for the financial sophistication level of a trader. The sophistication level of a trader could also reasonably affect our two measures of execution quality. While we use OLS to estimate the determinants of execution cost, it is not appropriate to use for estimating the determinants of execution speed because it ignores censoring (i.e., a cancellation of an order censors the duration of execution). Thus, we use survival (or duration) analysis to estimate a model that takes censoring into account. Specifically, we use an accelerated failure time (AFT) model that assumes execution speed follows a Weibull distribution. The Weibull accelerated failure time model includes the same half-hour time dummies and control variables reported previously with the OLS regression and takes the format:
17
The trader dummies for the various classifications are not reported in the Tables for brevity. We run our results both with and without these trader dummies and the inverse relation between speed and cost occurs both with and without the trader controls.
14
The regression results for our parametric models are reported in Tables 2 (marketable orders) and 3 (non-marketable orders). For execution cost, the time dummy coefficients are representative of a U-shape pattern across the trading day (recall, the intercept term represents the 12:31 to 1:00 p.m. interval). Controlling for order characteristics, market conditions, tick size, and stock and trader characteristics, we find the execution cost for marketable (non-marketable) orders in the 9:30 to 10:00 a.m. period is 5.96% (5.10%) higher than that for the midday benchmark period and the execution cost for the 3:31 to 4:00 p.m. period is 2.28% (12.88%) higher.18 For execution speed, the time dummy coefficients are representative of a humped-shape pattern across the trading day. In order to interpret the coefficients for the AFT model, consider the marketable order regression. The coefficients for the 9:30 to 10:00 a.m. period and the 3:31 to 4:00 period are -0.0891 and -0.1470 respectively. This implies that the 9:30 to 10:00 a.m. period has an average order execution speed 8.53% (e—0.0891-1) faster than the midday benchmark period (12:31 to 1:00 p.m.) and the 3:31 to 4:00 p.m. period has an average order execution speed 13.67% (e-0.1470-1) faster than the midday benchmark period. The control variable coefficients reveal some interesting factors that influence order execution quality, as well as how order execution quality patterns vary over time. For example, order execution becomes slower and less costly after the implementation of a smaller increment for trading, such as decimalization. These occurrences are consistent with theoretical predictions and empirical findings concerning tick size reduction. When a reduction in the tick size occurs, traders become less willing to display size with their orders for fear that smaller traders will step ahead of them (Harris, 1999). This leads traders to trade in smaller sizes. Liquidity then becomes harder to find (or markets become less transparent) and order execution subsequently takes longer. While order execution takes longer after a
18
The intercept for the marketable regression is 0.4127. The execution cost coefficient for the 9:30-10:00 a.m. period is 0.0246. Thus, the percentage can be calculated by [(0.4127+0.0246)/0.4127]-1 (note, the coefficients are rounded). The other percentages cited are calculated in a similar fashion.
15
tick reduction, execution cost (e.g. effective spread) declines as competition among traders tends to drive the quoted bid-ask spread to its minimum level. The sharp decline in quoted bid-ask spreads has been documented with transaction data in numerous studies (see, for example, Bessembinder, 2003b and GAO, 2005).
3.2. Robustness checks We conduct two robustness checks for our main results.19 First, we look more closely at speedcost tradeoff patterns in relation to whether an order is fully executed or partially executed. Order submission size does not always equal order execution size. It is difficult to theorize on the precise reason why a particular order does not fully execute. Orders may not fully execute if various conditions attached to an order are not met, a traders preferences may change due to changing market conditions, etc. While we do not know the precise reason why certain orders do not execute in their entirety, we are interested in seeing if speed-cost tradeoff patterns occur for orders which are both fully executed and partially executed. This is of interest because when computing execution quality measures, our measurement interval spans from traders original submission to their last (partial) trade execution. Orders that are cancelled prior to fully executing could severely bias this measure. However, if the offsetting patterns between speed and cost occur for both fully executed orders and partially executed orders (orders with a cancellation), then partially executed orders would not seem to have a significant effect on our overall findings. We sort the 5.2 million orders into fully executed orders (submission order size = executed order size) and partially executed orders. Of the 5.2 million orders, approximately 3.2 million orders are 100% filled.
19
We conduct our baseline OLS and AFT regressions for both marketable orders and non-
The robustness results are not reported for brevity. They are available upon request.
16
marketable orders. The regression results indicate that the same speed-cost tradeoff patterns are prevalent among the time dummy coefficients whether an order is fully executed or partially executed. For our second robustness check, we attempt to align trading activity in our sample more closely with overall Nasdaq trading activity. Trading activity in our sample follows a U-shape pattern across the trading day which is consistent with overall stock trading activity in the marketplace. Moreover, it is evident from casual observations of the data that the more actively traded stocks in our data are also the best known and the more actively traded stocks in the Nasdaq market (e.g., Microsoft, Dell, Cisco, etc). Our data seems fairly representative of Nasdaq trading activity in general. Nevertheless, we would like to formally ensure that the speed-cost tradeoff patterns which we observe are occurring on Nasdaq’s most actively traded (and important) stocks. It is possible that the speed-cost tradeoff patterns we observe are precluded to certain stocks traded by our traders, and that these particular stocks are rarely traded by other traders in the marketplace. In order to examine this issue further, we select stocks for analysis that have 1,000+ orders in our data and stocks that are in the top 30% of the most actively traded Nasdaq stocks. Stock activeness on Nasdaq is based on the average annual volume over the four year sample period. There are 326 stocks that meet this in sample and out of sample criteria. We conduct our baseline OLS and AFT regressions for both marketable orders and non-marketable orders. The regression results indicate that the same speed-cost tradeoff patterns are prevalent among the time dummy coefficients for the more actively traded stocks.
4. Explanation of results Our empirical results indicate that execution cost and execution speed exhibit offsetting intraday time dependent patterns. The inverse relation between speed and cost has been found in other settings. For example, Boehmer (2005) finds that smaller Nasdaq orders are executed more
17
quickly than smaller NYSE orders, but they experience higher execution costs. On the other hand, larger Nasdaq orders take longer to execute than larger NYSE orders, but they experience lower execution costs. Boehmer attributes these finding to how informed traders submit their orders and the difference in trading protocols between the two markets. On Nasdaq, trading occurs in multiple markets. The best way for informed traders to protect their private information is to split up their orders and trade quickly against published dealer quotes and public limit orders in the different execution venues.20 In our study, we analyze order execution quality patterns across the trading day rather than across markets. Moreover, we analyze Nasdaq stock trading only. Despite these and some other data differences with Boehmer’s (2005) study, it seems reasonable that the speed-cost tradeoff pattern, which we observe intraday, can also be attributed to the actions of informed traders. For example, the financial literature posits that trading is more informative around the open and close of trading than it is during the middle of the day (e.g. Admati and Pfleiderer, 1988). Informed traders prefer to trade around the open and close because liquidity trading is more concentrated, which enables informed traders to better conceal their identity. Informed traders’ increasing presence around the open and close leads to higher volatility and wider bid-ask spreads and, on average, a higher order execution cost (e.g. effective spread). Execution speed should, on average, decline around the open and close of trading if more informed traders enter the market. In competitive securities markets, information horizons are relatively short and informed traders will seek to execute quickly before competitive forces begin to erode (eliminate) their information advantage. Informed traders preference for executing quickly will, in turn, result in a shorter time to execution for uninformed traders. Short information horizons and informed traders preference for fast execution are standard modeling assumption in much
20
Order splitting is more difficult with NYSE stocks because orders are executed sequentially at a centralized location. Thus, informed traders prefer to submit their large orders directly to the specialist who, in turn, executes them against published quotes or limit order quotes.
18
of the market microstructure literature, which assumes informed traders (exclusively) use market orders (see, for example, Rock, 1990 and Glosten, 1994). We examine if variations in informed trading levels occur by analyzing our data at both the aggregate level and the individual trader level. Our focus is on order characteristic and price impact patterns (i.e. informed trading proxies) across the trading day. We suspect that some of the traders (orders) in our data are more informed (informative) than others. Nevertheless, our interest is in observing if higher levels of informed trading tend to occur around the open and close of trading. If so, this result would be consistent with the notion that more informed trader’s trade around the open and close, and it would lend support to our hypothesis on why intraday speed-cost tradeoff patterns occur. While we use order characteristic and price impacts to proxy for informed trading patterns within our sample, they also provide some insight into informed trading patterns in the overall market (or outside of our sample). We discuss why this is the case below.
4.1. Aggregate level analysis of informed trading patterns 4.1.1. Order characteristics Smaller orders on Nasdaq stocks are more likely to be informative because informed traders are assumed to spilt up their orders across the different execution venues. If trading within our sample is consistent with overall trading patterns in the Nasdaq market, we expect to find smaller order sizes around the open and close of trading due to the increasing presence of informed traders. In Figure 2, we plot order size and some other relevant order characteristic patterns across the trading day. The average size of an order in the 9:30 to 10:00 a.m. interval is for 1,450 shares and the average size of an order in the 3:31 to 4:00 p.m. interval is for 1,412 shares. In contrast, the average size of an order in the 12:30 to 1:00 p.m. interval is for 1,690 shares. Order size in the opening (closing) half-hour interval is more than 16% smaller than the midday period. Order size clearly exhibits a humped-shape pattern
19
across the trading day. While order size is smaller around the open and close, it also takes more trades to execute these smaller orders. This result may, in part, be due to general changes in the marketplace. For example, if other traders in the market prefer to trade in smaller sizes too, this could easily result in our trader’s smaller orders being split up even further upon execution. In any case, our results indicate that traders engage in smaller size trading around the open and close of trading. We examine the percentage of marketable orders (versus non-marketable orders) as well as trader’s usage of different execution venues across the trading day. Informed traders on Nasdaq are more likely to trade quickly against published dealer quotes and public limit orders in the different execution venues, or informed Nasdaq traders are: 1) more likely to submit marketable orders and 2) more likely to use a wider array of execution venues. With respect to execution venue choice, these (and other) traders basically had two general options with where to execute their Nasdaq stock orders during our sample period. Traders could either execute their orders on an Electronic Communication Network (ECN) or with a Nasdaq market maker. During our sample period, ECNs were involved in a significant portion of Nasdaq trading activity and informed traders often chose to trade on ECNs rather than with Nasdaq market makers (see, for example, Barclay et al. 2003). ECNs are attractive to informed traders for many reasons, including their completely anonymous trading environment. We know that our sample traders heavily use ECNs (more than 70% of the time) and that ECN usage patterns across the day resemble overall trading activity patterns reported in Table 1.21 Because informed traders on Nasdaq stocks prefer to split up their orders and simultaneously submit them to different execution venues, trader’s usage of different execution venues should vary across the trading day. In periods when the informed are more active, we expect trading activity to be more dispersed over a wider array of execution venues.
In order to examine if this is the case, we calculate an execution venue
concentration measure by summing the squares of the total percentage of trading volume (shares) 21
Trading occurred on nine ECNs during our sample period, but not all ECNs were in operation across our entire sample period. Traders traded with market makers directly and by using electronic trading systems run by Nasdaq.
20
executed on each execution venue for each half-hour of the trading day.
Our execution venue
concentration measure is calculated similar to the Herfindahl index. In total, traders use 16 execution venues but trader’s usage of different execution venues varies. In general, we know that traders heavily use ECNs across our sample period and that ECN usage is highest in the opening and closing hours of the trading day. We can now see from Figure 2 that traders submit more marketable orders and that trading is less concentrated on particular execution venues in the opening and closing hours. These results are indicators of more informative trading around the open and close of trading. While traders submit more marketable orders around the open and close, they submit more non-marketable orders than marketable orders in each half-hour period. Approximately 55% of the 5.2 million orders are non-marketable. With non-marketable orders, traders must specify a limit price with their order. The limit price is of interest because it influences the probability of execution and may provide additional insight for explaining order execution quality patterns. The limit price can set the best price in the market, match the best price in the market, or be inferior to the best price in the market. In Figure 3, we examine traders limit order pricing behavior across the trading day. For each order, we compare the limit order price to the NBBO at the time of order submission. During the first half hour of trading, approximately 20% of the limit order prices are better than the best price in the market (i.e. price setting orders), 60% of the limit order prices equal the best price in the market, and 20% of the limit order prices are below the best price in the market. During the middle of the trading day, traders become less aggressive with pricing their limit orders. For example, during the middle of the day approximately 15% of the limit orders set the best price in the market, 61% equal the best price in the market, and 24% are below the best price in the market. As the close of trading draws near, traders become more aggressive with pricing their limit orders again. This may help explain why limit order execution speeds are faster around the open and close of trading. It may also indicate that some
21
informed traders use aggressively priced limit orders around the open and close of trading in replace of, or in addition too, marketable orders. For example, suppose the national best bid (NBB) is $10.00 and the national best offer (NBO) is $10.05. If an informed trader feels the stock is undervalued and wishes to buy, the trader could submit a marketable buy order to trade at a price of $10.05 (or above), or an aggressive priced limit order at say $10.04 (price setting order on the bid side of the market). The potential for price improvement with the limit order may outweigh a delay in execution, or risk of no execution at all.
4.1.2. Price impacts In addition to order characteristics, price impacts are useful for identifying informed trading patterns. Price impacts measure the change in the NBBO midpoint five minutes after a trader’s order is executed. We compute price impacts for both marketable orders and non-marketable orders. If trading among our sample traders is consistent with overall trading patterns in the market then we expect, on average, marketable order price impacts to be positive and to exhibit a U-shape pattern across the trading day i.e. average price impacts will be more pronounced around the open and close of trading as more informed traders become active during these times. Price impacts with non-marketable orders are of interest because they provide insight into informed trading patterns in the overall marketplace (outside of our sample). When traders place a limit order in the market, we expect, on average informed traders who are present in the market to trade against the limit order. Recall, these traders have direct access for placing their limit orders (through ECNs) in the market and all traders can observe their limit orders on Level II data feeds. Thus, on average, price impacts should be negative with non-marketable orders. And because there are more informed traders present around the open and close, non-marketable order price impacts should be more negative around the open and close than during the middle of the day.
22
The mean (median) price impact for marketable orders is 4.6 (0.5) cents and the price impact for non-marketable orders is -3.4 (-0.5) cents. The standard deviation for marketable (non-marketable) orders is 44.5 (42.1). The results are consistent with the notion that traders are more inclined to execute their orders immediately when they posses short-term private information. In order to examine the intraday patterns with price impacts, we first calculate the average price impact for each half-hour interval. These results are reported in Figure 4. We also test the statistical significance of the relation between the various intraday time periods. In order to do this, we estimate an OLS regression similar to Eq. (1). The only difference is that price impacts, rather than execution cost, are used as the dependent variable. The regression results are reported in Table 4. The average price impact for marketable orders is positive across the trading day. The price impact pattern with marketable orders does not resemble a clear U-shape across the trading day. Price impacts are highest just after the open and then they decline toward midday (always remaining positive). However, price impacts do not exhibit a steady rise toward the end of the day. While there is a rise in the average price impact in the last half-hour period of the day, it is not statistically significant in the regression result. The lack of a clear (positive) rise in marketable order price impacts towards the end of the trading day may be due to traders desire to close out of their positions by the end of the day rather than motivated by information. When traders place limit orders in the market, the average price impact across the day resembles an inverted U-shape pattern. For example, price impacts are more negative around the open and close than during the middle of the day. These patterns are indicative of higher levels of informed trading in the overall marketplace around the open and close.
4.2. Individual trader level analysis of informed trading patterns We examine if variations in informed trading levels occur across the trading day by analyzing our data at the individual trader level, too. First, we perceive traders to be informed or uninformed based
23
on their trading characteristics (i.e. informed trading proxies), and then verify whether the more informed trade more in the opening and closing hours. We use three informed trading proxies to classify traders: 1) ECN usage 2) average order size and 3) average price impact. According to the financial literature, informed traders on Nasdaq are more likely to use ECNs, trade in smaller sizes, and incur greater price impacts with their orders. For example, Barclay et al. (2003) find that ECN trades are smaller and have price impacts that are 50% higher than market-maker trades. They conclude that informed traders often use ECNs. Therefore, we classify traders as informed if: 1) their ECN usage (total shares executed on ECNs divided by total shares executed) is among the top 30% of all traders 2) their average order size is among the bottom 30% of all traders and 3) their average price impact is among the top 30% of all traders. Figure 5 depicts trading activity across the day for informed traders. Traders who direct the largest portion of their trading activity to ECNs, trade in the smallest order sizes, and have the highest price impacts associated with their orders trade more in the opening and closing hours. In Table 5, we compare execution speed differences between (perceived) informed traders and traders in the opposite percentage group (e.g., top 30% vs. bottom 30%). Traders in the opposite percentage group are considered uninformed. For both marketable orders and non-marketable orders, informed traders execute their orders faster than uninformed traders. The difference in execution speed between both groups of traders is significantly different from zero in all cases. In some instances, the speed difference is quite large. For example, traders who direct the largest portion of their trading to ECNs execute their marketable (non-marketable) orders in 7 (55) seconds while traders who direct the smallest portion of their trading to ECNs execute their marketable orders in 23 (78) seconds. The differences in execution speed are consistent with the general notion that information is time sensitive in competitive securities markets and that, on average, informed traders will execute their orders faster than uninformed traders.
24
5. Conclusion Our paper examines order execution quality dimensions and their intraday time variation patterns. We focus on two dimensions of execution quality: execution speed and execution cost. While previous studies have used transaction data to better understand execution quality over the trading day, they have been largely one-dimensional in focus (e.g. execution cost). And while Boehmer (2005) goes beyond cost and provides the first systematic evidence of an inverse relationship between execution speed and execution cost, he examines monthly aggregate market center execution reports rather than time-stamped order level data. Thus, he is unable to provide any information into how speed-cost tradeoff patterns vary across the trading day. Our study provides some differential insight into intraday execution quality patterns by examining proprietary order-level data rather than trade execution reports. The data enables us to trace 5.2 million Nasdaq stock orders (9 billion shares) from their initial submission to final execution. The orders originate from 2,979 brokerage accounts dispersed throughout the U.S., over a near fouryear period. The traders have direct access to quotes and orders displayable in all major U.S. trading venues, and they access these quotes and orders without broker intervention. In the aggregate, traders’ trading activity coincides with overall market trading activity (U-shape pattern). Execution quality dimensions exhibit strong intraday time-varying properties. The time to execute orders exhibits a humped-shape pattern across the trading day, while execution cost exhibit a U-shape pattern. We reconcile these offsetting patterns with variations in informed trading levels. When more informed traders are present in the market around the open and close of trading, more price volatility occurs and execution cost (e.g. effective spread) rises. However, execution speed declines around the open and close. In competitive securities markets information is short-lived and informed traders will have a strong preference for executing quickly, which will result in shorter execution times for all traders. We find indicators suggesting that trading becomes more informative
25
around the open and close of trading. For example, ECN usage (i.e. anonymous trading) increases, order sizes are smaller, and price impacts are higher around the open and close of trading. Moreover, traders who direct the largest portion of their trading activity to ECNs, trade in the smallest order sizes, and have the highest price impacts associated with their orders concentrate their trading around the open and close of trading and their execution speeds are significantly faster than traders who direct the smallest portion of their trading activity to ECNs, trade in the largest order sizes, and have the smallest price impacts associated with their orders. When to trade is an important decision for many market participants and our results highlight some complexities that can arise with this decision. The multiple dimensions of execution quality do not exhibit uniform time-varying patterns. In fact, as we show, speed and cost exhibit offsetting intraday trading patterns. Traders will have different preferences for execution speed, execution cost, and other dimensions of execution quality based on their different trading strategies and objectives. A starting point in considering when to trade is for traders to identify what dimension(s) of execution quality is most important to them. Our results provide insight into the time series properties of two of these dimensions. It would be interesting to empirically examine how these results might differ in financial markets with different trading structures, particularly in markets outside of the U.S. Such analyses would provide a richer understanding into the relationship between market design and the intraday timevarying properties of execution quality.
References Admati, A.R., Pfleiderer, P., 1988. A theory of intraday patterns: volume and price variability. Review of Financial Studies 1, 3-40. Bacidore, J., Ross, K., Sofianos, G., 2003. Quantifying market order execution quality at the NYSE. Journal of Financial Markets 6, 281-307.
26
Barclay, M.J., Hendershott, T., McCormick, T., 2003. Competition among trading venues: information and trading on electronic communication networks. Journal of Finance 58, 2637-2665. Battalio, R., Hatch, B., Jennings, R., 2003. All else equal? A multidimensional analysis of retail, market order execution quality. Journal of Financial Markets 6, 143-162. Bessembinder, H., 1999. Trade execution costs on NASDAQ and the NYSE: a post reform comparison. Journal of Financial and Quantitative Analysis 34, 387-407. Bessembinder, H., 2003a. Issues in assessing trade execution costs. Journal of Financial Markets 6, 233257. Bessembinder, H., 2003b. Trade execution costs and market quality after decimalization. Journal of Financial and Quantitative Analysis 38, 747-777. Bessembinder, H., Kaufman, H., 1997a. A comparison of trade execution costs for NYSE and NASDAQlisted stocks. Journal of Financial and Quantitative Analysis 32, 287-310. Bessembinder, H., Kaufman, H., 1997b. A cross-exchange comparison of execution costs and information flows for NYSE-listed stocks. Journal of Financial Economics 46, 293-319. Boehmer, E., 2005. Dimensions of execution quality: recent evidence for US equity markets. Journal of Financial Economics 78, 553-582. Boehmer, E., Jennings, R., Wei, L., 2007. Public disclosure and private decisions: equity market execution quality and order routing. Review of Financial Studies 20, 315-358. Brock, W., Kleidon, A., 1992. Periodic market closure and trading volume: a model of intraday bids and asks. Journal of Economic Dynamics and Control 16, 451-489. Chan, J., Lakonishok, J., 1997. Institutional equity trading costs: NYSE versus Nasdaq. Journal of Finance 52, 1147-1174. Chan, K.C., Christie, W.G., Shultz, P.H., 1995. Market structure and the intraday pattern of bid-ask spreads for Nasdaq securities. Journal of Business 68, 35-60. Easley, D., Kiefer, N., O’Hara, M., 1996. Cream-skimming or profit sharing? The curious role of purchased order flow. Journal of Finance 51, 811-834. Foster, F.D., Viswanathan, S., 1993. Variations in trading volume, return volatility, and trading costs: evidence on recent price formation models. Journal of Finance 48, 187-211. Glosten, L.R., 1994. Is the electronic open limit order book inevitable? Journal of Finance 49, 1127-1161. Goldberg, D., Lupercio, A., 2004. Cruising at 30,000, semi-pro numbers level off, but trading volumes rise. Bear Stearns Company Report, August.
27
Government Accountability Office (GAO), 2005. Decimal pricing has contributed to lower trading costs and a more challenging trading environment. GAO Report 2005, Report available online at: http://www.gao.gov/new.items/d05535.pdf Harris, L., 1986. A transaction data study of weekly and intradaily patterns in stock returns. Journal of Financial Economics 16, 99-117. Harris, L., 1999. Trading in pennies: a survey of the issues. Working Paper, University of Southern California. Harris, L., Hasbrouck, J., 1996, Market vs. limit orders: the SuperDot evidence on order submission strategy. Journal of Financial and Quantitative Analysis 31, 213-231. Huang, R., Stoll, H., 1996. Dealer versus auction markets: a paired comparison of execution costs on Nasdaq and the NYSE. Journal of Financial Economics 41, 313-357. Jain, P., Joh, G., 1988. The dependence between hourly prices and trading volume. Journal of Financial and Quantitative Analysis 23, 269-283. Keim, D.B., Madhaven A.N., 1997. Transaction costs and investment style: an inter-exchange analysis of institutional equity trades. Journal of Financial Economics 46, 371-398. Lee, C., 1993. Market integration and price execution for NYSE-listed securities. Journal of Finance 48, 1009-1038. Lee, C., Ready, M.J., 1991. Inferring trade direction from intraday data. Journal of Finance 46, 733-747. Macey, J.R., O’Hara, M., 1997. The law and economics of best execution. Journal of Financial Intermediation 6, 188-223. Moulton, P.C., 2005. You can’t always get what you want: trade-size clustering and quantity choice in liquidity. Journal of Financial Economics 78, 89-119. Peterson, M., Sirri, E., 2002. Order submission strategy and the curious case of marketable limit orders. Journal of Financial and Quantitative Analysis 37, 221-241. Peterson, M., Sirri, E., 2003. Order preferencing and market quality on U.S. equity exchanges. Review of Financial Studies 16, 385-415. Rock, K., 1990. The specialist’s order book and price anomalies, Working paper, Harvard University. Wood, R., McInish, T., Ord, J., 1985. An investigation of transaction data for NYSE stocks. Journal of Finance 40, 723-739.
28
Table 1 Trading Activity by Time of Day This table reports intraday trading statistics for 2,979 traders, who conducted their trading through a U.S. broker dealer during October 7, 1999 to August 1, 2003. The intraday trading statistics are compiled for each half-hour period, over the main market hours 9:30 a.m. to 4:00 p.m. Time
Orders (000’s)
Trades (000’s)
Trading volume (000’s)
Dollar volume (000’s)
9:30 a.m. to 10:00 a.m. 10:31 a.m. to 11:00 a.m. 11:01 a.m. to 11:30 a.m. 11:31 a.m. to 12:00 p.m. 12:01p.m. to 12:30 p.m. 12:31 p.m. to 1:00 p.m. 1:01 p.m. to 1:30 p.m. 1:31 p.m. to 2:00 p.m. 2:01 p.m. to 2:30 p.m. 2:31 p.m. to 3:00 p.m. 3:01 p.m. to 3:30 p.m. 3:31 p.m. to 4:00 p.m.
617.1 489.8 423.3 375.3 318.6 281.2 293.9 324.7 356.3 377.7 395.0 388.5
922.3 714.3 610.8 538.0 454.2 402.3 418.4 466.6 520.2 553.6 583.7 582.1
1,049,755.6 854,162.6 755,074.1 677,000.7 572,378.3 512,557.5 537,054.9 563,055.5 590,843.5 626,573.0 628,297.5 602,517.4
$11,136,014.2 $8,653,174.3 $7,384,813.7 $6,434,309.1 $5,384,177.9 $4,879,931.1 $4,989,886.1 $5,794,324.7 $6,657,135.9 $7,196,597.4 $7,940,829.1 $8,146,442.4
Total
5,238.3
7,649.3
8,989,952.6
$95,268,214.2
29
Figure 1 Intraday Order Execution Patterns: Execution Speed vs. Execution Cost These figures display the mean order execution time and order execution cost, for both marketable orders and non-marketable orders, during each intraday half hour period (9:30 a.m. to 4:00 p.m.). The results are based on 5.2 million stock orders (9 billion shares), submitted by 2,979 accounts at a U.S. broker dealer during October 7, 1999 to August 1, 2003. Execution speed is computed in seconds from initial submission to final execution (share-weighted for multiple trade orders). For marketable buy (sell) orders, execution cost represents the effective spread, which is computed as twice the (negative) difference between the share-weighted execution price and the national best bid and offer (NBBO) quote midpoint at the time a trader submits their order. For non-marketable orders, execution cost represents the ex-post cost of transacting which is computed as the difference between the national best bid or offer (bid for buys and offer for sells) five minutes after execution and the share-weighted execution price.
30
Table 2 Marketable Order Execution Quality: Regression Results This table provides regression results highlighting execution cost and execution speed patterns across the trading day. The results are based on 2.3 million marketable orders, submitted by 2,979 traders at a U.S. broker-dealer during October 7, 1999 to August 1, 2003. Execution speed is computed in seconds from initial submission to final execution (share-weighted for multiple trade orders). Execution cost represent the effective spread, which is computed as twice the (negative) difference between the shareweighted execution price and the national best bid and offer (NBBO) quote midpoint at the time a trader submits their order. Execution cost and execution speed observations are used as dependent variables in two separate regressions. For execution cost, an ordinary least square (OLS) regression is estimated. For execution speed, an accelerated failure time (AFT) model is estimated, which assumes execution speed follows a Weibull distribution. Independent variables include: time dummies for each half period (the 12:31 to 1:00 p.m. interval represents the intercept), log order size (shares), NBBO percentage spread (100*(ask price –bid price )/midpoint price) at the time a trader submits their order, log depth at the inside price (offer depth for buy orders and bid depth for sell orders) at the time a trader submits their order, log total trading volume on the stock within the half-hour interval, price volatility within the half-hour interval, which is computed by subtracting the minimum execution price from the maximum execution price and dividing the difference by the average execution price within the half-hour interval, a dummy variable that takes the value of 1, or 0 otherwise, if the order is executed after decimalization, the prior year-end log market capitalization of the stock, the prior year-end price of the stock, and the prior year average daily turnover (volume/shares outstanding) of the stock. In addition to the reported controls, both regressions also use dummies to control for trader-specific effects. The 2,979 traders are sorted in 25 groupings using a 5*5 sorting procedure based on trader’s average daily number of orders executed and average order size. The trader controls are not reported. The p-values for the coefficient estimates are reported in the Table.
31
Dependent Variable =
Execution Cost Coefficient
Intercept b(9:30 – 10:00) b(10:01 – 10:30) b(10:31 – 11:00) b(11:01 – 11:30) b(11:30 – 12:00) b(12:01 – 12:30) b(1:01 – 1:30) b(1:31 – 2:00) b(2:01 – 2:30) b(2:31 – 3:00) b(3:01 – 3:30) b(3:31 – 4:00) Log(Order share size) NBBO % spread Log(Bid/Ask depth) Log(Half-hour volume) Half-hour price volatility Decimal pricing dummy Log(Market capitalization) 1/Price Turnover
0.4127 0.0246 0.0189 0.0096 0.0059 0.0040 -0.0012 0.0024 0.0028 0.0044 0.0063 0.0096 0.0094 -0.0075 0.0067 -0.0144 -0.0003 -0.0005 -0.0655 -0.0040 -0.0098 0.5959
Trader Controls Adj. R2 Log Likelihood Obs. (000’s)
Yes 11.35%
p-value